Theoretical and Experimental Study on the Effect of end Chain Length on Ultraviolet Absorption Behavior and Photostability of Alkoxy Benzoate Based Liquid Crystals
Ahmed M. El Defrawy1,2, Said Z. Mohammady1,3, Marwa G. Elghalban1,2 and Hossa F. El Sharief1
1Department of chemistry, Faculty of Applied Science, Umm Al-Qura University, Makkah, Saudi Arabia.
2Department of chemistry, Faculty of Science, Mansoura University, Egypt.
3Department of chemistry, Faculty of Science, Cairo University, Egypt.
Corresponding Author E-mail: ameldefrawy@gmail.com
DOI : http://dx.doi.org/10.13005/ojc/330317
Liquid crystals homologous of 4-(4-chlorobenzoyloxy)phenyl 4-(n-alkoxy)benzoate (nCBPAB: n=8,14,16, where n is the number of carbon atoms in the alkoxy chain) were prepared and investigated for their liquid crystalline properties. The geometrical parameters and atomic charge distribution of the nCBPAB structures under investigation have been calculated using DFT level of calculation applying the B3LYP/6-31G(d) basis set. TD-DFT calculations have been used to predict the absorption spectra of the considered molecules. Furthermore, theoretically predicted molecular descriptors have been used to correlate with the phase stability of these molecules. In addition to that, the photo stability of these molecules has been investigated which provide valuable data for experimental applications.
KEYWORDS:liquid crystals; DFT; Photostability; ovality
Download this article as:| Copy the following to cite this article: El Defrawy A. M, Mohammady S. Z, Elghalban G. M, El Sharief H. F. Theoretical and Experimental Study on the Effect of end Chain Length on Ultraviolet Absorption Behavior and Photostability of Alkoxy Benzoate Based Liquid Crystals. Orient J Chem 2017;33(3). |
| Copy the following to cite this URL: El Defrawy A. M, Mohammady S. Z, Elghalban G. M, El Sharief H. F. Theoretical and Experimental Study on the Effect of end Chain Length on Ultraviolet Absorption Behavior and Photostability of Alkoxy Benzoate Based Liquid Crystals. Orient J Chem 2017;33(3). Available from: http://www.orientjchem.org/?p=33005 |
Introduction
The research of investigating new liquid crystal (LC) molecules has become one of the most fascinating topics in chemistry and materials science particularly. These materials, which are known to show properties that are an intermediate among solids and liquids known as “mesophases,” are gaining a great interest nowadays 1-3. The motivation behind these studies is to investigate its structure in order to tune and modify its technological properties such as in temperature sensors, electro-optic displays etc. Most mesogenic molecules consists of an aromatic core attached to one or two alkyl chains 4 that influence the properties of these molecules such as transition temperature 5–8. The development of such a different types and phase of liquid is closely related to the molecular structure of these molecules 9,10. Subsequently, to correlate the molecular structure with liquid crystal properties at the molecular level remains a subtle objective. To investigate the key role of molecular interactions in these compounds, several quantum mechanical studies have been led out by several workers 11–27.
The purpose of this work is to theoretically calculate molecular properties of the chosen model liquid crystal molecules and correlate them with experimentally measured properties. Model molecules used in this study involve 4-(4-chlorobenzoyloxy)phenyl4-(n-alkoxy)benzoate homologous series. Quantum chemical calculations were conducted utilizing TDDFT method using DFT/ B3LYP level of calculations with 6-31G(d) basis set in addition to semiemperical calculations using the PM7 hamiltonian to acquire molecular properties and the electronic spectra for the molecules under investigation. The results of theoretical study were reported here in and have been utilized to decipher the liquid crystalline behavior obtained experimentally for these molecules.
Experimental and Theoretical Methods
Materials and Methods
All the chemical ingredients used to prepare the LC molecules under investigation were procured from Sigma Aldrich, USA and used as it is. Differential scanning calorimetry (Perkin-ElmerDSC-7) has been used for the transition temperature (TN) measurements. The molecular formula (i.e., abundance of H-atoms) of the prepared compounds was confirmed by 1H NMR (Bruker, 400 MHz) and IR (1C-Schimadzu FTIR). The nano assemblies of liquid crystals were investigated by transmission electron microscopy (TEM). The TEM image was obtained using Jeol JSM 6390 equipment.
Chemistry
The synthetic routes for many of the intermediates as well as the targeted compounds are explained as indicated in sheme1
Preparation of Ethyl-4-N-Alkoxybenzoates
To a solution of ethyl-4-hydroxybenzoate ethyl and the appropriate 1-chloro-n-alkane was added drop-wise while stirring until obtaining the ester(1) 5.
Preparation of 4-N-Alkoxybenzoic Acids
The ester obtained Ethyl-4-n-alkoxybenzoates (1) was directly hydrolyzed by adding potassium hydroxide and heating for two hours. The cold solution is added with stirring to cold dilute hydrochloric acid. After recrystallization, the resulting acid (2) is TLC pure 28.
Preparation of 4-N-Alkoxybenzoyl Chloride
n-alkoxybenzoic acids(2)( 0.01 mol )and thionylchloride (0.01 mol) are placed in dry a 250 ml flask then reflux till obtaining the product 4-n-alkoxybenzoyl chloride(3), details of the procedure can be found elsewhere 28.
Preparation of 4-Hydroxyphenyl-4’-N-Alkoxy Benzoate
Approximately (0.01 mol ) of 4-n-alkoxybenzoyl chloride (3) was added to(0.01 mol ) of hydroquinone in(50 ml) of dry benzene with drops of triethyl amine. The reaction mixture was stirred with reflux for 6 h. The crystalline product (4) was separated by filtration; vacuum dried and recrystallized using a proper solvent. The prepared compounds have been characterized using infrared spectral measurements for the function group identification such as the carbonyl group that have been well observed around 1730 cm-1.
Preparation of Diester
4-(4-Chlorobenzoyloxy)Phenyl 4-(Octyloxy)Benzoate(C8)
One molar equivalent of the 4-substituted benzoyl chloride in dry pyridine was added drop-wise with stirring to a solution of 4-hydroxyphenyl-4’-octyloxy benzoate (0.01mol) in dry benzene with drops of pyridine .The products, after being crystallized twice from acetic acid, were TLC pure. The prepared compound have been characterized using infrared and 1HNMR. The characteristics of the obtained compound are given below: δH(400 MHz; DMSO)0.87(3H,t),1.32(-CH2,m),1.759(2H, quintet),4.10(2H,t), 7.1(2H,t), 7.39(4H,t), 7.70(2H,d), 8.15(4H,m); IR (KBr)/cm-1: 3110, 3067, 2968, 2926, 2884, 2854, 1731,1604, 1509,1289,1187,1086,and1010,756.
The experimental procedure for the preparation of compound 4-(4-chlorobenzoyloxy)phenyl 4-(tetradecyloxy)benzoate (C14) and compound 4-(4-chlorobenzoyloxy)phenyl 4-(hexadecyloxy)benzoate (C16) was as described for the preparation of compound 4-(4-chlorobenzoyloxy)phenyl 4-(octyloxy)benzoate (C8) except that the 4-hydroxyphenyl-4’-tetradecyloxy benzoate and 4-hydroxyphenyl-4’-hexadecyloxy benzoate were used respectively instead of the corresponding 4-hydroxyphenyl-4’-octyloxy benzoate .
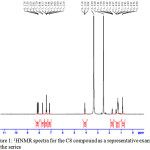 |
Figure 1: 1HNMR spectra for the C8 compound as a representative example for the series Click here to View figure |
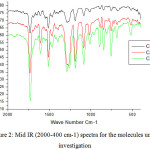 |
Figure 2: Mid IR (2000-400 cm-1) spectra for the molecules under investigation |
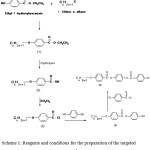 |
Scheme 1: Reagents and conditions for the preparation of the targeted compounds. |
Theoretical Calculation
Quantum Chemical calculations were performed in the gas phase using Density Functional Theory (DFT) implemented in the GAUSSIAN (09) program 29 in addition to the MOPAC 2016 semiempirical package 30 . We employed the B3LYP (Becke three-parameter Lee–Yang–Parr) exchange correlation functional 31,32 with 6-31G(d) basis sets using the Gaussian 09 program and the PM7 Hamiltonian using the MOPAC2016 software. Time dependent Density functional theory (TDDFT) calculation at the B3LYP/6-31G(d) level of theory will be used to predict the absorption spectra for the titled compounds. All calculations were conducted in the gas phase.
Results and Discussion
The first set of the compounds under investigation (Fig. 1) including the chloro derivative and the alkyl group of length 8, 14 and 16 carbon atoms were prepared and subjected to some experimental measurements concerning the IR (Fig. 2) as well as the transition temperature (TN ) from the nematic to the isotropic phase.
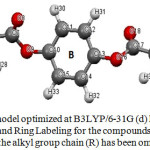 |
Figure 3: geometry model optimized at B3LYP/6-31G (d) level showing the atomic Numbering and Ring Labeling for the compounds under investigation, where the alkyl group chain (R) has been omitted for clarity Click here to View figure |
In addition to that, this set of molecules were subjected to a theoretical treatment using the DFT level of calculations as mentioned previously and the following results were obtained as follows:
Ground State Geometries and Shape of the Molecules
Many factors influence the actual liquid crystal phase exhibited. It is usually believed that the molecule geometrical shape mainly determines the observed phase. However, other properties such as intermolecular repulsions, attractive interactions and hydrogen bonds may play an important role. The optimized parameters (bond lengths and bond angles) for compounds C8, C14 and C16 under investigation were obtained by using B3LYP/6-31G (d) level of calculation. The results are depicted in Tables 1. It was found that the structural parameters of the molecules is not affected by the alkyl chain length, where by increasing the chain length there is no change in these parameters. The increase of the chain length of these compounds leads to a change in the dihedral angle (Table1) of the three rings A, B, and C (Fig. 3). This change in the dihedral angle obviously will affect the molecular interactions in the liquid crystalline state. It is worthy to note that, by changing the number of the carbon atoms in the alkyl chain, the zigzag structure of the alkyl chain length in all the liquid crystalline homologous compounds show no change and the angles are not affected. Thus, the discussion was centered on the ring dihedrals with the different chain lengths. The inspection of these data (Table1) reveals that these compounds shows a non planar conformation which is more underlined on both sides of benzene ring number B (Fig.3), the values of these dihedral angles are shown in Table 1.
Two dihedral angles will be considered for the inspection of the effect of changing the alkyl chain length on the molecular geometry. The first angle Φ (7-9-10-11) shows a consistent decrease from -50.3 to -48.0 on going from compound C8 to compound C14 to compound C16. On the other hand, the second dihedral angles θ shows increase in its value by increasing the alky chain length from C8 to C14 then decrease from C14 to C16 again ( Table 1).
Table 1: Selected optimized geometric parameters for the mesogen molecules calculated using the B3LYP/6-31G(d) level of calculation.
| parameter |
C8 |
C14 |
C16 |
| Bond length | |||
| R(1-38) |
1.357 |
1.358 |
1.358 |
| R(4-7) |
1.479 |
1.479 |
1.479 |
| R(7-8) |
1.212 |
1.212 |
1.212 |
| R(7-9) |
1.377 |
1.377 |
1.377 |
| R(9-10) |
1.392 |
1.392 |
1.392 |
| R(13-16) |
1.397 |
1.397 |
1.398 |
| R(16-17) |
1.369 |
1.368 |
1.369 |
| R(17-18) |
1.210 |
1.211 |
1.210 |
| R(17-19) |
1.488 |
1.488 |
1.488 |
| R(24-25) |
1.755 |
1.755 |
1.755 |
| Hydrogen Bond | |||
| HB1(8-30) |
2.577 |
2.545 |
2.537 |
| HB2(18-31) |
2.605 |
2.618 |
2.611 |
| Angles | |||
| A(1-38-39) |
119.1 |
120.4 |
120.4 |
| A(4-7-8) |
125.2 |
125.2 |
125.2 |
| A(4-7-9) |
111.4 |
111.3 |
111.3 |
| A(8-7-9) |
123.4 |
123.5 |
123.5 |
| A(7-9-10) |
120.6 |
120.0 |
121.0 |
| A(13-16-17) |
120.6 |
121.0 |
120.5 |
| A(9-10-11) |
122.7 |
123.1 |
123.0 |
| A(9-10-15) |
116.3 |
116.0 |
116.0 |
| A(16-17-18) |
124.2 |
124.2 |
124.1 |
| A(16-17-19) |
111.3 |
111.2 |
111.3 |
| A(18-17-19) |
124.6 |
124.5 |
124.6 |
| A(17-19-20) |
117.6 |
117.6 |
117.5 |
| A(17-19-21) |
122.8 |
122.9 |
122.9 |
| Dihedral angle | |||
| Φ(7-9-10-11) |
-50.3 |
-48.9 |
-48.0 |
| θ(12-13-16-17) |
-51.4 |
-52.1 |
-51.8 |
The intramolecular hydrogen bonding between the HB1(H30-O8) and HB2(H31-O18) values (Table 1) were also affected by the change in the alkyl chain length. The bond length for the HB1 shows a consistent decrease by increasing the alkyl chain length, where as the HB2 bond lengths show an increase then a decrease from C8 to C16 (Table 1). This could be attributed to the change in the dihedral angle that affects the degree of out of plane angles of the rings in the mesogenic part, which affects the hydrogen bond length (Table 1).
The TEM images of the liquid crystal homologous are shown in Fig. 4. TEM image shows a crystal size ranging from 20nm to 47nm. To ascertain the crystalline nature of these liquid crystals, their selected area diffraction pattern (SAED) were also recorded (Fig. 4). The diffraction patterns of the compounds under investigation show diffraction fringes for the Liquid crystal C8 were as for the C14 and C16 did not show any diffraction fringes, clearly ruling out their crystalline nature.
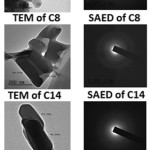 |
Figure 4: The TEM and SAED images for the liquid crystal molecules under investigation
|
Ovality Index, (O), defined by
O= (A/4π)/(3V/4π)2/3
A: area of the molecule
V: volume of the molecule
This property (ovality index) is an indicator of how close is the molecule geometry to a sphere, a cylinder or a disk. If O=1.0 it is a perfect sphere, if O>1.0 it is a cylinder and if O<1.0 it is closer to a disk. The data obtained from the PM7 semiemperical calculation was used to compute the molecular volume employed in the ovality formula. The values of the ovality index for the three compounds under investigation are depicted in Table 2. The order of increasing the ovality index is following the order C8< C14 < C16 and are all larger than 1. This indicates that these molecules tend to be cylindrical in shape (Fig. 4).
Frontier Molecular Orbital Analysis
Molecular orbital and their properties, like energy, are very useful for physicists and chemists and their frontier electron density used for predicting the most reactive position in π -electron systems and also explained several types of reaction in conjugated system. Our results indicate that the energy differences between the lowest unoccupied molecular orbit (LUMO) and the highest occupied molecular orbit (HOMO) are predominantly not affected too much by the alkyl chain length. Because the energetically favored electron promotion is from the HOMO to LUMO, the resulted absorption will be located at about 270 nm. Thus, the absorption of 270 nm light renders these substances as colorless compounds. The energy gap of HOMO–LUMO (Table 2), in the compounds under investigation explains the eventual charge transfer interaction within these molecules. Fig. 4 shows the electron density plots for frontier molecular orbitals of the molecules under investigation.
The molecular orbitals especially the HOMO and the LUMO are of important factors in obtaining the information concerning the electron conductivity of the molecules 33 . As inferred from Table 2 , the HOMO and LUMO energies did not change significantly upon the change in the alkyl chain length. Hence, the energy gap for the three molecules gives almost equal values indicating nearly similar electrical conductivity. The electron density plots of the HOMO and LUMO (Fig.5) explain the above mentioned discussion as it shows that the electron density for both orbital are not localized on the alkyl chain so it is not affected by its length.
Excitation binding energy (Eb) is a very important parameter that governs the generation of the charge in organic materials used in electronics 34.
Eb = Eg – Evert.
Where Eb is the excitation binding energy, Eg is the band gap and Evert is the vertical transition energy. The values of Eb are depicted in Table 2. As inferred from Table 2, one can observe that the values of the excitation binding energies for the three liquid crystal molecules show close values. This can be attributed to the insignificant discrepancies between the obtained electronic energy levels for the molecules under investigation when changing the alkyl chain length, which in turn makes the Eb value insignificantly changed (Table 2) 34 .
Table 2: quantum chemical parameters for the different compounds as obtained from B3LYP/6-31G (d) method and PM7 semi empirical method in the gas phase.
|
Comp. |
EHOMO (ev) |
ELUMO (ev) |
Dipole moment |
N |
QC |
QA |
TN (exp.) |
Ovality index* |
Eb |
|
C8 |
-6.22610 |
-1.62428 |
4.8944 |
8 |
-0.343 |
0.393 |
66.3 |
1.594 |
0.47 |
|
C14 |
-6.19073 |
-1.62292 |
5.0744 |
14 |
-0.347 |
0.342 |
52.8 |
1.694 |
0.45 |
|
C16 |
-6.18882 |
-1.62401 |
5.0641 |
16 |
-0.347 |
0.341 |
32.8 |
1.730 |
0.45 |
*Results obtained from the PM7 semiempirical method.
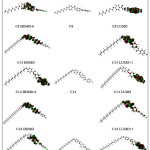 |
Figure 5: Isodensity plots (isodensity contour = 0.02 a.u.) of the frontier orbitals of the C8, C14 and C16 liquid crystal molecules calculated by B3LYP /6-31G(d) level of calculation
|
Atomic Charges
One of the important factors that determine the mesophase stability is the electrostatic interactions managed by the partial atomic charges of the mesophase molecule. Mullikan population analysis has been obtained for the atoms constituting the molecules under investigation. Each molecule has been divided into three parts, the first is the alkyl chain part and the second is the core part, which is the rest of the molecule except the chlorine atom, which is the third part.
The total charge on the alkyl chain part (QA) and the core (QC) part are depicted in Table 2. The charge on the chlorine atom for all the molecules under investigation was found to be 0.008. By careful inspection of Table 2, one can conclude that QC for all molecules possess a total negative charge , while the QA for all molecules have positive charge value. This will give an account for the phase stability of these molecules due to the strong interaction between them as well as with the chlorine atom. It is also worthy to mention that, the largest difference between the QA and QC is found in the C8 molecule. This accounts for the higher TN value compared to the C14 and C16 molecule (Table 2).
Ultraviolet (UV) Absorption Spectra
The UV light affects the LC molecules in a way that can reach to gradual degradation of these molecules and hence affects their properties. From this point, the UV absorption spectra should be estimated and analyzed in order to give important information that could be critical in the industrial application of these molecules 35 .
In a recent study on the newly prepared 1,4 phenylene dibenzoate moiety36, three absorption bands were observed at 342nm, 285nm and 280nm . The molecules under investigation, which are derivatives of these moiety exhibit also three bands as obtained from the TDDFT calculation at the B3LYP/6-31G(d) level of theory (Fig. 6). The UV spectral data are depicted in Table 3.
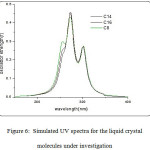 |
Figure 6: Simulated UV spectra for the liquid crystal molecules under investigation
|
The C8 molecule (Fig.6) shows three prominent bands in the range from 255 nm to 300 nm in the UV region. The band (λ1) at 255 nm is assigned as π- π* transition for the aromatic rings and possessing an oscillator strength value of 0.098. The second band ( λ2) appears at 272nm with a higher oscillator strength of 0.361 and it is the strongest band in the spectra and can be assigned as π- π* transition for the carbonyl group in addition to a band predicted to be at 300 nm (λ3) which is assigned as the n- π* transition of the carbonyl group. The contribution of the molecular orbitals to the different UV spectral observed for this molecule are depicted in Table 3.
Table 3: The UV – Vis absorption band, Electron transition, oscillator strength (f), vertical excitation energies ( Ev) for the C8 , C14 and C16 liquid crystal molecules as obtained from the TD-DFT calculation.
|
Molecule |
Absorption bands |
Electron transition |
Oscillator strength (f) |
Main transition configuration |
|
C8 |
300 |
S0→S1 |
0.2347 |
H→L(68%) |
|
|
272 |
S0→S3 |
0.3610 |
H→L+1(73%) |
|
|
255 |
S0→S5 |
0.0983 |
H-6→L+1(37%) |
|
C14 |
301 |
S0→S1 |
0.2286 |
H→L(66%) |
|
|
272 |
S0→S3 |
0.3990 |
H→L+1(71%) |
|
|
255 |
S0→S5 |
0.1111 |
H-6→L+1(35%) |
|
C16 |
301 |
S0→S1 |
0.2307 |
H→L(66%) |
|
|
272 |
S0→S3 |
0.3970 |
H→L+1(72%) |
|
|
255 |
S0→S5 |
0.1041 |
H-6→L+1(35%) |
The TDDFT predicted absorption spectra for compounds C14 and C16 are shown in Fig.6. The simulated spectra for both compounds show three bands which is in the same place as for compound C8. The oscillator strength and main configuration transitions are depicted in Table 3. The surface plots for these compounds ( Fig.6) gives an indication that the change in the alkyl chain length has no effect on the electronic structure of these molecules as the molecular orbitals contributing to these bands show electron densities mainly on the core part with no contribution of the alkyl chain part.
The S0→S1transition in all three molecules corresponds mainly to H→L orbitals with 68%, 66% and 66% for the C8, C14 and C16 respectively. The oscillator strength value corresponds to this transition in the C8 molecule shows the highest value of 0.2347 among the three molecules (Table 3). This gives an indication that this molecule has the highest flexibility for the electronic transition. All of the molecules under investigation possess same photo stability in the UV region.
Quantitative Structure Property Relationship
Correlation coefficient matrix has been obtained between the different molecular descriptors and the transition temperature, and the results are shown in Table 4. The dipole moment is another important parameter of these compounds and plays an important role in the stabilization of these mesomorphic states. As the chain length increase, the value of the dipole moment for the liquid crystal homologous compounds under investigation found to be changed. The value of the dipole moment was found to be affected by the change of the dihedral angles (Φ and θ). Table 4 shows the correlation coefficients for the dipole moment with these dihedral angles showing that the angle Φ(7-9-10-11) is highly positive correlated to the dipole moment which means as this angle increase the value of the dipole moment increase. On the other hand, the dihedral angle θ(12-13-16-17) shows a high negative correlation with the dipole moment which means inverse correlation to each other. The results show the high dependence of the dipole moment value on the dihedral angles. It is worthy to mention that, as the dihedral angle decrease the value of the dipole moment increase this could be attributed to the increase in the conjugation in the mesogenic part.
As inferred from Table 4, the transition temperature (TN) has good +ve correlation coefficients with HB1, QC andQA. This means that as these parameters increase the transition temperature increase. Whereas, the transition temperature has good -ve correlation coefficients with EHOMO, Dipole moment, the number of carbon atoms (N) , the dihedral angles (Φ) and the ovality index (O) .This means that as these parameters increase the transition temperature decrease. The Ovality index (O) was found to be the highest correlated parameter with R= -0.972 (Table 4) among the studied parameters which shows the importance of this parameter in the prediction of the transition temperature (TN) of these molecules and similar ones.
Table 4: Inter correlation matrix between different molecular descriptors and the transition temperature.
| Variables | EHOMO | ELUMO | D | N | QC | QA | TN | Ovality | HB1 | HB2 | φ | ϴ |
| EHOMO | 1 | |||||||||||
| ELUMO | 0.62 | 1 | ||||||||||
| D | 0.995 | 0.692 | 1 | |||||||||
| N | 0.981 | 0.454 | 0.957 | 1 | ||||||||
| QC | -0.999 | -0.655 | -0.999 | -0.971 | 1 | |||||||
| QA | -1 | -0.642 | -0.998 | -0.975 | 1 | 1 | ||||||
| TN | -0.831 | -0.078 | -0.774 | -0.924 | 0.805 | 0.815 | 1 | |||||
| Ovality | 0.977 | 0.44 | 0.953 | 1 | -0.967 | -0.971 | -0.93 | 1 | ||||
| HB1 | -0.99 | -0.5 | -0.971 | -0.999 | 0.982 | 0.985 | 0.903 | -0.998 | 1 | |||
| HB2 | 0.818 | 0.959 | 0.869 | 0.689 | -0.843 | -0.834 | -0.359 | 0.678 | -0.726 | 1 | ||
| Φ | 0.938 | 0.31 | 0.901 | 0.988 | -0.922 | -0.928 | -0.972 | 0.99 | -0.978 | 0.568 | 1 | |
| ϴ | -0.884 | -0.915 | -0.925 | -0.775 | 0.904 | 0.897 | 0.474 | -0.765 | 0.807 | -0.992 | -0.667 | 1 |
Conclusion
In this work, electronic structure properties for homologous 4(4-(4-chlorobenzoyloxy)phenyl 4 (n-alkoxy)benzoate(n =8,14,16) series have been calculated using quantum chemical methods. Relationships between these properties and experimentally measured parameters related to the liquid crystal behavior were established and used to account for the photo stability of these molecules. In the molecules studied here, the ovality was found to be an important factor that could be used to investigate the effect of structure on the transition temperature.
Acknowledgement
The authors would like to thank the institute of scientific research and Revival of Islamic Heritage at Umm Al-Qura University, project ID (43405048) for the financial support.
References
- Chandrasekhar, S.; Liquid crystals, Cambridge Univ. Press, Cambridge, 1992.
CrossRef - De-Gennes P.G.; Prost J.; The physics of liquid crystals, Clarendon Press, Oxford, 1993.
- Zhang Z.; Guo H.; J. Chem. Phys., 2010, 133, 1–12.
- Catanescu O.; Chien L.C.; Liq. Cryst., 2006, 33, 115–120.
CrossRef - Mohammady S. Z.; Nessim R. I.; Shehab O. R. ; Naoum M. M., Liq. Cryst., 2005, 32(4), 477–482 .
CrossRef - Lakshmi Praveen P.; Ojha D. P., Rom. Journ. Phys., 2012, 57, 645–656.
- Naoum M. M.; Mohammady S. Z. ; Ahmed H.A., Liq. Cryst., 2010, 37 (10) , 1245-1257.
CrossRef - Nagappa J.; Mahadeva R.; Yalemaggad Somashekar C.V.; Umesh G.; Manjunatha K.B., Mol. Cryst. Liq. Cryst., 2011, 540, 88–93.
CrossRef - March N.H., Theor. Comput. Chem. 1996, 3 , 619-647.
CrossRef - Lakshmi S.; Sridhar M.A.; Shashidhara Prasad J., Mol. Cryst. Liq. Cryst. ,2002, 381 ,59-68.
CrossRef - Tokita K.; Fuzimura K.; Konodo S., Takeda M., Mol. Cryst. Liq. Cryst. Lett., 1981,64 ,171-176.
CrossRef - Berges J.; Perrin H., Mol. Cryst. Liq. Cryst., 1984,113, 269-275.
CrossRef - Castro M.E.; Percino M.J.; Chapela V.M.; Moro G.S.; Ceron M.; Melendez F.J., J. Mol. Model., 2013,19 , 2015–2026.
CrossRef - Mishra M.; Dwivedi M.K.; Shukla R.; Tiwari S.N., Prog. Cryst. Growth Charact. Mater., 2006,52 , 114-124.
CrossRef - Tiwari S.N.; Prog. Cryst. Growth Charact. Mater. ,2006, 52, 150-158.
CrossRef - Klintenberg M.; Thomas J.O.; Phys. Rev. B, 1997,56 ,13006–13011 .
CrossRef - Praveen P.L.; Ojha D.P., Mol. Cryst. Liq. Cryst.,2011,537 , 64-75.
CrossRef - Adams C.J.; Clark S.J.; Ackland G.J., Crain J., Phys. Rev. ,1997, 55 (5), 5641–5649.
- Bates M.A.; Luckhurst G.R., Chem. Phys. Lett. , 1997, 281 , 193-198.
CrossRef - Smondyrev A.M.; Phcovtis R.A., Liq. Cryst. , 1999, 26 , 235-240.
CrossRef - Luckhurst G.R.; Romono S., Liq. Cryst., 1999, 26 , 871-884.
CrossRef - Sarman S., Mol. Phys., 2000, 98, 27-35.
CrossRef - Bharadwaj R.K.; Bunning T.J.; Farmer B.L., Liq. Cryst. ,2000, 27, 591-603.
CrossRef - Neese F.A., J. Chem. Phys., 2003, 119 , 9428–9443.
CrossRef - Dwivedi M.K.; Tiwari S.N., J. Mol. Liq., 2011, 158, 208-211.
CrossRef - Roychoudhury M.; Srivastava R.K., Int. J. Quantum Chem. , 2011, 111 , 4113-4123.
CrossRef - Chaturvedi S.; Chaturvedi N.; Dwivedi M.K.; Tiwari S.N., Indian J. Phys., 2013, 87 ,263-269.
CrossRef - Dave J.S.; Vora R. A. “Liquid crystal and ordered fluids”, eds. Johnson J.F. and Porter. R. S. Plenum press, New York, 1970, P.477.
- Gaussian 09, Revision D.01, Gaussian, Inc., Wallingford CT, 2009.
- Stewart J.J.P., J. Comp. Chem., 1989, 109 , 209-220.
CrossRef - Becke A.D., J. Chem. Phys., 1993, 98, 5648-5652.
CrossRef - Lee C.; Yang W.; Parr R.G., Phys. Rev. B, 1988, 37,785-789.
CrossRef - G Li; R shu ; Y Yang. polymer solar cells , Nature photonics, 2012, 6(3) , 153-161.
CrossRef - Oliveira E.F. ; Lavarda F.C., Mater. Res., 2014,17(6), 1369-1374.
CrossRef - luder E., liquid crystal displays: Addressing schemes and Electro-optical Effects, John Wiley&Sons, Uk, 2010.
- Ganaie J. A. ; Kumar J. ; Butcher R. J. ; Jasinski J. P.; Gupta S.K., J. Chem. Crystallogr., 2016, 46 ,93-104.
CrossRef

This work is licensed under a Creative Commons Attribution 4.0 International License.


