The Effect of Silver Nanoparticles on Selenium Speciation Analysis in Water Sample by Flow Injection-Hydride Generation Atomic Absorption Spectrometry
Ruttiya Poonyaka and Saksit Chanthai
Department of Chemistry and Center of Excellence for Innovation in Chemistry, Faculty of Science, Khon Kaen University, Khon Kaen 40002, Thailand.
Corresponding Author E-mail: sakcha2@kku.ac.th
DOI : http://dx.doi.org/10.13005/ojc/330315
This study described selenium speciation analysis under catalytic activation and/or reduction using silver nanoparticles (AgNPs) in conjunction with common flow injection (FI) -hydride generation atomic absorption spectrometry (HGAAS). Generally, Se(IV) could be directly determined by HGAAS consisting of 0.25% (w/v) NaBH4 in 0.1% (w/v) NaOH as a reductant and 2 M HCl as carrier solution, while Se(VI) could not be detected. In this regard, AgNPs in which was generated in the presence of 0.25% (w/v) NaBH4 was accordingly subjected in the same reducing background. Thus, the effects of the AgNPs on various factors affecting the Se analysis were investigated. From the results, it was demonstrated that the AgNPs gave insight into the catalytic activation for Se(IV) analysis, and also acted as pre-reducing agent for Se(VI) compared with 10% (w/v) thiourea/conc. HCl. So, the dispersed AgNPs in the HG system could serve for better sensitivity and selectivity for Se analysis. Furthermore, the conversion of Se(VI) to Se(IV) and its recovery study were validated using both of the pre-reducing agents. Both LOD and LOQ of the method were 0.5 and 1.0 µg L-1, respectively. The method precision (%RSD) was ranged of 5.69 and 3.23 for an intra-day and an inter-day analysis, respectively. Therefore, the method using AgNPs was successfully applied to determine trace amounts of Se species in drinking water samples and found in the ranges of 0.03-0.10, 0.12-1.0 and 0.22-0.97 µg mL-1 for Se(IV), Se(VI), and total Se, respectively.
KEYWORDS:Selenium; silver nanoparticles; hydride generation; atomic absorption spectrometry; catalytic activation; reducing agent; drinking water
Download this article as:| Copy the following to cite this article: Poonyaka R, Chanthai S. The Effect of Silver Nanoparticles on Selenium Speciation Analysis in Water Sample by Flow Injection-Hydride Generation Atomic Absorption Spectrometry. Orient J Chem 2017;33(3). |
| Copy the following to cite this URL: Poonyaka R, Chanthai S. The Effect of Silver Nanoparticles on Selenium Speciation Analysis in Water Sample by Flow Injection-Hydride Generation Atomic Absorption Spectrometry. Orient J Chem 2017;33(3). Available from: http://www.orientjchem.org/?p=33041 |
Introduction
Selenium is essential element playing an important role in an anti-oxidation. It can also cooperate with other antioxidants in processes protecting the cells from free radicals. In such manner, it can protect a body from development of cancer, cardiovascular diseases and masculine sterility1–3. It participates in thyroid hormone metabolism and immune system and it inhibits virulence and slows down AIDS development. Furthermore, it can reduce the risk of spontaneous abortions4. The balanced selenium content in human food helps connecting with diabetes and also affects the prevention of asthma, and can moderate harmful effects of radiation by free radicals inhibition5. Se deficiency is connected with acceleration of senility and development of Alzheimer´s disease. It also affects in a positive manner human mind and mental wellness6.
However, Se contents in foods and drinks are highly variable, depending on its location. Differences in toxicity occur among their various species because they follow different metabolic pathways7. Although precise feeding comparisons of the relative toxicity or nutritive activity of different Se compounds have not yet been made, it is known that selenite is more toxic than selenate8. Thus, study of the Se species in water or other sample provides better requirements of this element in the living system.
Total amounts of Se have almost reported. Few methods have been applied for selective determination of Se species in various matrixes. Chromatography coupled with various detectors has been used for separation and determination of all Se species. Few electrochemical methods can also be applied for Se speciation in biological fluids and environmental samples9–12. Either complete mineralization or conversion of Se(VI) to Se(IV) makes sample preparation more complex and increases risk of sample contamination and/or loss of Se. Spectrofluorometry has also been used for determination of Se species9,11. Organoselenium like methyl selenide can be detected by GC associated with various detection systems13,14. The most common way for Se speciation is based on hydride generation (HG) with AAS11. Se(IV) is determined directly under HG process, whereas Se(VI) is determined by difference after reduction15. Their severe and systematic imprecision are almost due to the use of improper sample decomposition9,16. According to total content of Se determination, the combination of FI technique with HGAAS is widely accepted17–22. The FI-HGAAS was used for the determination of Se(IV) and Se(VI) via on-line pre-reduction of Se(VI)23. The method was successfully applied to the speciation analysis of both Se species.
Since only Se(IV) forms its hydride compound, Se(VI) must be completely pre-reduced to Se(IV), if the total Se is determined. When NaBH4 is used as a common reducing agent for the determination of Se by HGAAS, only SeH2 is formed. Pre-reducing agent is normally achieved using HCl. The reduction time takes almost a week24. If its reduction step works at elevated temperature, it is faster25,26. The reaction time usually varies from 20-45 min25,27. However, too long heating can lead to the appearance of elemental Se24,28. The pre-reduction can also be done using co-reducing agents27,29-31.
Speciation is the identification and quantitative determination of different forms or phases in which a given element occurs in a given substance. In water sample, the form or phase of a given element is clearly defined32–34. The significant determination is not only the total content of the element but its speciation follows from different toxicological effects of different species in the ecosystem. For example, the inorganic Se is a few hundred times more toxic than its methylated forms. The speciation analysis of Se using HGAAS is based on its catalytic activation and/or reduction of hydride generation. Nevertheless, few analytical methods for the selective determination of Se species include ICP-MS, FI-HGAAS, or even coupled with some chromatographic techniques. However, ICP-MS approaches interference among dominant isotope35. The chromatographic ones rather give any decomposition of species and peak overlapping problems36. Hydride generation is a chemical derivatization technique in which some elements of the periodic table mentioned above form their volatile hydrides as indicated in the following reactions37 when they react with borohydride as a strong reducing agent and hydrochloric acid as carrier solution. In this technique, elements are separated from other accompanying materials in the gaseous hydrides and are introduced to the sample cell for atomization leaving the sample matrix in the liquid waste. Thus, spectral and chemical interferences can be eliminated. Therefore, the significant increase in sensitivity, by 10-100 folds, over commonly used liquid sample introduction techniques has been reported38–40.
Thus, this study was aimed for an ultra-trace determination of inorganic Se species present in drinking water samples in order to get either higher sensitivity and/or better selectivity using the dispersed AgNPs in the presence of mild reducing condition. The method development was conducted under their catalytic activation and/or reduction of the as-prepared AgNPs solution in conjunction with common performance of FI-HGAAS.
Materials and Methods
Chemicals
Se(IV) (1000 mg L–1), As(III) (1000 mg L–1), and Cu(II) (1000 mg L–1) as stock solutions, chromium nitrate, ferric nitrate, nickel chloride hexahydrate, sodium hydroxide, tin chloride pentahydrate and zinc nitrate were obtained from Carlo Erba (France). Hydrochloric acid (37%, w/v) was from Lab Scan Asia (Thailand). Se(VI) and silicon dioxide (each 1000 mg L–1) also as stock solution were bought from Sigma Aldrich (USA). Sodium borohydride was from Lab Chem (France). Thiourea was from BDH (England). All aqueous solutions were prepared with deionized water (Milli Q Millipore 18.2 MΩ cm–1) by Simplicity Water Purification system (Model Simplicity 185, Millipore Corporation, USA).
All glassware was cleaned by soaking in dilute 1% (v/v) HNO3 overnight and rinsed twice with deionized water prior to use.
Instrument
Selenium measurement was made using an atomic absorption spectrometer of the Perkin-Elmer AAnalyst 100 (Connecticut, USA) equipped with a flow injection analysis system (FIAS-100, Perkin Elmer Instruments, USA). Argon gas was used as carrier gas for the transposition of Se hydride from the gas-liquid separator to the heated quartz tube atomizer lined with Se hollow cathode lamp (Victoria, Australia). The peristaltic pump, injection time and data acquisition were controlled through Perkin Elmer AA Winlab atomic absorption software version 3.2.
Water Sample
Three brands of drinking water samples (S01, S02 and S03) were obtained from a convenient store, Khon Kaen University Foods and Service Center, Khon Kaen, Thailand. The water samples (0.6 L bottled) were instantaneously used without sample pretreatment.
Operational Conditions for Se Analysis by FI–HGAAS
Preparation of 100 µg L–1Se(IV) or Se(VI) as working solution was made by three steps dilution from 1000 mg L–1 Se(IV) or Se(VI) stock solution. The step dilution from 10 mg L–1 to 100 µg L–1 Se(IV) was freshly prepared prior to use. Each calibration curve of 5, 10, 15, 20 and 25 µg L–1for Se(IV) and Se(VI) was separately done in 0.1 M HCl by a series dilution to mark 25-mL volumetric flask from their working solutions. For Se(VI) analysis, the pre-reducing agent (thiourea/conc. HCl or AgNPs) was appropriately added and then diluted to 25 mL with 0.1 M HCl.
For hydride generation, a common reducing agent was chosen using 0.25% (w/v) NaBH4 which was prepared by dissolving 2.5 g NaBH4 in 1.0 L of 0.1% (w/v) NaOH. This solution was freshly prepared prior to use. A 2.0 M HCl solution was used as a carrier solution. And 0.1 M HCl was used as a blank solution. The operational conditions for Se analysis using FI-HGAAS were controlled through program AA WinLab as shown in Table 1.
Table 1: The operational conditions for Se determination by FI–HGAAS
| Parameter | |
| Spectrometer | |
| Wavelength | 196.0 nm |
| Slit width | 2.0 nm |
| Measurement mode | Absorbance |
| Energy | 25 |
| Current of hollow cathode lamp | 16 mA |
| Hydride generation | |
| Carrier | 2.0 M HCl |
| Reducing agent | 0.25% (w/v) NaBH4 in 0.1% (w/v) NaOH |
| Quartz cell temperature | 900 °C |
| Sample loop volume | 500 µL |
| Fill time | 10 s |
|
Inject time |
15 s |
|
Argon gas flow rate |
50-55 mL/min |
Effect of Analytical Matrix on Se Determination
Although the suitable reducing agents can be applied for Se analysis in real samples, the matrix effect at ultra-trace level of selenium species still appears from the reducing agents used. Thus, the effect of analytical matrices on the absorbance of Se by adding each of the optimal pre-reducing agents into the standard solutions of both Se(IV) and the pre-reduced Se(VI) used as calibration curves, compared with the usual calibration curve of Se(IV) as a control were investigated under the same optimum conditions of the HGAAS. The results obtained from each of their calibration curves of both Se species either with or without the corresponding pre-reducing agents can be compared expressed as relative conversion of the two oxidation state of Se.
Concerning the pre-reduction of Se(VI), thiourea was commonly a choice of use. The concentration of thiourea in conc. HCl was optimized in the range of 5-20% (w/v). The main factors affecting on the pre-reduction were carried out using 5-25 µg L–1 Se(VI) concentration range. By using 20 µg L–1 Se(VI), the effect of the two pre-reducing agents was comparatively studied. The effect of NaBH4concentration was varied from 0.25 to 5.0% (w/v). The effect of AgNPs concentration was also investigated between 50 and 500 ppm.
Analytical Features of Merit
The analytical characteristics of the proposed method for speciation analysis were investigated under the optimum conditions. The studied parameters were linearity, limit of detection (LOD), limit of quantitation (LOQ), precision and accuracy. Linearity was obtained from calibration plot. The calibration plots were studied by analysis of standard mixtures with various concentrations ranging from 0.5 to 100.0 µg L–1 of Se(IV). All the standard mixtures of Se (IV) and Se (VI) were prepared in the same manner. LOD and LOQ of the method were deduced based on the signal to noise ratio (S/N) of 3 and 10, respectively.
The precision of the proposed method was evaluated in terms of reproducibility and repeatability of the calibration slope. The repeatability (intra-day precision) was achieved by replicating measurements of the calibration slop within a day (n = 10). Whereas, the reproducibility (inter-day precision) was calculated from the experiments carried out in ten consecutive days (n = 10). The accuracy of the method was expressed in terms of recovery. The recovery was studied by spiking a known concentration of standard into samples before analysis in nine replicates. To test the recovery study of real sample in order to restrict other matrix effects of the plant materials, each of the suitable pre-reducing agents was chosen and applied by spiking each standard solution of Se(IV) and Se(VI) at 20 µg L–1, and both Se species at 20 µg L–1 into the drinking water sample S01as a model solution.
Real Sample Analysis
The Se(IV) content in drinking water sample (25 mL) was directly determined by FI-HGAAS. While the Se(VI)in this sample was completely pre-reduced to get Se(IV) by using 10% (w/v) thiourea/conc.HCl (2 mL) in comparison with 100 ppm AgNPs (1 mL) as catalytic activation and/or reduction prior to the measurement. At first, 2 mL of 10% (w/v) thiourea/conc. HCl was added into 25 mL of the water sample and made up the final volume of 50 mL with 0.1 M HCl prior to analysis by FI-HGAAS. Alternatively, this pre-reducing agent was also added into the water sample in the presence of 20 ng L–1 Se(IV) or in the presence of 20 ng L–1 Se(VI). For comparison, 1 mL of 100 mg L–1AgNPs solution was added into 25 mL of the water sample. Then, this AgNPs solution was also added into the water sample in the presence of 20 ng L–1 Se(IV) or in the presence of 20 ng L–1 Se(VI) prior to analysis.
Results and Discussion
Reducing Background of HG and Agnps Solution
In this study, it was aimed to find a novel point of views for method development of selenium analysis under catalytic activation and/or reduction of silver nanoparticles (AgNPs) using FI-HGAAS. In fact, Se(IV)in water sample could be directly determined by HGAAS. Practically, in this study the on-line HG of Se(IV) was done under mild reducing conditions consisting of 2 M HCl as a carrier solution and 0.25% (w/v) NaBH4 in 0.1% (w/v) NaOH as a common reducing agent. Thus, trace amount of dispersed AgNPs in the reducing background might take action roles on either as heterogeneous catalyst or as reducing agent for higher detection sensitivity.
Firstly, AgNPs at the concentration of 500 mg L-1 were obtained by an addition of silver nitrate solution dropwise into chilled solution of sodium borohydride. Two-fold molar excess of borohydride to Ag+ was used. The reaction solution turned yellow representing the characteristics of the spherical AgNPs. The concentration of NaBH4 had a significant effect on the absorbance of the particles. An increase in the absorbance of AgNPs with various NaBH4 concentrations was observed as shown in Figure 1. The absorbance of AgNPs increased considerably with an increasing the borohydride concentrations from 0.25 to 0.75% (w/v). However, the minimum concentration of 0.25% (w/v) NaBH4 was chosen for background reduction in further experiments. On the other hand, the amount of AgNO3 could also be affected on the production of AgNPs as well, if there was no complete reduction by the borohydride. Figure 2 shows the increase in the absorbance of AgNPs with an increasing of Ag+. The absorbance increased markedly with an increase in two concentration ranges; initial range between 0.005 and 0.01 g and the other one between 0.04 and 0.05 g. Thus, the minimum amount of 0.01 g AgNO3 was used, giving the maximum wavelength at 355 nm of the AgNPs solution.
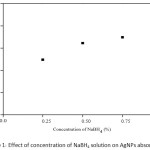 |
Figure 1: Effect of concentration of NaBH4 solution on AgNPs absorption
|
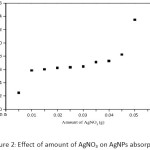 |
Figure 2: Effect of amount of AgNO3 on AgNPs absorption
|
Effect of the Agnps on the FI–HGAAS System
Effect of the Agnps on the Carrier Solution
Using 2 M HCl as a carrier solution in the FI-HGAAS, the addition of 100 ppm AgNPs solution with various volumes from 0.1 – 0.5 mL into the carrier solution resulted in the differences in their Se calibration curves ranging of 5-25 µg L–1. It was found that 0.3 mL of the AgNPs solution gave higher sensitivity (about 1.6 folds) as the observed slope of the regression line: y = 0.0146x + 0.0496 with R2 = 0.9914 compared with that of the control one: y = 0.0092x + 0.0225 with R2 = 0.9988 (Fig. 3).
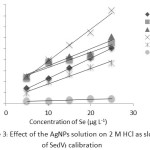 |
Figure 3: Effect of the AgNPs solution on 2 M HCl as slope of Se(IV) calibration
|
Effect of the Agnps on the Borohydride Concentration
Addition of 0.3 mL of AgNPs solution (100 ppm) into the NaBH4 solution with various concentrations of 0.1-0.75% (w/v) also affected the slope of the Se(IV) calibration curves. It was found that 0.25% (w/v) NaBH4 solution in the presence of AgNPs solution gave higher sensitivity (about 1.9 folds) as the observed slope of the linear regression line: y = 0.0163x + 0.0567 with R2 = 0.9967 compared with that of the control: y = 0.0085x + 0.0263 with R2 = 0.9908 as shown in Figure 4.
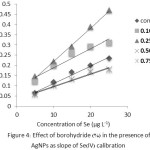 |
Figure 4: Effect of borohydride (%) in the presence of AgNPs as slope of Se(IV) calibration
|
Effect of the Agnps on Series Solution of Se(IV) Calibration
The addition of 100 ppm AgNPs solution with various volumes of 0.1-0.5 mL into the series standard solution of Se(IV) for construction of the calibration curve. It was found that 0.2 mL of the AgNPs gave higher sensitivity (about 1.7 folds) as y = 0.0163x + 0.0591 with R2 = 0.9996 compared with that of the control: y = 0.0098x + 0.0236 with R2 = 0.9933 as shown in Figure 5.
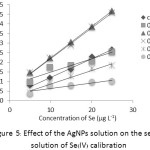 |
Figure 5: Effect of the AgNPs solution on the series solution of Se(IV) calibration |
Effect of the Agnps on the Pre–Reduction of Se(VI) Solution
The AgNPs (100 ppm) was generated in the presence of 0.5% (w/v) NaBH4 and then was added with various volumes of 0.5–3.0 mL into the Se(VI) solution. It was found that the use of 1.0 mL of the AgNPs solution gave the highest absorbance (Fig. 6).
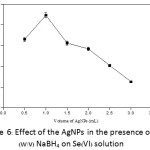 |
Figure 6: Effect of the AgNPs in the presence of 0.5% (w/v) NaBH4 on Se(VI) solution
|
Effect of thiourea concentration/conc. HCl for Se(VI) determination
The concentration of thiourea used as a common pre-reducing agent was investigated in the range of 5.0-20% (w/v) with fixed 2 mL of conc. HCl, and diluted to 25 mL with deionized water prior to analysis by FI-HGAAS. As shown in Figure 7, it was found that 10% (w/v) thiourea/conc. HCl gave the highest absorbance of Se(VI) among other conditions trialed in this experiment.
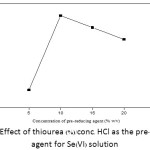 |
Figure 7: Effect of thiourea (%)/conc. HCl as the pre–reducing agent for Se(VI) solution
|
Selenium Speciation Analysis
Effects of Thiourea/Conc. Hcl and Agnps on Se Species
The calibration curves of Se(IV) standard solution in the presence of either 10% (w/v) thiourea/conc. HCl or the AgNPs solution (100 ppm, 1 mL) compared with that of Se(IV) standard solution in the absence of the pre-reducing agent as a control, were constructed with their linear equations as shown in Figure 8. Differences in sensitivity depicted as its slope of their calibration curves were rather clear in particular using AgNPs about 5 folds with respect to the control, indicating that there is no matrix effect for Se(IV) analysis. In addition, it was evident that the catalytic activation of the dispersed AgNPs on the calibration curve of Se(IV) was predominantly remark. While the sensitivity affected using 10% (w/v) thiourea/conc.HCl was much more pronounced.
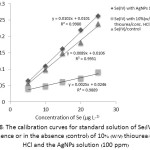 |
Figure 8: The calibration curves for standard solution of Se(IV) in the presence or in the absence (control) of 10% (w/v) thiourea/conc. HCl and the AgNPs solution (100 ppm)
|
In the same manner for Se(VI) standard solution with both of the pre-reducing agents, it was found the sensitivity of Se(VI) calibration curve (y = 0.008x + 0.012, R2 = 0.994) in the presence of 10% (w/v) thiourea/conc. HCl (Fig.9) was not so much different with that of Se(IV) solution (y = 0.002x + 0.024, R2 = 0.988) (Fig. 8). While Se(VI) solution (y = 0.010x + 0.010, R2 = 0.998) in the presence of the AgNPs gave higher sensitivity about 1.25 folds comparing with that of Se(IV) solution (y = 0.008x + 0.010, R2 =0.995) (Fig. 8), even it was nearly comparable to that (y = 0.008x + 0.012, R2 = 0.994) of using 10% (w/v) thiourea/conc. HCl (Fig. 9). It is, therefore, demonstrated that the AgNPs present distinct roles as plausible catalytic activation and pre-reduction potential instead of using only as the common pre-reducing agent. Actually, their slopes of the two pre-reduction systems of Se(VI) also gave not much difference in the matrix effect, if they were used as the standard working solution which could be tested for the efficiency of their reduction/conversion system. All of these pre-reducing agents can be used to completely convert Se(VI) to Se(IV) for the inorganic Se determination. Alternatively, the addition of the AgNPs into the Se(VI) solution led clearly to increase its sensitivity and selectivity for Se speciation analysis.
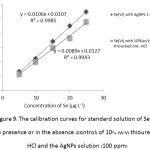 |
Figure 9: The calibration curves for standard solution of Se(VI) in the presence or in the absence (control) of 10% (w/v) thiourea/conc. HCl and the AgNPs solution (100 ppm)
|
Relative Conversion of Se Species and their Recovery Study
For comparing between the percentage conversion and their recovery study of Se(IV) and Se(VI) using the two pre-reducing systems, they were determined by their different calibration curves as shown in Table 2. The results indicated that the pre-reducing agents including 10% (w/v) thiourea/conc. HCl and the AgNPs solution show similar trends in both relative conversion and its recovery when using the same calibration curve. Therefore, both of the pre-reducing agents should be suitable to reduce Se(VI) to Se(IV). Then, two optimal pre-reducing agents were chosen. Both conversion (96.9-103.8%) and recovery (102.4-106.7%) are found in similar trends when using Se(IV) as control and Se(IV) in the presence of the pre-reducing agents as their calibration curves.
The satisfied trends in both conversion (104.8-115.2%) and its recovery (101.6-123.1%) were also found for Se(VI) as well. Consequently, both of them can be used as the calibration curve for the determination of inorganic Se species and total Se in water samples.
Table 2: Comparing between conversion (%)a and recovery (%)b using two kinds of the pre–reducing agents with respect to their calibration curves of both Se(IV) and Se(VI) in the presence of each of the pre–reducing agents used
| Calibration curve/Pre–reducing agent |
Se(IV)/reducing agent |
Se(VI)/reducing agent |
||||||||
| 10%(w/v) thiourea/conc. HCl |
AgNPs |
10%(w/v) thiourea/conc. HCl | AgNPs | |||||||
|
Conversion |
Recovery |
Conversion |
Recovery |
Conversion |
Recovery |
Conversion |
Recovery |
|||
| Se(IV)/controlc |
84.23 |
103.40 |
98.68 |
99.62 |
95.54 |
115.3 |
90.59 |
125.7 |
||
| Se(IV)/reducing agent |
98.56 |
105.9 |
96.93 |
106.7 |
112.2 |
108.5 |
115.2 |
123.1 |
||
| Se(VI)/reducing agent |
103.8 |
105.8 |
100.00 |
102.4 |
104.8 |
101.6 |
106.8 |
103.6 |
||
aConversion refers for conversion of the standard solution of Se(VI) to Se(IV).
bRecovery refers to the sample spiked with each of the standard solution of 10 µg L–1 Se(IV) or Se(VI).
cStandard solution of Se(IV) without the pre-reducing agent.
Analytical Performance Characteristics
The analytical performance of the FI-HGAAS system was evaluated under the optimum conditions including calibration curve, both LOD and LOQ, precision and accuracy (recovery) were investigated.
The calibration curve was constructed between 0.1 and 50.0 µg L–1Se(IV) standard solution, but the linearity was maintained up to 100.0 µg L–1 (y = 0.006x + 0.015) with a correlation coefficient (R2) greater than 0.9961. The LOD and LOQ calculated as three and ten times standard deviation of absorbance of 10 reagent blanks divided by the standard calibration slope of Se(IV) were found to be 0.5 µg L–1 and 1 µg L–1, respectively. This LOD was found less than those previously reported41,42.
Reproducibility (inter-day precision) and repeatability (intra-day precision) were investigated in terms of relative standard deviation (%RSD, n = 10) as shown in Table 3. The precision of the calibration curve of Se(VI) solution between 5 and 25 µg L–1 was in the acceptable ranges of RSD between 3.23% and 5.69% for an inter-day and an intra-day analysis, respectively. The results gave rather higher precision for each of the calibration curve for Se analysis.
Table 3: Both an inter-day and an intra-day precision of the proposed method
| Calibration |
Inter–day (n = 10) |
Intra–day (n = 10) |
||
|
Linear equation |
RSD (%) |
Linear equation |
RSD (%) |
|
|
1 |
y = 0.0092x – 0.0113 | 3.23 | y = 0.0092x + 0.0278 | 5.69 |
|
2 |
y = 0.0088x + 0.0355 | y = 0.0093x – 0.0198 | ||
|
3 |
y= 0.0091x + 0.0286 | y = 0.0105x + 0.0041 | ||
|
4 |
y = 0.0105x + 0.0045 | y = 0.0100x + 0.0077 | ||
|
5 |
y = 0.0090x + 0.0373 | y = 0.0089x + 0.0375 | ||
|
6 |
y = 0.0093x + 0.0272 | y = 0.0095x + 0.0232 | ||
|
7 |
y = 0.0105x + 0.0029 | y = 0.0092x + 0.0292 | ||
|
8 |
y = 0.0083x + 0.0309 | y = 0.0084x + 0.0303 | ||
|
9 |
y = 0.0090x + 0.0193 | y = 0.0089x + 0.0218 | ||
|
10 |
y = 0.0092x + 0.0292 | y = 0.0097x – 0.0209 | ||
The accuracy of the proposed method was certainly concerned in terms of recovery. The recovery study of Se(IV), Se(VI) and both Se species using the two pre-reducing agents was shown in Table 4. The average recoveries (%) of Se(IV), Se(VI) and total Se in the water sample (S01) using 10% (v/v) thiourea/conc. HCl were found to be 85.57, 103.2 and 84.85, respectively. The recoveries (%) of Se(IV), Se(VI) and total Se using 100 ppm AgNPs found in that water sample were also ranged of 83.48, 98.90 and 83.10, respectively. The recoveries of the Se species in three brands of drinking water samples (S01, S02 and S03) followed by the pre-reduction with 10% (v/v) thiourea/conc. HCl were shown in Figure 10. Their average recoveries (%) of Se(IV), Se(VI) and total Se in the drinking water samples were ranged between 92.0-98.9, 79.9-90.2 and 78.9-88.3, respectively. And from Figure 11, the average recoveries (%) followed by using the AgNPs of Se(IV), Se(VI) and total Se found in these water samples were also ranged in between 92.95.9, 87.9-90.5 and 83.6-88.5, respectively. This is demonstrated that using the AgNPs instead of any common pre-reducing agent for Se speciation can be an effective work done as well.
Table 4: Comparative study of recovery of Se(VI), Se(VI) and total Se in water sample (S01) using the pre-reduction agents after spiking their Se species
|
Recovery (%) ± SD (n = 3) |
|||
| Pre–reducing agent | Se(IV)a | Se(VI)a | Se(IV)/Se(VI)b |
| 10% (w/v) Thiourea/conc. HCl | 76.5 85.57 ± 7.53 | 103.2 ± 5.21 | 84.85 ± 6.32 |
| 100 ppm AgNPs solution | 83.48 ± 3.36 | 98.90 ± 3.56 | 83.10 ± 4.23 |
asample spiked with each of 10 µg L–1 Se(IV) or Se(VI)
bsample spiked with 20 µg L-1 of both Se species
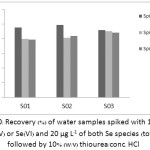 |
Figure 10: Recovery (%) of water samples spiked with 10 µg L–1 of Se(IV) or Se(VI) and 20 µg L–1 of both Se species (total Se) followed by 10% (w/v) thiourea/conc. HCl
|
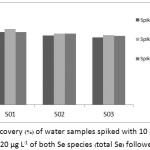 |
Figure 11: Recovery (%) of water samples spiked with 10 µg L–1 of Se(IV) or Se(VI) and 20 µg L–1 of both Se species (total Se) followed by AgNPs
|
Analysis of Real Samples
Generally, the residual organic matter could interfere the hydride generation. Table 5 shows the amounts of Se determination in three brands of drinking water (S01, S02 and S03). The concentration of Se(VI) was calculated as the difference between total Se and Se(IV). These samples gave at trace Se contents (µg mL–1) ranging from 0.03-0.10, 0.12-1.0 and 0.22-0.97for Se(IV), Se(VI), and total Se, respectively. Concerning the inorganic Se species in these water samples, the Se(VI) is found in higher contents than the Se(VI).
Table 5: The contents (µg mL–1) of Se(IV), Se(VI) and total Se in water samples
| Water sample | Se(IV) | Se(VI) | Total Se | ||||
| S01 | 0.086 | 0.996 | 0.973 | ||||
| S02 | 0.034 | 0.123 | 0.222 | ||||
| S03 | 0.099 | 0.242 | 0.215 | ||||
Effect of Some Interfering Ions
An interference of some diverse ions was also examined in triplicate. Several other ions were added at the concentrations of 1 mg L–1 or 10 mg L–1into 0.1 mg L–1of Se(IV) standard solution. Their percentage relative absorbance is shown in Table 6. While the effects of Zn(II), Cr(III) and Fe(II) were negligible, serious negative interferences were observed from Cu(II) and As(III). This negative interference probably occurred because Cu(II) reacted with the produced H2Se to form CuSe43,44. Fortunately, there was no interference from 0.1 mg L–1 Cu(II), and the contents of Cu(II) found in waste samples were about 0.001 mg L–1. Therefore, the effects of Cu(II) will be negligible for these drinking water samples as well. Testing of As(III) was also done and their As contents found in these water samples were less than 0.001 mg L–1, and the interference from As(III) at this level was neither negligible.
Table 6: The interference study of some diverse ions for Se species in the water sample
| Ion |
Recovery (%) |
||
|
Se(IV) |
Se(VI) |
||
|
10%(v/v) Thiourea/conc. HCl |
100 ppm AgNPs |
||
| Zn(II) |
103.5 |
103.8 |
105.2 |
| Cr(III) |
101.4 |
109.3 |
100.7 |
| Ni(II) |
102.5 |
102.2 |
98.30 |
| Sn(II) |
101.5 |
98.80 |
95.60 |
| Sb(III) |
102.1 |
99.60 |
97.50 |
| Si(II) |
105.8 |
101.5 |
101.8 |
| Cu(II) |
53.20 |
83.40 |
86.45 |
| As(III) |
86.90 |
91.54 |
96.99 |
| Fe(II) |
102.6 |
97.30 |
94.60 |
| Pb(II) |
95.00 |
99.00 |
96.20 |
Conclusion
In this study, the inorganic selenium speciation under catalytic activation and/or reduction using silver nanoparticles (AgNPs) in association with FI-HGAAS was developed for the first time. The AgNPs were freshly prepared by a dropwise addition of silver nitrate into chilled aqueous solution of two-fold molar excess of sodium borohydride, giving the pale yellow solution with an intense maximum absorption at 335 nm. By using AgNPs in the presence or the absence of borohydride, the results demonstrated that they acted not only as a catalytic activation for Se(IV) but also as a pre-reducing agent for Se(VI) analysis. Therefore, the dispersed AgNPs could enhance in both selectivity and sensitivity for ultra-trace determination of selenium in water samples.
Acknowledgements
The authors thank the Higher Education Research Promotion and National Research University Project of Thailand, Office of the Higher Education Commission, through the Food and Functional Food Research Cluster of Khon Kaen University, Materials Chemistry Research Center, Department of Chemistry and Center of Excellence for Innovation in Chemistry (PERCH-CIC), Thailand for financial support.
References
- Giovanelli, G.; Paradiso, A. J. Agric. Food Chem. 2002, 50, 7277–7281
CrossRef - Miteva, E.; Maneva, S.; Hristova, D.; Bojinova, P. J. Phytopathol. 2001, 149, 179–184
CrossRef - Foy, C.D.; Chaney, R.L.; White, M.C. Plant Physiol. 1978, 29, 511-566
CrossRef - Lombi, E.; Zhao, F.J.; Fuhrmann, M.; Ma, L. Q.; McGrath, S.P. New Phytolog. 2002, 156, 195-203
CrossRef - Onyegbule, A.F.; Okorie, D.E.; Onyegbule, C.E. Inter. J. Toxicol. Pharmacolog. Res. 2010, 2
- Underwood, E.I. Selenium, in: Trace Elements in Human and Animal Nutrition. New York: Academic Press, 1977
CrossRef - Petropoulou, M.O.; Michalke, B.; Kavouras, D.; Schramel, P. Anal. Chim. Acta. 2003, 478, 219–227
CrossRef - Alaejos, M.; Romero, C. Chem. Rev. 1995, 95, 227-257
CrossRef - Raptis, S.E.; Kaiser, G.; Tolg, G. Fresenius‘ Zeitschriftfür Anal. Chem. 1983, 316, 105-123
CrossRef - Mufioz, R.; Donard, O.; Camara, C.; Ouevauviller, P. Anal. Chim. Acta. 1994, 286, 357-370
CrossRef - Bryce, D.W.; Izquierdo, A.; Luque de Castro, M.D. Anal. Chim. Acta. 1995, 308, 96-101
CrossRef - Jiang, S.; Robberecht, H.; Adams, F.; Van der Berghe, D. Toxicol. Envir. Chem. 1983, 6, 191-201
CrossRef - Olsen, K.B.; Sklarew, D.S.; Evans, J.C. Spectrochim. Acta. 1985, 40, 357-365
CrossRef - Verlinden, M.; Deelstra, H.A.; Adrianensses, E. Talanta 1981, 28, 637-646
CrossRef - Welz, B.; Stauss, P. Spectrochim. Acta Part B. 1993, 48, 951-976
CrossRef - Chan, C.C. Anal. Chem. 1985, 57, 1482-1485
CrossRef - Fang, Z.; Xu, S.; Wang, X.; Zhang, S. Anal. Chim. Acta 1986, 179, 169-179
CrossRef - Ikeda, M. Anal. Chim. Acta. 1985, 170, 217-224
CrossRef - Pyen, G.S.; Browner, R.F. Appl. Spectro. 1988, 42, 508-512
CrossRef - Cobo, M.G.; Palacios, M.A.; Chmara, C. Anal. Chim. Acta. 1993, 283, 386-392
CrossRef - Pyrznska, K.; Siepak, J.; Kowalczuk, Z. Polish J. Envir. Stud. 1999, 8, 183-187
- Cobo, M.G.; Palacios, M.A.; Camara, C.; Reis, F. Anal. Chim. Acta. 1994, 286, 371-379
CrossRef - Pyrzynska, K. Anal. Chim. Acta. 1998, 363, 141-146
CrossRef - Brindle, I.D.; Lugowska,E. Spectrochim. Acta B. 1997, 52, 163-176
CrossRef - Dulivio, A. Anal. At. Spectro. 1989, 4, 67-70
CrossRef - Niedzielski, P.; Siepak, M.; Siepak, J.; Przybyalek, J. Polish J. Envir. Stud. 2002, 11, 219-224
- Godden, R. G.; Thomerson, D. R. Analyst. 1980, 105, 1137-1156
CrossRef - Nakahara, T. Progress in Analytical Atomic Spectroscopy. New York, Pergamon Press, 1983
- Dedina, J. Progress in Analytical Atomic Spectroscopy. New York, Pergamon Press 1988
- Rajan, K.; Roppolo, I.; Chiappone, A.; Bocchini, S.; Perrone, D.; Chiolerio, A. Nanotechnol. Sci. Appl. 2016, 9, 1-13
- Leelavathi, A.; Rao, T.U.B.; Pradeep, T. Nanoscale Res. Lett. 2011, 6, 123-132
CrossRef - Sharma, V.K.; Yngard, R.A.; Lin, Y. Adv. Colloid Interf. Sci. 2009, 145, 83-96
CrossRef - Thakur, M.; Pandey, S.; Mewada, A.; Shah, R.; Oza, G.; Sharon, M. Spectrochim. Acta Part A Mol. Biomol. Spectro. 2013, 109, 344-347.
CrossRef - Sohn, E.K.; Johari, S.A.; Kim, T.G.; Kim, E.; Lee, J.H.; Chung, Y.S.; Yu, I.J. Bio. Med. Res. Int. 2015, 89, 3049
- Goa, X.; Lu, Y.; He, S.; Li, X.; Chen, W. Anal. Chim. Acta. 2015, 879, 118-125
CrossRef - Zielinska, A.; Skwarek, E.; Zaleska, A.; Gazda, M.; Hupka, J. Procedia Chem. 2009, 1, 1560-1566
CrossRef - Ebdon, L.; Evans, E.; Fisher, H.; Hill, S.J. An introduction to analytical atomic spectrometry. Chichester, John Wiley & Sons 1998
- Shoog, D.A.; Holler, F.J.; Nieman, T.A. Principle of instrumental analysis. 5th ed. Philadelphia, Saunders College Publishing, 1998
- Dedinna, J.; Tsalev, D.L. Hydride gerneration atomic absorption spectrometry. Chichester, John Wiley & Sons, 1995
- Trung, D.Q.; Anh, C.X.; Yasaka, Y.; Fujita, M.; Tanaka, M. Anal. Sci. 2001, 17, 1219-1222
- Lobinski, R. Appl. Spectro. 1997, 51,260A-278A
CrossRef - Jackson, B.P.; Miller, W.P. Envir. Sci. Tech. 1999, 33, 270-275
CrossRef - Thompson, M.; Pahlavanpour, B.; Walton, S.J.; Kirkbright, G.F. Analyst. 1978, 103, 568–579
CrossRef - Tao, G.-H.; Sturgeon, R.E. Spectrochim. Acta B. 1999, 54, 481–48
CrossRef

This work is licensed under a Creative Commons Attribution 4.0 International License.
![]()
A New Edition of Web of Science
Journal Impact Factor
2022: 0.5
Five Year: 0.8
Journal is Indexed in

Cabells Whitelist
![]()


