Evaluation of A New Stability Indicating Method for the Determination of Aceclofenac and Thiocolchicoside in Pharmaceutical Dosage form by RP-HPLC.
Santhoshi G Rajamahanti1, Annapurna. N1, Santosh T2, Durga B1 and Raziya SK1
1Department. of Engineering chemistry, AUCE (A), Andhra University, Visakhapatnam, India-530003.
2Corpuscle Research solutions, Visakhapatnam, India-530017.
Corresponding Author E-mail: srisambhavi@gmail.com
DOI : http://dx.doi.org/10.13005/ojc/330334
A new RP- HPLC method was developed and validated for the estimation of aceclofenac and thiocolchicoside in their tablet dosage form. The chromatographic separation was carried out by using Agilent Zorbax column (150 × 4.6mm, 5µm). The mobile phase containing the combination of methanol and 0.1% ortho phosphoric acid of 75:25 (v/v) ratios. In this method the flow rate used is 1 min/ml for the separation at the detection wavelength of 275 nm. The proposed method was validated according to the ICH guidelines. The method was linear (R2 > 0.99), precise (RSD < 2.0%), accurate, simple, sensitive and robust. This method can be successfully used for the routine pharmaceutical analysis.
KEYWORDS:Thiocolchicoside; Aceclofenac; RP-HPLC; Method development; Validation
Download this article as:| Copy the following to cite this article: Rajamahanti S. G, Annapurna N, Santosh T, Durga B, Raziya S. K. Evaluation of A New Stability Indicating Method for the Determination of Aceclofenac and Thiocolchicoside in Pharmaceutical Dosage form by RP-HPLC. Orient J Chem 2017;33(3). |
| Copy the following to cite this URL: Rajamahanti S. G, Annapurna N, Santosh T, Durga B, Raziya S. K. Evaluation of A New Stability Indicating Method for the Determination of Aceclofenac and Thiocolchicoside in Pharmaceutical Dosage form by RP-HPLC. Orient J Chem 2017;33(3). Available from: http://www.orientjchem.org/?p=33106 |
Introduction
Aceclofenac1-4 is a non steroidal anti-inflammatory drug with good analgesic and anti-rheumatic properties5. Chemically it is [[[2-[(2, 6-Dichlorophenyl) amino] phenyl] acetyl] oxy] acetic acid. It is used in various pain conditions like rheumatoid arthritis, osteoarthritis and ankylosing spondylatis5, 6, 7, 8. It is official in British Pharmacopoeia8. It has analgesic properties and a good tolerability profile in a variety of painful conditions 9.
Thiocolchicoside is a semi-synthetic sulphur derivative of colchicoside, a naturally occurring glucoside present in the Colchicum autumnale and Gloriosa superb plants. Thiocolchicoside is used clinically for its muscle relaxant, anti-inflammatory, and analgesic properties10-14. Thiocolchicoside is (s)-N-[3-(B-D-glucopyranoxyloxy)-5, 6, 7, 9-tetrahydro-1, 2-dimethoxy-10-(methylthio)-9-oxobenzo[a]heptalen-7yl] acetamide. Thiocolchicoside is not official in any pharmacopoeia., it has a selective affinity for γ-amino butyric acid (GABA) receptors and acts on the muscular contracture by activating the GABA- enrich inhibitory pathways thereby acting as a potent muscle relaxant15-16.
Thiocolchicoside and aceclofenac is a recent combination available in the market for its synergetic effect in the treatment of different joint disorders16. Extensive literature reveals that thiocolchicoside can be assayed by UV spectrophotometric 17,18, HPLC19 and HPTLC20 methods individually or in combination with other drugs, and various methods reported for aceclofenac includes, Spectrophotometric and spectrofluorimetric21,22, in human plasma by narrow bore HPLC using column- switching23, HPLC24, HPLC stability indicating25, capillary electrophoresis26, high performance liquid chromatography and pharmacokinetics27, visible spectrophotometric28, LC-MS/MS29, physic-chemical and structural characterization30, isolation and structural elucidation 31.
Literature study showed only a few analytical methods for the simultaneous determination of thiocolchicoside and aceclofenac in separate and combined drug dosage forms. So, we tried an attempt to develop a simple, precise and accurate method for the determination of thiocolchicoside and aceclofenac in tablet dosage form by RP-HPLC.
The proposed method have considerable advantages over the existing methods, VIZ. spectrofluorimetric method, with respect to accuracy, selectivity, sensitivity, range of determination, speed and simplicity.
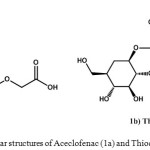 |
Figure 1: Molecular structures of Aceclofenac (1a) and Thiocolchicoside(1b) |
Materials and Method
Chemicals and Reagents
The standard samples of respective drugs aceclofenac and thiocolchicoside were given as a gift sample from Corpuscle Research Solution (Visakhapatnam, India), and the fixed dose combination of the drugs were taken from the local market. Acetonitrile (ACN), methonal and water of HPLC grade were supplied by E. Merck (Mumbai, India). Potassium dihydrogen orthophosphate (PDOP), HCl, NaOH and 0.1% H2O2 of analytical grade were obtained from Anglo French Remedies pvt .limited, India.
Equipment and Optimized Conditions
The Chromatographic separation was carried out on an LC-10 ATVP HPLC system. The module equipped with LC-10 ATVP Binary pump, SIL-10ADVP auto sampler, CTO-10Avp column temperature oven, SPD-10Avp UV-Visible detector. All the constituents were managed by using SCL-10Avp system controller. The acquired data was analyzed by using LC solutions software of 1.23 SP 1 version. The HPLC separation was performed on Agilent Zorbax column (150 × 4.6mm, 5 µm), at room temperature (25ºC ± 5). The mobile phase used for the analysis was prepared by combining 75 parts of Methanol and 25 parts of 0.1% Ortho phosphoric acid to obtain 75:25 v/v methanol: 0.1% OPA mixture. The runtime for the separation was fixed at 10minutes and the flow rate at 1.0 min/ml at the detection wavelength of 275 nm. The chromatograms obtained were recorded and the peaks are quantified by using an automatic integrator.
Preparation of Standard Solution
The bulk standard solutions of the drugs can be prepared by taking 85.6 mg of aceclofenac and 26.3 mg of thiocolchicoside into a separate 100 ml volumetric flask, added 75:25 v/v of mobile phase and milli Q water to prepare as a diluents solutions and allowed to sonicate for 10 minutes until the reference sample solution completely dissolves. The linearity curves consists 6 non-zero standards which were prepared by dissolving these drug stock solutions with diluents within the concentration ranging from 10.05 – 100.48 µg/ml for aceclofenac and 5.06 – 50.58 µg/ml for thiocolchicoside. The obtained mixture was sonicated for 5 min.
Preparation of Sample Solution
20 tablets of the respective drugs were taken and weighed accurately for their average weight. These tablets were crushed into a fine powder by using mortar and pestle. Certain amounts of these powdered drugs were weighed as 85.6 mg of aceclofenac and 26.3 mg of thiocolchicoside and transferred into a 100 ml volumetric flask separately. Now added 75:25 v/v of mobile phase mixture to these flasks, shacked well till the drugs were completely dissolves and sonicated for 30 minutes. These sample solutions were passed through a 0.45μm membrane filter to remove any excipients present in them. The quality control samples were prepared from these stock solutions of the drugs and the concentration levels were namely LQC (25.12 and 12.64 μg/ml), MQC (50.24 and 25.29 μg/mL), HQC (75.36 and 37.93 μg/mL) for aceclofenac and thiocolchicoside respectively. By these values the linear calibration curves were plotted.
Assay Procedure
20 tablets of each drug were weighed accurately and made into a fine powder by crushing with mortar and pestle. Now taken 85.6 mg of aceclofenac and 26.3 mg of thiocolchicoside into a 250 mL volumetric flask separately. Initially 100 ml of methanol was added to dissolve the drug content and make the flask filled with the mobile phase and then it is sonicated for 30 min, and allowed to pass through 0.45 µm PVDF filter to remove the impurities. 5 mL of solution from each flask was taken into a 100 mL of volumetric flasks and made up with the diluents. Now 20μL of these solutions taken for 8 times and injected to the HPLC system. Experiment was performed, observed the obtained peaks and percentages of recovery of the drugs were calculated from their regression equations of the respective linear curves.
Method Development
In order to get symmetric (stable) peaks and base line separation of the compounds we had conducted no. of trails by varying solvent selectivity, solvent strength, pH of the buffer, flow rate etc., to get ideal separation of the drugs under isocratic conditions. We tried with different columns like Hypersil- BDS- C18, Symmetry C18, Ymc-pack C18, Ymc-packpro; Spheris orb C18, Phenomenex C18 with different buffer salts such as ammonium formate, and ortho phosphoric acid, di- potassium hydrogen orthophosphate, in combination with acetonitrile, methanol and tetra hydro furan. Out of these, Agilent Zorbax column (150 × 4.6mm, 5 µm) we selected for the separation, the mobile phase of combination of 75:25 (v/v) mixture of freshly prepared methanol and 0.1% Ortho phosphoric acid was taken, proved to be more effective mixture than the other mixtures. Then, the flow rates tested were 0.4, 0.8, 1.0, 1.2 and 1.5 mL/min. Finally 1.0 mL/min was selected for the assay because of better resolution of the peaks. The fixed chromatographic conditions were the best to provide resolution and low tailing factor between aceclofenac and thiocolchicoside in a reasonable time of 3.32 and 1.73 min, respectively. The wavelength for detection fixed at 275 nm and no extra peaks interfering at the retention times of the drugs. A typical chromatogram obtained from a sample solution is shown in Figure 2.
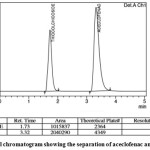 |
Figure 2: A typical chromatogram showing the separation of aceclofenac and thiocolchicoside Click here to View figure |
Method Validation
Validation of a method is the process by which a method is tested by the developer or user for reliability, accuracy and preciseness of its intended purpose32. The proposed method is validated as per ICH guidelines33.
Results and Discussion
Number of trails has been made for the best separation and assay of the drugs, we made an attempt by changing the mobile phase combinations, flow rate, strength of pH and columns. Out of these the mobile phase was selected as the combination of 75:25 (v/v) methanol and Ortho phosphoric acid mixture. Agilent Zorbax column (150 × 4.6mm, 5 µm) was selected for the separation. The tested flow rates are 0.5, 0.8, 1.0, 1.25, 1.5 min/mL and among them 1.0 min/mL were selected for the best resolution of the peaks. The proposed chromatographic conditions were shown better resolution between Aceclofenac, thiocolchicoside and the retention times obtained were 3.32 and 1.73 min respectively.
Specificity
Specificity is the ability to assess unequivocally the analyte in the presence of components that may be expected to present such as impurities, degradation products and matrix components. The specificity of the HPLC method can be obtained by comparing the chromatograms of the standard and sample solution with placebo components. There was no interference of any extra peaks observed with the drug peak. Therefore the method was specific.
Linearity of Detector Response
Linearity of an analytical method is to estimate test results that are directly proportional to the concentration of the analyte in a sample within the given range. . Linearity was performed by preparing mixed standard solutions of aceclofenac and thiocolchicoside at different concentration levels including working concentration within the range of 10.05-100.48μg/ml for aceclofenac and 5.06-5.58µg/mL for thiocolchicoside. These solutions were injected for three times to the system and then plotted the linearity curves of the respective drugs from the analyzed data. The linearity curves plotted were shown in Figures 3 and 4. The slope and intercept values for the calibration curves were y = 41081x – 16755 (R2 = 0.9994) for aceclofenac and y = 33295x + 60388 (R2 = 0.9972) for thiocolchicoside. These results showed an excellent correlation between peak area and concentration of drugs within their concentration ranges respectively as indicated above.
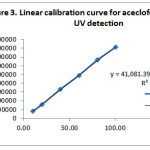 |
Figure 3: Linear calibration curve for aceclofenac using HPLC-UV detection Click here to View figure |
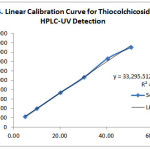 |
Figure 4: Linear Calibration Curve for Thiocolchicoside using HPLC-UV Detection Click here to View figure |
Precision and Accuracy
Precision of the method can be studied in terms of repeatability or reproducibility. It is expressed in terms of standard deviation or relative standard deviation of a series of measurements. Experiment was performed for the inter-day and intra-day variation studies and the values of % RSD were calculated.
Accuracy is the closeness of agreement between true value and measured value. Accuracy of the proposed method can be measured by preparing the samples solutions of known amounts of the pure drugs at different concentration levels and have been added to the pre analysed standard samples of the drugs from 50% up to 100%. Now inject these samples to the system and subjected to hplc analysis. % RSD for recovery of the respective sample are calculated. The results obtained were illustrated in table 1 and 2.
Table 1: The precision and accuracy results of aceclofenac by HPLC
| Sample ID | LQC | MQC | HQC |
| Nominal Concentration(µg/mL) | 12.57 | 25.16 | 37.73 |
| Day 1 | |||
| Mean Concentration (µg/mL) | 12.83 | 25.02 | 38.12 |
| SD | 0.35 | 0.23 | 0.2 |
| % CV | 2.71 | 0.94 | 0.53 |
| Day 2 | |||
| Mean Concentration (µg/mL) | 12.71 | 25.18 | 37.25 |
| SD | 0.1 | 0.18 | 0.26 |
| % CV | 0.8 | 0.71 | 0.7 |
| Day 3 | |||
| Mean Concentration (µg/mL) | 12.55 | 25.34 | 38.81 |
| SD | 0.18 | 0.26 | 0.31 |
| % CV | 1.43 | 1.03 | 0.8 |
Table 2: The precision and accuracy results of thiocolchicoside by HPLC
| Sample ID | LQC | MQC | HQC |
| Nominal Concentration(µg/mL) | 12.57 | 25.16 | 37.73 |
| Day 1 | |||
| Mean Concentration (µg/mL) | 12.83 | 25.02 | 38.12 |
| SD | 0.35 | 0.23 | 0.2 |
| % CV | 2.71 | 0.94 | 0.53 |
| Day 2 | |||
| Mean Concentration (µg/mL) | 12.71 | 25.18 | 37.25 |
| SD | 0.1 | 0.18 | 0.26 |
| % CV | 0.8 | 0.71 | 0.7 |
| Day 3 | |||
| Mean Concentration (µg/mL) | 12.55 | 25.34 | 38.81 |
| SD | 0.18 | 0.26 | 0.31 |
| % CV | 1.43 | 1.03 | 0.8 |
Limits of Detection and Limit of Quantitation
LOD is the lowest amount of analyte in a sample that can be detected under the given experimental conditions. LOD is determined based on signal to noise ratio (S/N) of three times typically for HPLC methods. LOQ is the lowest amount of analyte in a sample that can be quantitatively determined with acceptable accuracy and precision. LOQ is determined based on signal to noise ratio (S/N) of ten times typically for HPLC methods. LOD values of aceclofenac and thiocolchicoside were found to be 3.61µg/ml and 1.83 µg/ml respectively and the LOQ of aceclofenac and thiocolchicoside was found to be 3.54µg/ml and 1.81µg/ml respectively. The concern data was tabulated in tables 3 and 4.
Table 3: LOD and LOQ of aceclofenac
| SR NO | DRUG | SR NO | DRUG | ||
| Retention Time | Peak Area | Retention Time | Peak Area | ||
| 1 | 3.61 | 41345 | 1 | 3.57 | 83114 |
| 2 | 3.67 | 40694 | 2 | 3.54 | 81150 |
| 3 | 3.59 | 41509 | 3 | 3.52 | 77870 |
| MEAN | 3.62 | 41182.7 | MEAN | 3.54 | 80711.3 |
| ST DEV | 0.04 | 431.07 | ST DEV | 0.03 | 2649.38 |
| 313 | |||||
| % CV | 1.15 | 1.05 | % CV | 0.17 | 3.28 |
Table 4: LOD and LOQ of thiocolchicoside
| SR NO | DRUG | SR NO | DRUG | ||
| Retention Time | Peak Area | Retention Time | Peak Area | ||
| 1 | 1.83 | 25862 | 1 | 1.83 | 44562 |
| 3 | |||||
| 2 | 1.92 | 42784 | 2 | 1.81 | 53456 |
| 3 | 1.85 | 35618 | 3 | 1.79 | 50951 |
| MEAN | 1.87 | 34754.7 | MEAN | 1.81 | 49656.3 |
| ST DEV | 0.05 | 8493.97 | ST DEV | 0.02 | 4586.17 |
| % CV | 2.53 | 24.44 | % CV | 1.1 | 9.24 |
Stability
Stability sample solution of the proposed method can be obtained by keeping the drug sample solution aside for 12hrs. Now prepare fresh sample solution and conducted the experiment by injecting the stability and fresh samples to the hplc system for three times. Now compared the peaks obtained in between these two solutions. Further auto sampler stability extended to 24hrs and it was studied and established.
Robustness
Robustness of the proposed analytical method can be defined as the capacity or measure of the method that with stand by small variations in the method conditions. An experiment was performed to check the effect of deliberate variations in the optimized chromatographic conditions like composition of mobile phase, flow rate and PH of mobile phase variation in composition of mobile phase. From the results obtained, there were no significant changes observed at the end of the study. Since the proposed method can be called as robust. The respective results were shown in table5.
Table 5: Robustness studies of aceclofenac and thiocolchicoside
| Drugs | Parameters | Variation | Retention time (min) | Tailing factor | Theoretical plates |
| ACE | Flow rate | 0.9 mL/min | 3.76 | 1.63 | 4457 |
| 1.1 mL/min | 3.09 | 1.59 | 4358 | ||
| Mobile phase | 70% organic phase | 4.93 | 2.03 | 4707 | |
| 80 % organic phase | peak merged for aceclofenac | ||||
| THIO | Flow rate | 0.9 mL/min | 1.93 | 1.18 | 2496 |
| 1.1 mL/min | 1.59 | 1.14 | 2366 | ||
| Mobile phase | 70 % organic phase | 1.77 | 1.58 | 2647 | |
| 80 % organic phase | 1.77 | 1.38 | 1932 |
Stress Testing Studies
The degradation product (s) of each of the parent compound was found to be same for mild stress condition. Individual and binary mixture of aceclofenac and thiocolchicoside were subjected to forced degradation study. The stress studies involve acid, alkaline, photolytic (UV) and oxidation stress conditions.
Stress Degradation by Hydrolysis Under Acidic Conditions
Acid hydrolysis was conducted in 1M HCl at 60oc for 6hrs and it is repeated by decreasing the temperature slowly to room temperature by keeping other conditions constant. Inject the drug sample solution with acid to hplc system and studied the chromatograms obtained. figure no. 5 clearly indicates the spectral degradation of aceclofenac due to acidic instability
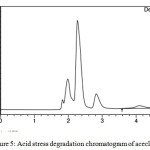 |
Figure 5: Acid stress degradation chromatogram of aceclofenac Click here to View figure |
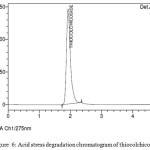 |
Figure 6: Acid stress degradation chromatogram of thiocolchicoside Click here to View figure |
Stress Degradation by Hydrolysis Under Alkaline Conditions
Prepare 1M NaOH solution and the experiment was conducted by injecting the drug sample solutions with alkaline solution at 60oc for 6hrs. and it is repeated by decreasing the temperature slowly to room temperature by keeping remaining all conditions constant. Experiment was performed and the data obtained was analyzed
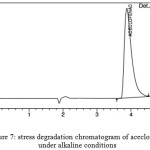 |
Figure 7: stress degradation chromatogram of aceclofenac under alkaline conditions |
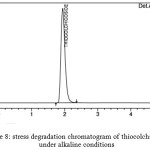 |
Figure 8: stress degradation chromatogram of thiocolchicoside under alkaline conditions
|
Oxidative Stress
It was performed in presence of 3%H2O2 with the drug substances for 6 days. The chromatograms obtained are given in fig 9 and 10.
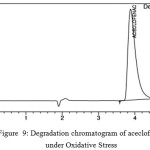 |
Figure 9: Degradation chromatogram of aceclofenac under Oxidative Stress
|
 |
Figure 10: Degradation chromatogram of thiocolchicoside under Oxidative Stress
|
Thermal Degradation
Aceclofenac and thiocolchicoside sample solutions was taken in a volumetric flask and kept in an oven maintained at 700C temperature for 24 hours. Then the sample solution was dissolved and diluted in mobile phase. From this appropriate dilution was made mobile phase and injected in chromatographic system.
Photolytic Degradation
Photolytic stress can performed by injecting drug sample solutions to the hplc system in presence of UV light, 1.2 million lux hrs of visible at 200W/h2 for 10days. The related chromatograms are shown in figures 11 and 12.
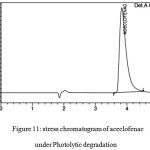 |
Figure 11: stress chromatogram of aceclofenac under Photolytic degradation Click here to View figure |
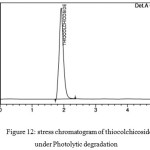 |
Figure 12: stress chromatogram of thiocolchicoside under Photolytic degradation Click here to View figure |
Conclusion
The developed RP-HPLC technique is precise, specific, accurate and fast. Statistical analysis proves that the method is selective for the analysis of Aceclofenac and thiocolchicoside in tablet dosage form without any interference from the excipients. Its advantages are use of less quantity of reagents, speed and simplicity of sample treatment than other methods.
Acknowledgement
The authors are thankful to Mr. Santosh Tata, Corpuscle Research Solutions, Visakhapatnam, India, for providing necessary facilities to carry out this research work.
References
- Zawilla, N. H.; Azim, M. A.; Kousy, N. M, J. Pharm. Biomed. Anal., 2002, 243–251.
CrossRef - Hye, S. L.; Chang, K. J.; Sung, J.; Sang, B.; Mi, H. L.; Geon, K. Dong, H., J. Pharm. Biomed. Anal 2000, 23, 775–781.
- Chul, S.Y.; Yu, K. O.; Kyung, H.L.;. Sang, M. P, Anal. Chimica Acta. 2007,585 , 103–109.CrossRef
- Brogden,RN.; Wiseman, LR.Aceclofenac: A review of its pharmacodynamic properties and therapeutic potential in the treatment of rheumatic disorders and in pain management. Drugs. 1996, 52(7), 113 – 124.
CrossRef - British National Formulary (BNF 41) British medical association: London. 2001,464.
- European Pharmacopoeia, 4th ed., Council of Europe, Strasbourg cedex: France. 2002 ,1281.
- British Pharmacopoeia,– I, Her Majesty’s Stationary office: London. 2002, 35 – 37.
- Kabeer ahmedshaikh,; ashish tanaji,; patiland audumber,; bhagawan. Indole,sensitive LC method of diacerein and aceclofenac in Tablet form,, International journal of industrial chemistry[IJIC],2012,3:3.
- Joel, GH.; Lee EL.; Goodman and Gilman’s – The Pharmacological Basis of Therapeutics. 10th ed. International edition, New York: Tata MC Graw Hill companies Inc, 2001,703, 704.
- Williams, DA.; Foye’s Principles of Medicinal Chemistry. 5th ed. Lippincott Williams and Wilkins; 2005. . 751-60.
- Shethi,PD.; High Performance Thin Layer Chromatography-Quantitative analysis of pharmaceutical formulations. 1sted. New Delhi: CBS Publishers, 1996. . 1-68.
- Shrivastava, M. High Performance Thin Layer Chromatography. New York: Springer Heidelberg Dordrecht, 2011. . 27-9
CrossRef - Pintu Bhagvanbhai, Prajapati,; Kunjan Bharatbhai, Bodiwala,; Bhavin Pankajbhai, Marolia,; Nilam Bhingaradiya and Shailesh Shah, Oxidative Degradation Kinetic Study of Thiocolchicoside using Stability Indicating High Performance Thin Layer Chromatographic Method, Pharmaceutical Methods, 2014 , 5, Issue 2.
- Carta, M.; Murru, L.; Botta, P; Talani, G.; Pietro Sechi, G. De Riu, P,; Sanna, E. ; Biggio, G. The muscle relaxant thiocolchicoside is an antagonist of GABAA receptor function in the central nervous system, Neuropharmacology. , 2006, 51805-815.
- Vishnu, P.; Choudhari, Anuruddha R.; Chabukswar,; Mangesh, U.; Tryambake,; Sachin, N.; Savakhande, spectrophotometric simultaneous determination of diclofenac potassium b.p. and thiocolchicoside in combined tablet dosage form by absorption corrected method and area under curve method,2011, 7, (2), Article-032.
- Suganthi, A.; and. Ravi, T.K. Development Of Validated Spectrofluorimetric Method For The Estimation Of Thiocolchicoside, International Journal of ChemTech Research CODEN( USA), 2012, 4, (.4), 1674-1680.
- Sasmita, K. A,; Priyambada, M,; Pnakini, P,; Mathrusri. A. Spectrophotometric methods for the determination of thiocolchicoside in bulk and pharmaceutical dosage forms. J Pharm Educ Res. 2010, 1(1), 51-57.
- Sutherland, F.C.W.; Smit, M.J.; Herbst, L.; Hundt, H.K.L.; Swart, K.J.; Hundt, A.F. Highly specific and sensitive liquid chromatography– tandem mass spectrometry method for the determination of 3- desmethylthiocolchicine in human plasma as analyte for the assessment of bioequivalence after oral administration of thiocolchicoside. Journal of Chromatography A, 2002,949, 71–77.
CrossRef - Ragehy, N.A.; Ellaithy, M.M.; Ghobashy ,M.A. Determination of thiocolchicoside in its binary mixtures (thiocolchicoside-/glafenine and thiocolchicoside-/floctafenine) by TLC_/ densitometry, Il Farmaco, 2003, 58.,463-468.
CrossRef - Santosh, Bhalerao,; Santosh, Tambe,; Vikas, Pareek,; Rupali, Shinde,; Lalit Kumar Gupta. A solid-liquid extraction and high performance thin layer chromatographic determination of diacerein and aceclofenac in pharmaceutical tablet dosage form, 2010,.3, 1.
- Kousy, NME. Spectrophotometric and spectrofluorimetric determination of etodolac and aceclofenac. J Pharma Biomed Anal 1999, 20:185-194.
CrossRef - Lee, HS,; Jeong, CK,; Choi,SJ,; Kim, SB,; Lee, MH,; Ko, GI,; Sohn, DH. Simultaneous determination of aceclofenac and diclofenac in human plasma by narrowbore HPLC using column- switching. J Pharma Biomed Anal 2000,23:775781.
CrossRef - Zawilla,NH,; Mohammad, MAZ,; Kousy, NME,; Aly, SME. Determination of aceclofenac in bulk and pharmaceutical formulations. J Pharma Biomed Ana,l 2002,27,243-251.
- Hasan, NY,; Elkawy, MA,; Elzeany, BE;, Wagieh, NE. Stability-indicating method for the determination of aceclofenac. IL Farmaco 2003, 58:91-99.
CrossRef - Zinellu, A,; Carru, C,; Sotgia, S,; Porqueddu, E,; Enrico, P,; Deiana, L. Separation of aceclofenac and diclofenac in human plasma by free zone capillary electrophoresis using N-methyl-D-glutamine as an effective electrolyte additive. Eur. J Pharma Sci, 2005, 24,375-380.
- Musmade, P,; Subramanian, G,; Srinivasan, KK. High performance liquid chromatography and pharmacokinetics of aceclofenac in rats. J Anal Chemica Acta 2007, 585,103-109.
CrossRef - Singhvi, I.; Goyal, A. Visible spectrophotometric estimation of aceclofenac and indapamide from tablets using folinciocalteu reagent. Ind J Pharma Sci, 2007, 69 (1),164-165.
CrossRef - Layek, B,; Kumar, TS.; Trivedi, RK.; Mullangi, R.; Srinivas, NR. Development and validation of a sensitive LC-MS/MS method with electro spray ionization for quantitation of rhein in human plasma: application to pharmacokinetic study. J Biomed Anal, 2008, 2(6): 616-624.
- Alberti, MB.; Bartolucci, G.; Bruni, B.; Coran, SA.; Vaira, MD. Physico-chemical and structural characterization of diacerhein. J Pharma Biomed Anal, 2009, 49,1065-1069.
CrossRef - Chaudhari, A.; Golak, M.; Deo, A.; Krishna, V.; Agrawal, H.; Peshawe, U.; Gawande, A.; Srinivas, S.; Mane, S.; Jadhav, D. Isolation and structural elucidation of two impurities from a diacerein bulk drug. J Pharma Biomed Anal, 2009,49,525-528.
CrossRef - Text on Validation of Analytical Procedures, International Conference on Harmonization, September 1993.
- ICH Q2 (R1), Validation of analytical procedure: Text and Methodology, November 2005.

This work is licensed under a Creative Commons Attribution 4.0 International License.
![]()
A New Edition of Web of Science
Journal Impact Factor
2022: 0.5
Five Year: 0.8
Journal is Indexed in

Cabells Whitelist
![]()


