Effect of Addition of Sewage on the Mobility of the Herbicide Fenoxayprop- Ethyl under Laboratory Conditions
Fadoua El- Makhoukhi1, 2, Abdelmalek Dahchour2, Fatiha Bentata3, Ilyass Maafa4 and Mohamed Alaoui El-Belguiti1
1Physical and Physical Chemistry of Materials and Nanomaterials: Environment, Depollution and Sustainable Development, Faculty of Sciences, Mohammed V University in Rabat, Ibn Batouta Avenue BP: 1014RP Rabat, Morocco.
2Department of Basic and Applied Sciences, Agronomic and Veterinary Institute Hassan II, BP: 6202 Rabat, Morocco.
3Laboratory of Phytopathology, National Institute of Agronomic Research. (INRA) B.P. 6356 Rabat-Instituts / Morocco,
4Laboratory of Botany, Mycology and Environment, Faculty of Sciences, Mohammed V University in Rabat, Ibn Batouta Avenue BP: 1014RP Rabat, Morocco.
Corresponding Author E-mail: fadoua10@gmail.com
DOI : http://dx.doi.org/10.13005/ojc/330347
The reuse of treated wastewater (TWW) is considered as one of the alternative solutions to limit the shortage and preserve the natural resource. The water potential in Morocco is estimated at 22 billion m3 per year, equivalent to 700 m3 / inhabitant / year. This quantity of water could fall to 500 m3 by 2030 under the pressure, in particular, of climate change and population growth. Irrigation with TWW has been shown to be beneficial in terms of stabilizing soil structure, enriching mineral nutrients for crops and increasing production. However, the use of TWW may coincide with the presence of pollutants such as pesticides and heavy metals in the soil. This situation can improve or reduce the transfer of pollutants to groundwater. Fenoxayprop ethyl (FPE) is an herbicide commonly used to control annual grasses and perennials in cereals. Published result on its behavior in the environment are controversial, varying from enhancement and reduction of its mobility. Mobility test of FPE was carried out in the Gharb region which is an important agricultural zone in Morocco known for its sandy and clayey soil. The mobility assessment was done by a bioassay based on the growth of barley seeds. This test was carried out in PVC columns 30 cm in length and 7.5 cm in diameter. Each column is composed of 6 sections of 5 cm height. 300 g of air-dried and sieved (2mm) soil was introduced into each column. Muslin tissue was attached to the bottom of the column to retain the soil. The herbicide was applied on the top of each column. Three columns were used for the test. One column was eluted with distilled water and used as a control. The other columns were irrigated with TWW at a flow rate of 1.5 ml / min. The residue of the herbicide was analyzed in the percolated water and sections of the columns. The results show a marked increase in soil conductivity and a slight decrease in pH. Residue analysis showed that the movement of the herbicide increased in the percolated column with the wastewater compared to the control and moved from section 1 to section 6 in the TWW leached column. This may be due to the leaching of the herbicide in adsorbed form by the organic matter of the waste water. No residues were detected in the percolated water from all treated columns and from the control.
KEYWORDS:bioassay; fenoxayprop-ethyl; herbicide; mobility; wastewater
Download this article as:| Copy the following to cite this article: El-Makhoukhi F, Dahchour A, Bentata F, Maafa I, El-Belguiti M. A. Effect of Addition of Sewage on the Mobility of the Herbicide Fenoxayprop- Ethyl under Laboratory Conditions. Orient J Chem 2017;33(3). |
| Copy the following to cite this URL: El-Makhoukhi F, Dahchour A, Bentata F, Maafa I, El-Belguiti M. A. Effect of Addition of Sewage on the Mobility of the Herbicide Fenoxayprop- Ethyl under Laboratory Conditions. Orient J Chem 2017;33(3). Available from: http://www.orientjchem.org/?p=32864 |
Introduction
FPE is widely used to control annual grasses and perennials in cereals. In Morocco, it is used to treat mainly wild oats, Phalaris and rays-grass in wheat crops [1, 2]. This herbicide is selective and acts by contact and in a systemic manner. It is mainly absorbed by the leaves and can move in an acropetal and basipetal movement towards roots or rhizomes.
Several studies have been published on the impact of wastewater on pesticide behavior and its positive effect attributed to its organic matter that improves soil aeration, infiltration, increases soil field capacity, improves
Buffer soil property and beneficial effect on soil microorganisms [3] .On another hand, interactions with pesticides are matter of controversial opinions among authors. This effect can lead to a reduction in adsorption [4, 5, 6, 7]. An increase in adsorption [8] and sometimes no effect [9, 10, 11], while the physicochemical properties of pesticides, including hydrophobicity, appear to play an important role [8].
Studies on the biodegradation of FPE, carried out by [12, 13, 14], showed low persistence of FPE in soil. It is localized at the level of the first centimeters of the soil layer, [15] given its very high value of koc of FPE which is of order of 11354.
In the soil, degradation of FPE is reported to be fast and mainly biotic induced and accompanied by the formation of Fenoxaprop-P and Benzoxazolone as major and transient metabolites [16]
The aim of this work was the study the effect of addition of TWW on the mobility of FPE. Residue of the herbicide were assessed by a preliminary adapted bioassay based on the growth of barley seeds.
Materials and Methods
Physical and Chemical Properties of Soil
Soil sampling was carried out at the Guich Oudaya site in Rabat, in between 0 – 20 cm horizon. The physicochemical properties were determined in the soil laboratory of INRA-Rabat. The soil sample was dried in the open air and sieved to 2 mm.
Waste Waters
The wastewater samples (WW) were taken from the SKHIRAT (STEP) wastewater treatment plant using automatic samplers. The sampling was carried out upstream of the basin for the TWW. The collected sample was stored and brought to the laboratory in a refrigerator at 4° C until use.
The Bioassay
Seeds of the Moroccan barley variety TISSA were chosen for the bioassay. The seeds were washed and allowed to germinate in a clean tray. Regular soaking allowed their germination favorably. The germinated seeds were used for the subsequent steps.
Lengths of germinated seeds were measured and the percentage of inhibition was calculated using the formula: I (%) = (A – B) / A * 100
Where A = the average length of the control;
B = the average length of the treated section.
Correlation between % Inhibition and concentration might be used as standard curve for the subsequent results.
The mean length was correlated to the concentration tested. To serve as standard curve.
Preliminary Test
The stock solution of FPE was used to prepare the desired concentrations in the soil. Seven concentrations were retained for the assay: 0 – 0.2 – 0.5 – 1 – 1.5 – 2 and 4 mg.l– 1.
Soil samples were placed in different pots. Field capacity was leveled to 21%. Each concentration was replicated twice. Five pregerminated seeds were place in each pot and incubated at (24± 2) °C and 12-hour diurnal period. Once the soil is well prepared, it was split on two small pots where 5 pregelated barley seeds were laid. The incubation was carried out in a culture chamber at a temperature set at 20°C.
The length measurements were carried out after 10 days of incubation.
Soil Columns
Column Preparations
The columns used were made of PVC, 30 cm long and 7.5 cm in diameter. Each column is composed of 6 sections 5 cm high. 300 g of screened soil were placed in each column and a muslin tissue was placed to retain it.
These columns are packed with soil (500 g dry weight) and labeled C1, C2 and C3.
Columns C1 and C2 were saturated with distilled water DW by suction for 24 h until saturation. These columns were drained overnight. A field capacity test was performed before starting our experiment. Column C3 is filled with non-saturated dry soil (0% water).
Columns C1 and C3 are percolated with treated wastewater TWW. C2 is percolated with distilled water. Each test was replicated twice.
Elution of Columns
To ensure a homogeneous distribution of water on the surface of the columns of soil and to avoid the creation of channels during percolation, filter papers were placed on the surface of each column.
12 ml of FPE were added to the top of each column at a concentration of 4 mg.l-1. 300 ml of distilled water or containing 2% of TW were percolated through the columns at a flow rate of 1.5 ml / min.
The percolation started immediately after application of the pesticide and lasted 5 hours; fractions of percolate were collected at regular intervals of one hour after percolation.
Each percolate was measured to determine the volume of water recovered and to measure pH and conductivity. The measurements were measured using a pH meter and a conductivity meter model WTW 3110 SET1.
To evaluate residue in percolated waters, pots packed with soil free of pesticide was moisten with percolated water at field capacity of 21%, planted with 5 pregerminated seeds and left for incubation for 10 day as previously described.
At the end of the experiment, the columns were disassembled to recover the different sections.
The soil from the different sections was place in pots and planted with germinated seed to evaluate residue of pesticides and placed in the incubator for 10 days.
Statistical Analysis
The statistical analysis was carried out using ANOVA. The data were analyzed using the analysis of variance and the comparison of means. The test was applied at a probability level of p = 0.05. These analysis were carried out in order to compare the average characteristics of the plant lengths of the three columns studied. This comparison was made, on the one hand, without distinction between the different sections and, on the other hand, separately for each section. In order to do this, the descriptive analysis of the different characteristics, which was carried out in this study, is as follows: mean, standard deviation and analysis of the variance.
Results and Discussion
Soil Analysis
Table 1: Granulometric and physicochemical properties of soil Guich Oudaya
|
physical-chemical composition |
Values |
|
|
P2O5 |
22.11 mg.l-1 |
|
|
K2O |
81 mg.l-1 |
|
|
pH eau |
7.64 |
|
|
CE |
0.446 mS/cm |
|
|
%MO |
0.255 |
|
|
%C |
0.148 |
|
|
%Ntot |
0.01275 |
|
|
C/N |
11.6 |
|
|
CEC |
0.04 cmol.kg-1 |
|
|
% CaCO3 |
< 0. /01 |
|
|
Particle size |
%A |
5 |
|
%L |
10 |
|
|
%S |
85 |
|
The soil is sandy (5% clay, 10% silt and 85% sand), with a very low cation exchange capacity of 0.04 cmol.kg-1 and a low organic matter content of 0.255%.
Low concentrations of P2O5 and exchangeable potassium K2O were recorded.
Bioassay
The bioassay indicates a decrease in the height of the tested plant as the herbicide concentration increases (Figure 1). This behavior reflects the sensitivity of the plant to the herbicide applied to the soil being tested.
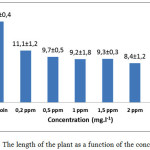 |
Figure 1: The length of the plant as a function of the concentration
|
The ANOVA showed a Pr> F index of <0.001, so it can be said that there is a very highly significant difference between the concentrations studied especially between the control and the concentration of 4 mg.l-1. There is an overlap between 0.2 mg.l-1 and 0.5 mg.l-1 and between 2 mg.l-1 and 4 mg.l-1, which means that these concentrations have possible mean values Compatible.
Evolution of Mobility
The mean values of the lengths of the stems measured after incubation are presented in Table 2
Table 2: The mean plant length values as a function of the sections
|
Average length of plant(cm) |
|||
| Sections | C1 | C2 | C3 |
| S1 (0-5 cm) | 8.1 ± 2.32 | 8.55 ±1.55 | 9.6 ± 1.77 |
| S2 (5-10 cm) | 12.43 ± 1.78 | 13.63 ± 0.7 | 11.22 ±2.42 |
| S3 (10- 15 cm) | 13 ± 1 | 13.21 ± 3.42 | 13.57 ± 3.12 |
| S4 (15-20 cm) | 12.66 ± 0.44 | 13.53 ±2.8 | 13.63 ± 3.09 |
| S5 (20-25 cm) | 11 ± 0.5 | 15.28 ± 3.97 | 15.35 ± 2.42 |
| S6 (25-30 cm) | 10.33 ± 0.77 | 18.01 ± 2.58 | 16.73 ± 3.12 |
The comparison of the means shows that the herbicide is present in all sections of the columns with a significant difference which lies between the column C1 and the two other columns C2 and C3.
In the columns C1 and C2 previously saturated with distilled water, the values of the lengths recorded in the sections S1 are very close. The calculation of the degree of inhibition gives a high value of 53%, which indicates a strong presence of the herbicide in this section.
In section S2, the degree of inhibition decreased slightly, showing a mobility of the herbicide above 5 cm for column C3.
In sections S3 and S4 the values of the degree of inhibition are approximated, which increases the herbicide progression in a regular manner under the effect of percolation.
At the level of section S5 of column C1, percolated with waste water, the degree of inhibition is stronger than that of C2 and C3. This can be attributed to the leaching of the herbicide in adsorbed form by the Organic matter of TWW. This phenomenon was reported for other pesticides by other authors [17, 18]
At section S6, the value of the degree of inhibition increased markedly in column C1. This reflects a high concentration of the pesticide at this level. This accumulation is not in agreement with the expected trend of decrease in inhibition potential of the herbicide. This can be attributed to a non-passive infiltration generated by the presence of preferential channels in this column 1. This kind of behavior is often reported for other pesticides [19, 20, 21, 22, 23].
The mobility in column C3 shows strong inhibition levels in sections S1 and S2 44% and 35% respectively. These values decreased from section S3 where we have recorded an inhibition level of 22%. This indicates the reduced mobility of the herbicide in this column. On another hand this column was percolated with distilled water which is free of OM. This prevent the herbicide to be transported at adsorbed for downward of the column.
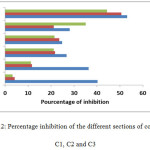 |
Figure 2: Percentage inhibition of the different sections of columns C1, C2 and C3
|
A statistical analysis of the ANOVA variance suggests that the herbicide was able to move up to the sixth section of column C1 eluted by the TWW and that its mobility remains low for columns C2 and C3.
These results were confirmed following a comparison of the different sections of the three columns. It is highly significant for column C2 and C3 and significant for column C1. The values of Pr> F = 0.0035, Pr> F = 0.0032 and Pr> F = 0.00387 respectively.
Comparison Between Similar Sections of the Different Columns
Analysis of the same section for the three columns revealed a significant difference in section 6 of column C1 (Pr> F = 0.0177). However, this difference did not reveal significant differences between the other sections (S1, S2, S3, S4, S5) of the columns used.
Elution of Columns
Table 3: Eluents recovered after each hour
| column | Duration of percolation | AverageLength (cm) | Standard error | |
|
C2 |
1 h | 17.00 | 0 | A |
| 2 h | 18.66 | 0.61 | A | |
| 3 h | 18.33 | 2.33 | A | |
| 4 h | 17.46 | 1.21 | A | |
| 5 h | 17.00 | 0.57 | A | |
| Total volume recovered (ml) |
292 |
|||
|
C1 |
1 h | 17.33 | 0.83 | A |
| 2 h | 17.33 | 0.91 | A | |
| 3 h | 17.43 | 0.06 | A | |
| 4 h | 17.13 | 0.94 | A | |
| 5 h | 14.93 | 0.97 | A | |
|
Total volume recovered (ml) |
268 |
|||
The statistical test of the recovered eluates after each hour of percolation showed that the value of Pr> F is well above the threshold of significance 0.05, so the null hypothesis is maintained (no significant difference between the samples). It can be concluded that the mean lengths of the two columns do not differ significantly, therefore no residue detected in the percolation water of the two columns C1 and C2, so the herbicide is always present in the column. For column C3, it had no recovered eluate.
The total volume difference recovered for column C1 is due to the clogging of our soil due to the accumulation of the organic matter of the TWW.
PH and Electrical Conductivity
The pH measurements are shown in Figure 3. The pH measured at each percolate varies from 7.64 to 8.51 for the eluates treated with TWW (column C1) and from 7.69 to 8.02 for the eluted distilled water (column C2).
Measurements of the electrical conductivity (CE) of the percolates of our sandy soil vary from 291 to 573 μs / cm for column C1 and from 329 to 583 μs / cm for column C2
It is found that the addition of wastewater has an effect on pH and conductivity. Measurements of these two parameters increase with percolate recovered after each hour. This can be explained by dissolving some of the dissolved organic matter and the ions contributed by the TWW.
For column C2 percolated with distilled water, the pH decreases slightly while EC increases. This result could be explained by the low buffering capacity of the soil due to its low CaCO3 content <0.001 (Table. 1)
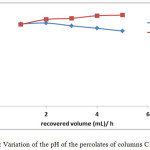 |
Figure 3: Variation of the pH of the percolates of columns C1 and C2
|
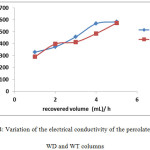 |
Figure 4: Variation of the electrical conductivity of the percolates of the WD and WT columns
|
Conclusion
The results of this study show that the addition of waste water to the percolation water contributed to a wide dispersion of the pesticide in the different sections of column C1 compared to column C2. This may be due to the interaction between the herbicide and the organic matter present in the wastewater. In the field, this may result in vertical mobility to the groundwater in vulnerable areas such as Gharb and Tadla. On the other hand, the relative mobility in depth can be considered as a positive element to ensure good control in the arable soil layers (0-30 cm).
In column C3 the mobility is reduced despite the preliminary non-saturation. This can be seen as a positive element in arid areas where the dry climate dries up soils and makes them susceptible to seepage by pollutants in general and pesticides in particular.
References
- Cocker, K.M; Moss, S.R.J.O.D,Pesticide Biochem. Physiol. 1999, 65, pp. 169–180.
CrossRef - Chen C. H, Hsieh T. F, Plant Pathology.2009, Bulletin 8: 119-123.
- Cox, L.;Cecchi, A., Celis, R.;Hermosin; M. C.;Koskinen; W. C.; and Cornejo, J. Soil Sci. Soc. Am. J. 2001, 65: 1688-1695
CrossRef - Graber, E.R.; G.C. Fischer; and U. Mingelgrin.Soil Sci. Soc. Am J.1995, 59:1513–1519.
CrossRef - Drori, Y. ;Aizenshtat, Z. ;Chefetz, B.SoilSci. Soc. Am J.2005, 69, 1703–1710.
CrossRef - Arienzo, M.; Christen, E.W.;Quayle, W.; Kumar, A.,J. Hazard.Mater. 2009, 164, 415–422.
CrossRef - Landry, D., Dousset, S., Andreux, F. Chemosphere. 2004, 54(6):735–742.
CrossRef - Rodríguez-Liébana, J.A.;Mingorance, M.D. ;Pena, ˜ A., J. Environ. Manage. 2011, 92, 650–654.
CrossRef - Pena, A., ; Palma, R. ;Mingorance, M.D. Colloid. Surface A.2011, 384, 507–512.
CrossRef - Hernández-Soriano, M.C.;Mingorance, M.D.; Pena, ˜ A. J. Environ. Manage. 2012, 95, S223–S227.
CrossRef - ElGouzi, S.;Mingorance, M.D.; Draoui, K.;Chtoun, E.H.; Pena, ˜ A. Chemosphere .2012,89, 334–339.
CrossRef - Stumpf K.; Dambach P. Aerobic soil metabolism.1988c (Hoe 046360 – chlorophenyl-14C). Report No CB051/87.
- Buettner B.; Schweighoefer U.; Kuenzler K. 1992a,Aerobic Soil Metabolism Study at 11 and 21°C (Hoe 046360 – chlorophenyl-14C). Report No CB91/017.
- Buerkle W.L.; Schuld G.; Grundschoettel P. 1986a, Aerobic Soil Metabolism Study (Hoe 033171 – dioxyphenyl-1-14C). Report No CB058/85.
- Le Gren. AE F046360.2003, Generated by: Document No: C029715 GLP / GEP.
- Singh, SB. J Environ Sci Health B. 2013;48(5):324-30. doi: 0.1080/03601234.2013.742363. PMID:23431970.
- El Imache, A.;Dahchour A.;Elamrani, B. ;Dousset, S. ;Pozzonni, F. And Guzzella, L. Journal of Environmental Science and Health Part B. 2009, 44, 1–7.
- El Azzouzi, M. Thèse d’État à l’université Mohammed V- Agdal, Rabat (Maroc).1999.
- Mechrafi, E. ; Dahchour, A.;Bouhaouss, A.Actes de l’Institut Agronomique et Vétérinaire Hassan II, Morocco. 2001, Vol 21 (4) 241-246.
- El M’rabet, M. ;Dahchour, A. ;Massoui, M. ; Sanchez-Martin, M.J.Fresinuis Environ. Bull. 9.2000, 582-589.
- El Imache, A.;Dousset, S.;Satrallah, A., Dahchour, A.Journal of Environmental Science and Health Part B.2012, 47(3):161-7.
CrossRef - Williams C.F, et al. Soil Sci. Soc. Am. J.64. 2000, 590-594.
CrossRef - Rudra R.P., et al. J. Environ. Sci. Health B. 2001. 36, 597-608.
CrossRef

This work is licensed under a Creative Commons Attribution 4.0 International License.
About The Author
![]()
A New Edition of Web of Science
Journal Impact Factor
2022: 0.5
Five Year: 0.8
Journal is Indexed in

Cabells Whitelist
![]()


