Determination of Formaldehyde Content in Wet Noodles by Thin Layer Chromatography-Densitometry After Derivatization with Nash Reagent
Faculty of Pharmacy, Universitas Indonesia, Depok, West Java, Indonesia, 16424.
Corresponding Author E-mail: hayun.ms@ui.ac.id
DOI : http://dx.doi.org/10.13005/ojc/330341
Download this article as:
![]()
Determination of formaldehyde content in wet noddles using thin layer chromatography (TLC) densitometric method after derivatization with Nash reagent has been developed. The calibration curve in the concentration range of 4 to 40 ng/spot showed good linier relationship (r = 0.999). The limit of detection and quantitation (LOD and LOQ) were 1.75 and 5.29 ng/spot, respectively. The method gave satisfactory selectivity, linierity, precision and accuracy validation criteria and was applied for determination of formaldehyde content in three wet noodles samples products purchased from traditional market in Depok City, West Java, Indonesia. Results of the determination showed that all samples were detected containing formaldehyde with the concentration of 990.94, 801.80 and 1684.36 mg formaldehyde per kg samples.
KEYWORDS:Formaldehyde; Wet noodles; Nash reagent; TLC-Densitometry
Introduction
Formaldehyde (HCHO), known by its systematic name methanal, is an important chemical for the global economy, widely used in construction, wood processing, glues and adhesives, textiles, and in the chemical industry1. When dissolved in water it is called formalin, which is commonly used as an industrial disinfectant, and as a preservative in funeral homes and medical labs. However, food manufacturers in some countries sometimes illegally use formaldehyde as a preservative in foods to extend its shelf-life3-8. Some studies of humans have suggested that exposure of the compound is associated with increased risks of leukemia, particularly myeloid leukemia1-2, therefore, all countries in the world prohibit the use of formaldehyde as a food preservative. Because of its toxicity, determination of formaldehyde content in food samples is a very important task.
Several analytical methods are available for determination of formaldehyde after derivatization, such as spectrophotometry, high performance liquid chromatography (HPLC) and gas chromatography (GC). Formaldehyde is derivatized with Nash3-4,9 or Fluoral P10-11 to form a yellow species in solution monitored at 412 nm, with chromotropic acid to produce a purple species in solution monitored at 580 nm12 and with dimedone (5,5-dimetil-1,3-sikloheksadione) to form formaldemedone monitored at 254 nm or as flourescent derivative having an excitation wavelength of 395 nm and an emission wavelength of 463 nm13. The spectrophotometric method is simple, rapid, economical, and highly sensitive, but the reagents are sensitive not only to formaldehyde, but also to other aldehydes and if chromophore compounds are present in the samples, they could interfere those spectrophotometric determination. Some substances with chromotropic acid can liberate aldehydes in an acid medium and give a false-positive test14. HPLC and GC methods have been used to enhance the selectivity of the formaldehyde determination methods7,8,15, but those methods are more costly. Alternative chromatographic method with lower operational cost is thin layer chromatography (TLC) densitometric method16, but only few reports on the determination of the compound in foods using this method17-19, and no report on the determination of the compound in wet noodles using the method after derivatization with Nash reagent.
Noodles are one of the most popular Indonesian foods. In West Java province for example, more than 200 tons of wet noodles are being sold every day20. Unfortunately, this food is often found to be added formaldehyde illegally, especially those sold in traditional markets21. The food are generally coloured yellow, so the colouring agent may interfere the determination of formaldehyde spectrofotometrically with Nash reagent. Hence, the aims of this study is to develop a new lower cost, simple, sensitive, selective, and reproducible formaldehyde determination method using TLC densitometry, which be able to provide a variety of options for researchers to conduct safety surveillance of wet noodles products.
Materials and Methods
Chemicals
Formaldehyde 35% solution, acetylacetone, acetic acid glaciale, ammonium acetate, methanol, distilled water, and wet noodles samples. All reagents and chemicals are analytical grade and were obtained from Merck Co. Ltd.. The wet noodles samples were purchased from traditional market in Depok City, West Java, Indonesia.
Preparation of Nash reagent
Acetylaceton 2 ml, acetic acid glaciale 3 ml and ammonium acetate 150 g were dissolved and diluted with distilled water into 1000 ml. The reagent was stored in a dark colored, airtight bottle at 0oC.
Stock solution and Standars
Stock solution of formaldehyde (1000 mg l-1) was prepared by diluting 35% formaldehyde solution with proper quantity of distilled water. Standard solutions of desired concentrations (1–20 mg l-1) were prepared by appropriate dilution of the stock solution.
Sample solution
Pulverized wet noodles sample was weigh accurately ± 0.2 g, added 5.0 ml distilled water, mixed and warmed over water bath (40±2oC) for 1 h, allowed to room temperature, added distilled water to the volume of 10.0 ml, mixed and centrifuged. The supernatant was used as as the sample solution.
Procedure and analytical conditions
TLC analysis was performed on aluminium TLC plates coated (10 cm x 10 cm) with silica gel 60 F254 with 250 µm thicknes (Merck, Darmstandt, Germany). Samples/standard solution 1.0 ml was added 1.0 ml Nash reagent, mixed and then warmed over water bath (40±2oC) for 30 min. After that, the solution was allowed to room temperature, extracted twice with 1.0 ml chloroform, and spotted the chloroform extract to the plate using Nanomat completed with 2 uL capilary tube (Camag, Swiszerland). The distance between each spot was 1 cm. The plates was developed to a distance of about 9 cm using a mixture of chloroform-methanol (1:4 v/v) as mobile phase in a twin-through glass chamber which had been pre-saturated with mobile phase vapours. After drying, the spots was scanned at 412 nm with Camag® TLC Scanner III in reflectance–absorbance mode and operated by CATS software. The slit dimensions were 8 mm × 0.4 mm and the scanning speed was 10mm s-1.
Method Validation
Validation of the analytical method was performed according to ICH Q2 guidelines (2005)22, including specificity, linearity, limit of detection (LOD), limit of quantitation (LOQ), precision and accuracy:
Specificity
The TLC densitometric chromatogram of blank sample, formaldehyde standard and sample addition were compared. The method meets the specific criteria when the chromatogram peak of the formaldehyde spot from sample addition was not interferenced by other components of the sample.
Linearity
The linearity was evaluated by determining the correlation coefficient (R2) of linear regression analysis (y=bx+a) of calibration curve contructed between peak area and analyte concentration in the range of 4-40 ng/spot.
Detection and quantitation limit (LOD and LOQ)
The LOD and LOQ were determined using data of standard deviation of the response and the slope of the calibration curve. LOD and LOQ calculated using the equation of 3.3 σ/S and 10 σ/S, respectively. σ is the standard deviation of the y-intercept of the regression line. S is the slope of the calibration curve. The LOD and LOQ were confirmed by analyzing the spot of formaldehyde with the LOD and LOQ concentration. The detection limit is expressed in ng/spot.
Precision
The precision was performed by repeatability and intermediate presicion. Repeatability (intraday precision) was evaluated by determining the amount of standard formaldehyde at three different concentration levels (4, 20 and 40 ng/spot) in six replications, while intermediate precision was evaluated by repeating the determination in six replications on two consecutive days. The relative standard deviation (RSD) values for repeatability and intermediate precision were calculated.
Accuracy
The accuracy was determined by adding known amount of standard formaldehyde solution to blank sample to give concentrations of 4, 20 and 40 ng/spot and was analyzed by the proposed methods. A mean percent recovery obtained from three experiments was calculated.
Formaldehyde analysis in wet noodles samples
The sample and standard solutions were derivatized with Nash reagent, extracted with chloroform and spotted on the same plate, eluted and analyzed by the proposed methods. Identification of formaldehyde in the samples was performed by comparing the similarity of Rf and UV-Vis spectra of the spots from samples with those from a standard. The amount of formaldehyde was calculated from peak area of the spot againts a calibration curve obtained. Each sample was analyzed in triplicate. The results obtained were expressed as mean of formaldehyde content (%).
Results and Discussion
Noodles are one of the most popular Indonesian foods20, unfortunately, this foods is often found to be added formaldehyde illegally, especially those sold in traditional markets21. Therefore, safety surveillance of wet noodles should be conducted more intesively. Several analytical methods are available for determination of the compound. However, no report on the determination of the compound in wet noodles using TLC densitometric method after derivatization with Nash reagent. A colour reaction for formaldehyde is described which depends on the synthesis of diacetyldihydrolutidine (DDL) from acetylacetone and formaldehyde in the presence of excess of ammonium salt (Figure 1)23. Its sensitivity and degree of specificity are comparable to those of other reactions requiring more severe conditions9. Wet noodles are generally coloured yellow which the colouring agent may interfere the formaldehyde determination spectrophotometrically with Nash reagent, therefore chromatographic seperation was needed to enhance the selectivity of the method.
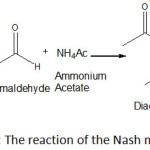 |
Figure 1: The reaction of the Nash method23 . |
In this study, formaldehyde standard/sample solution was derivatized with Nash reagent to give DDL, extracted with chloroform, spotted the chloroform extract to aluminium TLC plates coated (10 cm x 10 cm) with silica gel 60 F254 with 250 µm thicknes and eluted the plate using chloroform-methanol (1:4 v/v) as mobile phase.
The chromatograpic system resulted yellow spot at TLC plate and TLC-densitometric analysis resulted chromatogram peak at Rf 0.68 and UV-Vis spectrum having λmax at 300 and 412 nm (Figure 2). At wavelengths below 350 nm, both Nash reagent and DDL have a very strong absorption peak, while at wavelengths more than 350nm, the only DDL having an absorption peak, therefore the maximum absorption wavelength of 412 nm was selected, so the interference of the Nash reagent was effectively avoided7. The TLC-densitometric method showed a good selectivity. There was not observed any interference from the sample components at Rf of DDL.
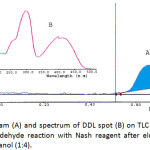 |
Figure 2: Chromatogram (A) and spectrum of DDL spot (B) on TLC silica plate (Rf = 0.68) resulted from formaldehyde reaction with Nash reagent after elution with mixture of chloroform and methanol (1:4). Click here to View figure |
The linear regression analysis of the calibration curve between the amount of formaldehyde and peak area of DDL showed good linear relationship over the concentration range of 4.02-40.20 ng/spot. The linear equation: Y = 127.56X + 665.35 with corellation co-efficient (r) = 0.999. (Figure 3 ). The LOD and LOQ values obtained were 1.75 and 5.29 ng/spot, respectively.
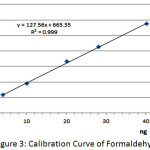 |
Figure 3: Calibration Curve of Formaldehyde. |
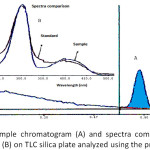 |
Figure 4: Profile of sample chromatogram (A) and spectra comparison of sample and formaldehyde standard (B) on TLC silica plate analyzed using the proposed method. |
The precisions of the method were found to be satisfactory as the RSD values determined by repeatability and intermediate precision studies were all less than 2.0 % (Table I). The accuracy of the method was determined from the recovery studies. Recoveries obtained from formaldehyde addition to blank sample ranged from 90.78 % to 96.39 %. The RSD was from 1.11-1.41 % (Table II).
Tabel 1: Intraday and intermediate precision study.
|
Formaldehyde amount (ng/spot) |
Intraday precision (% RSD)*) |
IIntermediate precision (% RSD)*) |
|
4.02 |
1,57 |
1,75 |
|
20.10 |
1,15 |
1,34 |
|
40.20 |
1,38 |
1,46 |
*) n=6
Tabel 2: Recovery Study (Accuracy).
|
Formaldehyde added (µg/g) |
Added Found*) (µg/g) |
Recovery (%)*) |
RSD (%) |
|
2.01 |
1.82 |
90.78 ± 1.09 |
1.18 |
|
10.05 |
9.55 |
95.03 ± 1.05 |
1.11 |
|
20.10 |
19.49 |
96.39 ± 1.36 |
1.41 |
|
Av recovery |
94.07 ± 1.17 |
*) n = 3
Formaldehyde analysis in wet noodles samples
Results of the analysis of three samples (A, B, and C) found that all the samples contain formaldehyde with the concentration of 990.94, 801.80 and 1684.36 mg formaldehyde per kg, respectively (Table III). The chromatogram of the samples had similarity in Rf and UV spectrum with those of formaldehyde standard (Figure 4). The results illustrated the alarming public health situation, particularly since formaldehyde increases the risk of leukemia.
Tabel 3: Formaldehyde content in wet noodles samples.
|
Sample Code |
Amount*) (mg/kg) |
SD |
RSD (%) |
|
A |
990.94 |
17.50 |
1.77 |
|
B |
801.80 |
9.67 |
1.21 |
|
C |
1684.36 |
23.45 |
1.39 |
*) n = 3
Conclusions
The above proposed TLC-densitometric method for the determination of formaldehyde illegally added to wet noodles as preservataive was successfully developed. The method gave satisfactory selectivity, linearity, precision and accuracy validation criteria, with lower operating cost, so could therefore be useful to conduct safety surveillance of wet noodles products.
Acknowledgements
The authors are thankful to Faculty of Pharmacy, Universitas Indonesia, Depok, West Java, Indonesia, for providing Laboratory facility.
Conflict Of Interest
The authors declare no conflict of interest.
References
- Tang, X.; Bai, Y.; Duong, A.; Smith, M. T.; Li, L.; Zhang, L. Environ. Int., 2009, 35, 1210–1224
CrossRef - Schwilk, E.; Zhang, L.; Smith, M. T.; Smith, A. H.; Steinmaus, C. J Occup. Environ. Med., 2010, 52 (9), 878-886
CrossRef - Aminah, A, S.; Zailina, H.; Fatimah, A.B. Food and Public Health, 2013, 3(1), 52-58.
- Jaman, N.; Hoque, M. S.; Chakraborty, S. C.; Hoq, M. E.; Seal, H. P. Int. J. Fish. Aq. Studies, 2015, 2(6), 94-98
- Norliana, S.; Abdulamir, A. S.; Abubakar, F.; Salleh, A. B. Am. J. Pharmacol. Tox,, 2009, 4 (3), 98-106,
CrossRef - Purawisastra, S.; Sahara, E.,. J. Nut. Food Res., 2011, 34(1), 63-74
- Tong, Q.; Song, J.; Li, Q. Adv. Mat. Res., 2012, 554-556, 1493-1497
- Yeh, T. S.; Lin, T. C.; Chen, C. C.; Wen, H. M. J. Food and Drug Anal., 2013, 21, 190-197.
CrossRef - Nash, T. Biochem. J., 1953, 55, 416-421
CrossRef - Khanmohammadi, M.; Garmarudi, A. B.; Dalali, N.; Karami, F.; Nemati, H. Bull. Chem. Soc. Ethiop., 2012, 26(2), 299-304.
CrossRef - Compton, B. S.; Purdy, W. C.. Anal. Chim. Acta, 1980, 119, 344-357.
CrossRef - Georghiou, P. E.; Ho, C. K. J. Can. J. Chem., 1989, 67, 871-876.
CrossRef - Al-Moniee, M. A.; Koopal, C.; Akmal, N.; van Veen, S.; Zhu, X.; Sanders, P. F.; Al-Abeedi, F. N.; Amer, A. M. J. Sensor Technol. , 2016, 6, 101-109.
CrossRef - Rivero, R. T.; Topiwala, V. J. Cosmet. Sci., 2004, 55, 343-350.
- Wu, P. W., Chag, C. C.; Chou, S. S. J. Food Drug Anal., 2003, 11, 8-15.
- Kaale, E.; Risha, P. ; Layloff, T. J. Chromatogr. A, 2011, 1218, 2732–2736
CrossRef - Dar, A.; Shafique, U.; Anwar, J.; Zaman, W.; Naseer, A. J. Saudi Chem. Soc., 2016, 20, S352–S356}
CrossRef - Doroodmand, M. M, Kharekani, M. G; Nezhad, M. D. Sensor Let., 2016, 14 (5), 554-562
CrossRef - Rani, R. ; Srivastava, M. M. Nat. Acad. Sc. Let., 2016, 39 (1), 21–24
CrossRef - Abidin, A. A.; Devi, C.; Adeline, A., 2013. J. Eng. Technol. Sci., 45 (1), 97-111
CrossRef - Gani, A. A., Yuwono, M.; Kuswandi, B. Am. J. Anal. Chem., 2013, 4, 661-667
CrossRef - ICH guidelines. International Conference on Harmonisation Guidelines on Validation of Analytical Procedure: Text and Methodology Q2 (R1), Geneva, 2005, 1-8.
- Compton, B. S.; Purdy, W. C.,. Can. J. Chem., 1980, 58, 2207-2211
CrossRef


ISSN Online: 2231-5039

![]()


