A Validated Liquid Chromatography–Tandem Mass Spectrometric (LC-MS/MS) Method for the Estimation of Fulvestrant in Human Plasma
1Department of Chemistry, JNTUH College of Engineering Jagityal, Nachupally, Karimnagar, Telangana, India.
2Institute of Science and Technology, Jawaharlal Nehru Technological University Hyderabad, Kukatpally, Telangana, India.
3Department of Chemistry, College of Education, Thamar University, Thamar, Yemen.
Corresponding Author E-mail: bsnarayana77@gmail.com
DOI : http://dx.doi.org/10.13005/ojc/330312
Download this article as:
![]()
A fast, reliable and sensitive high-performance liquid chromatographic / tandem mass spectrometric assay (LC-MS/MS) was developed to quantify fulvestrant in human plasma using fulvestrant-D3 as an internal standard (IS). The analyte was extracted from human plasma by liquid-liquid extraction (LLE) using methyl tertiary butyl ether (MTBE) as an extracting solvent. Chromatographic separation was achieved in a run time of less than 3.0 min on chromolith RP-18e, (100 × 4.6 mm, Ea) column. Analytes quantitation was performed by turbo-ion spray tandem mass spectrometry (TIS-MS/MS). The method involves simple isocratic chromatographic conditions at a flow rate of 1.0 mLmin-1 with approximately 50% flow splitting. Mobile phase was a mixture of 0.5% acetic acid and acetonitrile (20:80, v/v, respectively). Detection by mass spectrometry was achieved in the MRM mode by monitoring the transition pairs of m/z 605.2 to m/z 427.4 ion for fulvestrant and m/z 608.6 to m/z 430.4 for the IS, using the [M - H]¯ ions for the IS. A fully validated LC-MS/MS method was developed as per ICH guidelines. The developed liquid-liquid extraction (LLE), (LC-MS/MS) assay method demonstrated sufficient ability to track the concentrations of fulvestrant in human plasma at a level of accuracy and sensitivity suitable for pharmacokinetic studies. Calibration plots were linear (r2>0.99) over the concentration range of 0.100 to 25.0 ng. mL-1 for fulvestrant. The overall recovery was 79.29%. Precision expressed as %RSD was ≤ 3.1% and ≤ 2.97 % for intra-day and inter-day data respectively.
KEYWORDS:Fulvestrant; HPLC-MS/MS; Assay; Human plasma
Introduction
Fulvestrant, 7-alpha-[9-(4,4,5,5,5-penta fluoropentylsulphinyl)nonyl]estra-1,3,5-(10)-triene-3,17-beta-diol (Figure 1), is a novel estrogen receptor antagonist drug used for treatment of hormone receptor-positive metastatic breast cancer in postmenopausal women. Fulvestrant acts by competitive binding to the estrogen receptor (ER) with higher affinity than tamoxifen, resulting in complete abrogation of estrogen-sensitive gene transcription1–3.Fulvestrant is administrated as a once monthly dosage due to its novel, long-acting and oil-based formulation. Unlike tamoxifen, fulvestrant has no known estrogen agonist effects, and because of its different mode of action, it is used in the treatment of tamoxifen-resistant diseases 4–10. In the literature, there are only a few reports published on the determination of fulvestrant in biological samples and formulations. These reports include the determination of fulvestrant in human urine and plasma samples using RP-LC11, the determination of fulvestrant in pharmaceutical dosage forms 12-13, and the determination of fulvestrant in rabbit plasma and rat plasma using LC–MS\MS 14-15. Pharmacokinetic profile of the fulvestrant loading dose was studied using human plasma as a substrate and the analyte concentration was performed with LC-MS16. In the current study, we report a fully validated LC-MS/MS method for the accurate and sensitive determination of fulvestrant in human plasma. The developed method uses fulvestrant-D3 as an internal standard. The present method hires a simple liquid-liquid extraction (LLE) technique for sample preparation using a small sample volume (500 µL).The method was validated according to the ICH guidelines17. The developed method demonstrated high efficiency and may be successfully, applied for accurate measurement of fulvestrant concentration in bioequivalence studies and therapeutic drug monitoring programs.
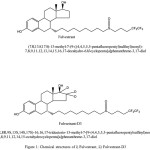 |
Figure 1: Chemical structures of i) Fulvestrant, ii) Fulvestrant-D3 |
Experimental
Instrumentation
A Shimadzu liquid chromatographic system (HPLC) (Shimadzu, Kyoto, Japan), comprising LC-10A Dvp binary pump, CTO-20A column oven, and a SIL-HTC refrigerated auto sampler was used. The chromatographic separation was performed using a chromolith RP-18e (100 × 4.6 mm) column (Phenomenex, USA) at a total run time of 3.0 min with a column oven temperature maintained at 35°C.
MS/MS analysis was performed using a triple quadrupole mass spectrometer model API 3000 system equipped with Turbo Ion Spray® (TIS) (Sciex Division of MDS, Toronto, Ontario, Canada). Data acquiring and analysis was carried out using Analyst software version 1.4.2 (Applied Biosystems). Positive electrospray ionization data were acquired under MRM mode. The TIS instrumental source settings for temperature, curtain gas, ion source gas 1 (nebulizer), ion source gas 2 (turbo ion spray), collision gas and ion spray voltage were 500°C, 10 psi, 60 psi, 60 psi, 8 psi and 5500 V, respectively. The TIS compound parameter settings for declustering potential, entrance potential, and collision cell exit potential were 70 V, 10 V, and 12 V, respectively. The collision energy setting was 30V for fulvestrant and 31V for fulvestrant-D3. The analytes were monitored using the following MRM ion transitions: fulvestrant (m/z 605.2 to 427.4) and IS (m/z 608.6 to 430.4). Mass spectra of fulvestrant and fulvestrant-D3 (IS) are shown in figure-2.
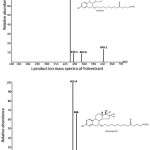 |
Figure 2: Mass spectra of i) fulvestrant and ii) fulvestrant-D3 |
Materials and Chemicals
Fulvestrant reference standard (potency 99.9%) was procured from Clearsynth labs, Mumbai, India. Fulvestrant-D3 standard (potency 99.5%) was procured as a gift sample from Hetero labs, Hyderabad, India. Other chemicals used were acetonitrile (HPLC grade) methyl tert-butyl ether (MTBE) and methanol (HPLC grade), these chemicals were purchased from J.T. Baker, Haryana, India. Acetic acid (GR grade) was obtained from Merck, Hyderabad, India. Purified water for HPLC was prepared using Milli-Q system (Millipore, Germany). Blank samples (drug free human plasma) were obtained from Vuppala venkaiah memorial Blood Bank, Hyderabad, India and stored at -70°C until use.
Preparation of Stock Solutions of Fulvestrant and Fulvestrant-D3
Standard stock solutions of fulvestrant (0.50 mg.mL-1), and fulvestrant-D3 (0.50 mg.mL-1) were prepared in methanol. The fulvestrant-D3 spiking solutions (100.00ng.mL-1) were prepared in 50% methanol from the stock. Standard stock solutions and fulvestrant-D3 spiking solutions were stored in refrigerator at 2–80C until use.
Preparation of Calibration Curve Standards
Drug-free human plasma samples were spiked to obtain fulvestrant concentration levels of 0.100, 0.200, 0.500, 1.25, 2.50, 5.00, 12.50 and 25.00 ng.mL-1 for analytical standards. These standards were stored in the freezer as a bench top stability, long-term stability in matrix at −78 ± 80C and freeze thaw stability at −20 ± 50C, until analysis. The reconstitution solution (0.5% acetic acid: acetonitrile in water, 20:80, v/v) were used to prepare the aqueous standards.
Preparation of Quality Control Samples
The concentrations of the aqueous quality control (QC) samples for fulvestrant and fulvestrant-D3 were prepared as follows: 0.100 ng. mL-1 (AQ-LLOQQC), 0.300 ng. mL-1 (AQ-LQC), 10.0 ng. mL-1(AQ-MQC1), 2.00 ng. mL-1 (AQ-MQC2), 20.0 ng. mL-1 (AQ-HQC), 120.0 ng. mL-1 (AQ-DQC) and AQ-ULOQ 25.0 ng. mL-1. The aqueous quality control samples were stored in cooling cabinet set at -10°C.To determine the method’s accuracy and precision, samples were prepared by spiking control human plasma at appropriate concentrations in bulk. Then, plasma aliquots of 500 µL each were distributed into different test tubes and stored at -78 ± 5°C until use.
Sample Preparation
Isolation of fulvestrant and fulvestrant–D3 from human plasma was achieved using liquid–liquid extraction method. A 500-µL aliquot of K3EDTA human plasma spiked with appropriate amount of fulvestrant was added into a 3.0 mL disposable polypropylene tube followed by spiking with 10 µL of internal standard solution. Then, 2.5 mL of methyl tertiary butyl ether(MTBE) was added and the sample was vortexed for approximately 10 min followed by centrifugation at 4000 rpm for approximately 5 min at 200C. Supernatant was transferred into a labeled vial tube and evaporated at 400C until dryness. The residue was dissolved in 100 µL of the mobile phase and mixed thoroughly. A 10-µL aliquot of the reconstituted extract was injected into the LC–MS–MS system for analysis.
Method Validation Procedures
System suitability test (SST) was performed by analyzing samples before and between normal runs during testing. At the beginning, system suitability was validated by injecting six sets of samples spiked with fulvestrantand fulvestrant-D3. %CV for retention time (RT) and area ratio (analyte area/internal standard area) were calculated. The %CV of retention times of the drug and internal standard should be within ≤ 4.00%. Peak area of the analyte should be more than or equal to five times the LLOQ sample when compared to first time acquired standard base line. The %CV observed in the standard baseline injected after ULOQ should be 20.0% for the analyte and 5.00% for the IS.
Ten different human plasma lots (07 K3EDTA human plasma, 01 hemolytic, 01 lipedimic, and 01 sodium heparin) were analyzed to evaluate specificity of the method. Screening of the plasma matrix was evaluated with two different human plasma lots. Responses of the interfering substances at the retention times of the analytes should be ≤ 20.00% of the response of respective LLOQ sample. Response of interfering peaks at the retention time of IS should be 5.00% of the response of the respective IS. The responses observed in hemolyzed, heparinized and lipemic matrix lots should be within the above-mentioned acceptance criteria.
Matrix factor experiment was performed by processing ten different lots of screened biological matrix of same anticoagulant (02-haemolytic, 02-lipedimic) after extraction. The extracts were spiked at concentrations equivalent to those in the low and high QC extracted samples(n=1) and IS at its working concentration.
Matrix effects occur when sample components other than the desired one are coeluted with the analyte and interfere with the ionization process in the MS detector, thereby causing ionization suppression or enhancement. Thus, to obtain accurate and reliable LC–MS data, matrix effects should be reduced or eliminated. To calculate a possible matrix effect (MF), mean peak areas of analyte post spiked in to plasma extracts with those of analyte spiked in to neat standard solutions at two QC levels. The following formula has been applied.

Linearity was determined for the concentration range of 0.100 to 25.00 ng. mL-1 for fulvestrant by weighted linear regression (1/X2) of the analyte/IS peak area ratios based on four independent calibration curves. All the calibration curve standards should be accepted when the back calculated concentrations are within ± 15.00% of their respective nominal concentrations except for LLOQ. LLOQ standard is acceptable when the back calculated concentration is within ± 20.00% of its nominal concentration. Calibration curve is acceptable when at least 75% of the total number of the calibration curve standards fall in the above acceptance criteria including at least one of the ULOQ and LLOQ standards.
Sensitivity was tested based on calculation of precision and accuracy of LLOQQC sample in at least 3 acceptable precision and accuracy batches individually and in total 9 between batches.
The intra-assay accuracy and precision were proposed by analyzing six replicates at five different QC levels; that is, LLOQ, LQC, MQC1, MQC2, and HQC. The inter-assay accuracy and precision were estimated by analyzing six replicates at five different QC levels on six different runs. The within run precision and accuracy(% mean bias) for LQC,MQC2,MQC1 and HQC samples should be within 15.00%, and for LLOQQC the precision and accuracy (% mean bias) should be within 20.00%. The between run accuracy and precision (% bias) for LQC, MQC2, MQC1 and HQC samples should be within 15.00%, and for LLOQQC the precision (% mean bias) should be within 20.00%.
Dilution medium used was screened human plasma having K3EDTA as anticoagulant with a dilution factor of 10. Dilution integrity test was aimed to validate the dilution procedure of real-time analysis at higher analyte’s concentrations (above the ULOQ level). Dilution integrity experiment was carried out at twice the ULOQ’s concentration. The precision of DQC samples should be within 15.00% and the % mean accuracy of DQC samples should be within the acceptance criteria.
Recovery of the developed method was assessed by analyzing six replicates for the fulvestrantalong with fulvestrant-D3. The % mean recoveries for the anlayte and IS was determined by comparing mean peak areas of six replicates of un-extracted quality control samples with the mean peak areas of extracted plasma quality control samples at high, middle and low levels. The %CV at each QC level and overall %CV of the analyte’s recovery should be within 15.00% for the internal standard the %CV of MQC1 should be within 15.00%.
% Mean recovery = (Mean extracted peak area/mean un-extracted peak area) × (Total volume of sample extraction solution/sample volume taken) × 100
Periodic testing of the stability of fulvestrant and IS in the injection solvent was performed. To consider the samples as stable, the targeted acceptable limits of precision and accuracy should have %CV ≤ 15% for the assay values. Six replicates of samples kept for 52.00 h at -20±5°C in refrigerator and at 5± 3°c for 56 hours at low and high concentrations were analyzed to evaluate the dry and wet extract stability. Bench top stability was assessed byanalyzing six replicates of fulvestrant-spiked samples kept for 7.0 h at room temperature (~25 °C) at two concentration levels (LQC and HQC). The freeze-thaw stability of fulvestrant and fulvestrant-D3in human plasma following five cycles was also assessed. The samples were kept at -20± 5°C and -78±8°C between freeze/thaw cycles. Before analysis, samples were thawed unassisted at room temperature for ~1.5 h. The long-term stability of the analytes during freezing of human plasma was also evaluated.
The stability of stock solutions of fulvestrantand fulvestrant-D3 was assessed by analyzing samples of 0.5 mg mL-1 kept in methanol for 6.0 h at ambient temperature. The %mean short-term stock solution stability for the analytes at room temperature should be in the range of 90.00-110.00 and %CV for stability and comparison should be within 15.00%
Short-term working solution stability at low and high concentrations of fulvestrant was tested by analyzing samples of 5.00 ng.mL-1and 1250 ng.mL-1, respectively, kept in methanol for 6.0 hours at ambient temperature. Short-term working solution stability for fulvestrant-D3was assessed by analyzing samples of 100 µg mL-1 kept in methanol for 6.0 hours at ambient temperature. The % mean short-term working solution for the analytes at room temperature should be in the range of 90.00-110.00 and %CV for stability and comparison samples should be within 15.00%.
Long-term stock solution stability for the analytes was evaluated by analyzing samples of 0.50 mg.mL-1 kept in methanol for 10days at 5±3°C. The %mean long-term stock solution stability for the analytes should be in the range of 90.00-110.00 and %CV for stability and comparison samples should be within 15.00%.
Long-term working solution stability at ULOQ level was evaluated by analyzing samples of 1250 ng.mL-1 kept in methanol for 10 days at 5±3°C. Long-term working solution stability at LLOQ level was tested by analyzing samples of 5.0 ng.mL-1 kept in methanol for 10days at 5±3°C. Long-term working solution stability for fulvestrant-D3was assessed by analyzing samples of 100 ng.mL-1 kept in methanol for 10days at 5±3°C. The %mean long-term working solution for the analytes should be in the range of 90.00-110.00 and %CV for stability and comparison samples should be within 15.00.
Ruggedness of the method was evaluated by using different analyst and different columns of the same make and model for different equipment of the same model and make. Ruggedness of the method was performed by re-injecting one previously processed, evaluated, and accepted precision and accuracy batch.
Results and Discussion
Method Development
To optimize the mobile phase, different volume ratios of acetonitrile/methanol with various acidic modifiers like acetic acid, ammonium acetate, formic acid, and ammoniumformate were tested. Satisfactory results were obtained with a mobile phase composed of methanol and 5 mM ammonium acetate, but the results were non-reproducible. The optimized mobile phase consisted of a mixture of 0.5% acetic acid and acetonitrile (20:80 v/v, respectively) under isocratic mode at a flow rate of 1.00 mL.min-1. Various chromatographic columns of different make (i.e., Kromasil 100-5 C18, 100 × 4.6, 5 µm; Alltima HP C18, 50 × 4.6, 3 µm; Zorbax SB C18, 50 × 4.6, 5 µm; chromolith RP-18e, 100 × 4.6 mm; Zorbax XDB-phenyl 75 × 4.6, 3.5 µm; Ace3C18, 150 × 4.6, 3 µm; Hypurity advance 75 × 4.6, 5µm, and Discovery HS C18 50 mm × 4.6 mm, 5 µm) were tested to achieve both a shorter runtime and satisfactory peak resolution. Desired chromatographic resolution was obtained with chromolith RP-18e, (100 × 4.6 mm) column (Phenomenex, USA) with a column oven temperature maintained at 35°C.
The typical MRM chromatograms for human plasma samples spiked with fulvestrant and fulvestrant-D3 for double blank, blank with IS and LLOQQC are shown in Figure 3.
MS parameters were optimized to obtain the optimum ionization and droplet drying. The most sensitive mass transition was observed from m/z 605.2to 427.4 for fulvestrant and from m/z 608.6 to 430.4 for fulvestrant-D3.
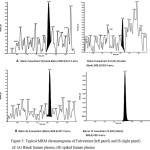 |
Figure 3: Typical MRM chromatograms of Fulvestrant (left panel) and IS (right panel) of: (A) Blank human plasma, (B) spiked human plasma |
System Suitability
The precision for the system suitability test expressed as %CV for the retention time was 3.10%. In addition, after a run of ULOQ, no significant carryover was observed in the blank sample(data not shown)
Selectivity, Sensitivity and Linearity
Inspecting the chromatograms derived from processed blank and spiked plasma samples showed that no significant interferences from indigenous components in drug-free human plasma at the retention time of the analyte and the IS. The lowest limit of quantification LLOQ for the analyte was set at 0.100 ng.mL-1at which the signal-to noise ratio (S/N) was measured. The method precision and accuracy at LLOQ were calculated as 5.66% and 84.5%, respectively.
The assay was linear over the concentration range of 0.100 to 25.00 ng. mL-1 for fulvestrant. Using the 1/X2 model, values for coefficient of determination (r2) were calculated as ≥ 0.98 and ≥ 0.99 for fulvestrant and fulvestrant-D3, respectively.
Precision and accuracy
The reliability of the method was tested by spiking the analytes into blank human plasma samples at their LLOQQC, LQC, MQC1, MQC2, HQC, and DQC levels. Under the optimized conditions, the intra-assay accuracy and precision were calculated using five replicates as presented in Table 1. The average precision expressed as RSD% (n = 3) for intraday and inter day for the fulvestrant-spiked control samples at 0.1 to 20.0 ng. mL-1 levels was 2.95 and 3.98, respectively. The mean accuracy ranged from 84.5 to 100.0%.
Table 1: A summary of intra- and inter-day precision and accuracy data for fulvestrant
|
Quality control |
Run |
Concentration found (Mean ± SD) |
Precision (%) |
Accuracy (%) |
|
Intraday variation (six replicates at each concentration) |
||||
|
LLOQ(0.100 ng.mL-1) |
1 |
0.0845±0.00478 |
5.66 |
84.50 |
|
2 |
0.102±0.00827 |
8.11 |
98.00 |
|
|
3 |
0.100±0.00843 |
8.43 |
100.00 |
|
|
LQC(0.300 ng.mL-1) |
1 |
0.282±0.00907 |
3.22 |
94.00 |
|
2 |
0.295±0.00539 |
1.83 |
98.33 |
|
|
3 |
0.292±0.00612 |
2.10 |
97.33 |
|
|
MQC1(10.00 ng.mL-1) |
1 |
9.50±0.123 |
1.29 |
95.00 |
|
2 |
9.69±0.119 |
1.23 |
96.90 |
|
|
3 |
9.76±0.160 |
1.64 |
97.60 |
|
|
MQC2(2.00 ng.mL-1) |
1 |
1.91±0.0314 |
1.64 |
95.5 |
|
2 |
1.96±0.0319 |
1.63 |
98.00 |
|
|
3 |
1.97±0.0575 |
2.92 |
98.50 |
|
|
HQC(20.00 ng.mL-1) |
1 |
18.8±0.0816 |
0.43 |
94.00 |
|
2 |
19.1±0.447 |
2.34 |
95.50 |
|
|
3 |
19.2±0.703 |
3.66 |
96.00 |
|
|
DQC(120.00 ng.mL-1) |
1 |
120±1.21 |
1.01 |
100.00 |
|
2 |
123±3.87 |
3.15 |
97.50 |
|
|
3 |
124±3.54 |
2.85 |
96.67 |
|
|
Inter day variation(18 replicates at each concentration) |
||||
|
LLOQ |
0.0956±0.0107 |
11.19 |
95.60 |
|
|
LQC |
0.290±0.00861 |
2.97 |
96.67 |
|
|
MQC1 |
9.65±0.169 |
1.75 |
96.50 |
|
|
MQC2 |
1.95±0.0496 |
2.54 |
97.50 |
|
|
HQC |
19.0±0.489 |
2.57 |
95.00 |
|
|
DQC |
122.0±3.47 |
2.84 |
98.33 |
|
Matrix Effect and Recovery
Matrix effect was found insignificant in all the ten batches for fulvestrant at LQC and HQC levels. The precisions for IS normalized matrix factor at LQC and HQC levels were calculated as 1.08% and 3.45%, respectively. IS normalized factor was 0.893 for LQC and 0.983 for HQC. The results of the matrix effect are reported in table-2. These results suggest that, under the optimized conditions, ion suppression or enhancement due to plasma matrix was negligible.
The mean recoveries for fulvestrant at HQC, MQC1 and LQC were 65.00% and 68.30%, and 71.17% respectively. The overall percentage mean recoveries and %CV for fulvestrant was 68.16% and 4.53%, and for fulvestrant-D3 was 79.29% and 7.45%.
Table 2: Matrix effect on determination of fulvestrant and fulvestrant-D3 in human plasma (n =6)
| LQC |
HQC |
|||||||||||
|
Plasma Lot |
Extracted Area |
MF |
IS Normalisized MF |
Extracted Area |
MF |
IS Normalisized MF |
||||||
|
Drug |
IS |
Drug |
IS |
Drug |
IS |
Drug |
IS |
|||||
|
1 |
10488 |
364152 |
0.80 |
0.89 |
0.90 |
721289 |
359416 |
0.90 |
0.92 |
0.98 |
||
|
2 |
10061 |
349557 |
0.76 |
0.85 |
0.90 |
670031 |
337207 |
0.84 |
0.87 |
0.97 |
||
|
3 |
9422 |
343214 |
0.72 |
0.84 |
0.86 |
677032 |
339604 |
0.85 |
0.87 |
0.97 |
||
|
4 |
10291 |
357906 |
0.78 |
0.87 |
0.90 |
659593 |
332276 |
0.83 |
0.85 |
0.97 |
||
|
5 |
10380 |
352280 |
0.79 |
0.86 |
0.92 |
651029 |
322565 |
0.82 |
0.83 |
0.99 |
||
|
6 |
9662 |
346676 |
0.73 |
0.84 |
0.87 |
684665 |
340894 |
0.86 |
0.88 |
0.98 |
||
|
7(Haemolytic) |
9268 |
348323 |
0.70 |
0.85 |
0.83 |
686396 |
337226 |
0.86 |
0.87 |
0.99 |
||
|
7(Haemolytic) |
9877 |
335694 |
0.75 |
0.82 |
0.92 |
686726 |
337521 |
0.86 |
0.87 |
0.99 |
||
|
9(Lipedimic) |
10091 |
343782 |
0.77 |
0.84 |
0.92 |
683286 |
334122 |
0.86 |
0.86 |
1.00 |
||
|
10(Lipedimic) |
10284 |
348361 |
0.78 |
0.85 |
0.92 |
685503 |
337364 |
0.86 |
0.87 |
0.99 |
||
|
Mean |
0.76 |
0.85 |
0.89 |
Mean |
0.85 |
0.87 |
0.98 |
|||||
|
SD |
0.0106 |
SD |
0.0308 |
|||||||||
|
%CV |
1.08 |
%CV |
3.45 |
|||||||||

Stability Studies
The analytes showed stability in human plasma samples over five freeze-thaw cycles when stored at below -78 ± 5 °C and thawed at room temperature. Wet extract stability was maintained up to 56 h when stored at 5 ± 3 °C. Various conditions for stability in plasma and the values for the percent change are shown in table 3.
Table 3: Stability data of fulvestrant under various conditions (n = 6)
| QC | Spiked concentration | Mean calculated concentration | %Mean accuracy | % precision |
| (ng.mL-1) | (ng.mL-1) ± SD | |||
|
Bench top stability (07 hours at ambient temperature) |
||||
| LQC(0.300 ng.mL-1) | 0.288 | 0.294 ± 0.0104 | 98 | 3.54 |
| HQC(20.00ng.mL-1) | 19.7 | 19.7 ± 0.373 | 98.5 | 1.89 |
| Dry extract stability (52.00 Hours at -20±50C) | ||||
| LQC(0.300ng.mL-1) | 0.298 | 0.290 ± 0.00854 | 96.67 | 2.94 |
| HQC(20.00ng.mL-1) | 19 | 19.6 ± 0.446 | 98 | 2.28 |
| Wet extract stability (56 hours at 5± 30c) | ||||
| LQC(0.300ng.mL-1) | 0.283 | 0.295 ± 0.00716 | 98.33 | 2.43 |
| HQC(20.00ng.mL-1) | 19.6 | 19.6 ± 0.245 | 98 | 0.54 |
| Auto sampler Re-injection reproducibility (48.00 Hours at 5± 30c) | ||||
| LQC(0.300ng.mL-1) | 0.293 | 0.296 ± 0.00835 | 98.67 | 2.82 |
| HQC(20.00ng.mL-1) | 19.1 | 19.6 ± 0.129 | 95.5 | 0.96 |
| Freeze & thaw stability Five Cycles (-20±5oC) | ||||
| LQC(0.300ng.mL-1) | 0.303 | 0.293± 0.00988 | 97.67 | 3.37 |
| HQC(20.00ng.mL-1) | 18.5 | 18.9± 0.560 | 94.5 | 2.96 |
| Freeze & thaw stability Five cycles (-78±8oC) | ||||
| LQC(0.300ng.mL-1) | 0.307 | 0.304±0.00440 | 101.33 | 1.45 |
| HQC(20.00ng.mL-1) | 19.4 | 18.9±0.432 | 94.5 | 2.29 |
Ruggedness
For method ruggedness, the method was run with separate analysts, separate columns (of the same maker with separate batch no.) and with separate sets of reagents. The mean precision (%CV) and accuracy values calculated under various conditions ranged from 1.42–6.95% and 97.0–100%, respectively.
Conclusions
In summary, an accurate, selective, and high-throughput LC-MS/MS assay was developed for the quantification of fulvestrant in human plasma. Interferences from endogenous plasma components as well as from other sources were negligible. The simplicity of the assay using LLE, small sample volume (500µL) and sample turnover rate of about 3.0 min per sample makes the present method an efficient procedure in high-throughput bioanalysis suitable for routine measurement of fulvestrant in both formulations and diagnostic samples. Moreover, the method described could easily be adapted to various other biological samples and might be useful in pharmacokinetic studies.
Acknowledgements
Authors would like to thank Department of chemistry, Jawaharlal Nehru Technological University, Hyderabad; spectrum pharma research solutions Hyderabad, telangana, India for the technical support provided.
References
- Robertson, J.F.R.; Harrison, M. Fulvestrant: pharmacokinetics and pharmacology.Br J Cancer , 2004, 90 (Suppl 1), 7–10.
- Robertson, J.F.R. Fulvestrant (Faslodex®)—how to make a good drug better. Oncologist, 2007, 12, 774–784.
- Howell, A.; Robertson, J.F; Quaresma, A. J.; Aschermannova, A.; Mauriac, L.; Kleberg, U.R.; Vergote, I.; Erikstein, B.; Webster, A; and Morris, C. Fulvestrant, formerly ICI 182, 780, is as effective as anastrozole in postmenopausal women with advanced breast cancer progressing, after prior endocrine treatment. JCO (Journal of Clinical Oncology). 2002, 20, 3396–3403.
- Robertson, J.F.R.; Odling S.W.; Holcombe, C.; Kohlhardt, S.R.; Harrison, M.P.; and Webster, A. The pharmacokinetics of single dose Faslodex TM (ICI 182,780) in postmenopausal breast cancer – relationship with estrogen-receptor down regulation. Process of the American Society of Clinical Oncology. 2000, 19, 94a (abstract 362).
- Morris, C.; and Wakeling, A. Fulvestrant (‘Faslodex’)–a new treatment option for patients progressing on prior endocrine therapy. Endocr Relat Cancer.2002, 9, 267–276.
- Shah, V.P.; Midha, K.K.;Dighe, S.; McGilveray, I.J.; Skelly, J.P.; and Yacobi, A. Analytical methods validation: bioavailability, bioequivalence and pharmacokinetic studies. Conference report. European Journal of Drug Metabolism and Pharmacokinetics. 1991,16, 249.
- Wakeling, A.E. The future of new pure antiestrogens in clinical breast cancer. Breast Cancer Research and Treatment.1993, 25, 1–9.
- Gumustas, M.L.; Sengel-Turk C.T.;Hascicek, C.; and Ozkan, S.A. Optimization of a validated stability-indicating RP-LC method for the determination of fulvestrant from polymeric based nanoparticle systems, drugs and biological samples. Biomed Chromatogr. 2014, 28, 1409-1417.
- Murali Balaram, V.; Mushraff, A. K.; Venkateswara Rao, J.; BhanuTeja, B.; and Srikanth A. validated high performance liquid chromatography method for the determination of fulvestrant in pharmaceutical dosage forms. Int. J. Chem. Sci. 2010, 8(2), 1215-1225.
- Alptug, A.; Bilal, Y.; and Yucel, K. Stability Indicating HPLC Method for the Determination of Fulvestrant in Pharmaceutical Formulation in Comparison with Linear Sweep Voltammetric Method. Iran J Pharm Res. 2016, 15(3), 369–378.
- Murali Balaram, V.; Parmar, D.; Bhanu Teja, B.; Shivprakash, R.; Venkateswara Rao, J.; and Bhavesh, D. Sensitive and rapid high-performance liquid chromatography tandem mass spectrometry method for estimation of fulvestrant in rabbit plasma.Biomed Chromatogr. 2010, 24, 863–867.
- Zhongyang, Liu.; Guangzhi,Gu.; Huimin, Xia.; Qiang, Liu.; ,Zhiqing, Pang.; Xinguo, Jiang.; and Jun, Chen. Determination of Fulvestrant in Rat Plasma by LC–MS–MS: Application to a Pharmacokinetic Study. Chromatographia. 2011, 74(3-4), 227-34.
- McCormack, P.L.; and Sapunar, F. Pharmacokinetic profile of the fulvestrant loading dose regimen in postmenopausal women with hormone receptor-positive advanced breast cancer. Clin Breast Cancer.2008, 8(4):347-51.
- FDA, Guidance for industry: Bioanalytical Method Validation. US Department of and Health Human Services, 2001.
- Robertson, J.F.R.; Odling S.W.; Holcombe,C.; Kohlhardt, S.R.; and Harrison, M.P. Pharmacokinetics of a single dose of fulvestrant prolonged-release intramuscular injection in postmenopausal women awaiting surgery for primary breast cancer. ClinTher. 2003, 25, 1440–1452.
- Howell, A.; DeFriend, D.J.; Robertson, J.F.R.; Blamey, R.W.;, Anderson, L.; Anderson, E.; Sutcliff, F. A.; and Walton, P. Pharmacokinetics, pharmacological and anti-tumor effects of the specific anti-oestrogen ICI 182780 in women with advanced breast cancer. Br J Cancer.1996, 74(2), 300–308.
- Johnston, S.J.; and Cheung, K.L.Fulvestrant – a novel endocrine therapy for breast cancer. Curr Med Chem.2010, 17, 902–914 http://www.fda.gov/downloads/Drugs/GuidanceComplianceRegulatoryInformation/Guidances/ucm070107.pdf.


![]()


