Synthesis, Characterization and Biological Activity of Novel Salt/Molecular Salts of Tinidazole
Rama Chandra Murthy Patnala1,2, Mukkanti Khagga2, Ram Bhavani 3 and Vasudha Bhavani4
1Neuland Laboratories Limited, Sanali Info Park, Road No. 2, Banjara Hills, Hyderabad-500 034, Telangana State, India.
2Centre for Chemical Sciences and Technology, Institute of Science and Technology, Jawaharlal Nehru Technological University Hyderabad, Kukatpally, Hyderabad-500 085, Telangana State, India.
3Green Evolution Laboratories, Wangapally Village, Nalgonda-500 085, Telangana State, India.
4Anurag Group of Institutions (Formerly Lalitha College of Pharmacy),Venkatapur (V), Ghatkesar(M), Ranga Reddy district, Telangana State, India.
Corresponding Author E-mail: psrcmurthy2016@gmail.com
DOI : http://dx.doi.org/10.13005/ojc/330235
Article Received on : March 16, 2017
Article Accepted on : April 15, 2017
The present study is the continuation of our recently published work on novel salts of Tinidazole, in this study, new solid forms i.e salt/molecular salts of Tinidazole with certain selected organic acids such as hydroxyl benzoic acids, oxalic acid and para-toulenesulphonic acid (TN-organic acids) and inorganic acid such as hydrochloric acid (TN-HCl) were prepared and tested for the solubility parameter. The solubility of TN (compound 1) is 3.7 mg /mL, TN-HCl (compound 2) is 321.2 mg/mL and TN-PTSA (compound 3) is 184.2 mg /mL. These results clearly indicates enhancement of solubility by 86.8 folds and 49.7 folds respectively when compared to TN. These new solid phases (compounds 1-11) were characterized by IR, 1H NMR and DSC and were evaluated for various biological activities viz., anti-antibacterial, analgesic and anti-inflammatory activity. Compounds, TN-PTSA and TN-EBA exhibited good antibacterial activity against the Gram negative bacterial strain, Bacillus subtilus. In case of anti-inflammatory activity studies, TN-PTSA,TN-HCl,TN-DBA exhibited significant activity ranging from 45 to 50 % when compared to TN (50.7%) but exhibited moderate activity in comparison to the standard drug Diclofenac sodium (67.3%). While, in case of analgesic activity, TN-PBA, TN-PTSA, TN-VA exhibited prominent activity ranging from 78 to 86 % when compared to TN (94.1%) but exhibited moderate analgesic activity in comparison to the standard drug morphine (97.3%).
KEYWORDS:Salts; Molecular salts; Tinidazole; Hydroxybenzoic acid; Anti-inflammatory activity; Analgesic activity; Solubility
Download this article as:| Copy the following to cite this article: Patnala R. C. M, Khagga M, Bhavani R, Bhavani V. Synthesis, Characterization and Biological Activity of Novel Salt/Molecular Salts of Tinidazole. Orient J Chem 2017;33(2). |
| Copy the following to cite this URL: Patnala R. C. M, Khagga M, Bhavani R, Bhavani V. Synthesis, Characterization and Biological Activity of Novel Salt/Molecular Salts of Tinidazole. Orient J Chem 2017;33(2). Available from: http://www.orientjchem.org/?p=31873 |
Introduction
An infection that is caused by Entamoeba histolytica, in the large intestine, is named as Amoebiasis, which resides mainly in the intra-intestinal lumen. Targeting the drug to colon is an efficient way of treatment of amoebiasis and various other colonic infections. For colonic infections and intestinal amoebiasis, tinidazole is the drug of choice which would make the drug effective with low dose and avoids the probable hazards observed in conservative dose. Tinidazole is one of the prominent drug among the family of nitro imidazole derivative, it is anti-parasitic drug used against protozoan infection. For both intestinal and extra intestinal amoebiasis, it is used as tissue amoebic ides and has broad spectrum cidal activity against protozoa including Giardia Lamblia many anaerobic bacteria such as fragilis, fusobacterium, clostridium perfrigens, cldifficile, helicobacter pylori. An antiparasitic drug that is prominently used against protozoan infections is, Tinidazole [1-(2-ethylsulfonylethyl)-2-methyl-5-nitro-imidazole]1. The molecular formula is C8H13N3O4S (Figure I). It was developed in 1972. A significant deficiency of Tinidazole is the relatively low solubility in water, due to which it paves the way in identifying a new salt/co-crystal forms with enhanced properties. The pKa value of tinidazole is 4.70, signifying its basic character.
Investigating into the diverse solid forms of active pharmaceutical ingredients (APIs) is significant for the thriving progress of a drug product. In the exploration of drug resistance of the microbial strains2, antimicrobial agents are still considered as the prospective drug candidates. Acquiring salts or co-crystals of APIs raise the prospective of changing and optimizing their physical and chemical properties, such as solubility and bioavailability3. Some of the important parameters in designing solid dosage forms, is by suitably modifying the solubility and dissolution rates in aqueous media, as they usually influence the rate of drug absorption and transport in the body. The most modern exploration in pharmaceutical industry are determined on the discovery of new salts or cocrystals, as these modifications would provide higher potential to explore the properties of APIs by using a larger range of pharmaceutically accepted conformers4, 5.
In continuation to our research work on novel salt of tinidazole published recently6 and encouraged by the obtained results, we have extended our scope of the research work to prepare some more additional TN salts. The endeavor of the present investigation was to prepare new solid forms i.e salt/molecular salts of Tinidazole with certain selected organic acids such as hydroxy benzoicacids, oxalic acid and para-toulenesulphonic acid (TN-organic acids) and inorganic acid such as hydrochloric acid (TN-HCl) and to determine the solubility stature. The characterization of the synthesized TN salts was determined by IR, 1H NMR and DSC. Furthermore, these new solid phases were evaluated for various biological activities viz., anti-antibacterial, analgesic and anti-inflammatory activity.
Results and Discussion
ΔpKa Calculation
The ΔpKa value of the API and the conformer determines the formation of cocrystal or salt depends. A useful guide to know before and is the the ΔpKa rule, wherein ΔpKa = pKa (conjugate acid of base) − pKa (acid), if an acid−base complex will give a neutral cocrystal (ΔpKa < 3) or an ionic salt (ΔpKa > 3). A more practical cutoff for organic salts is taken as ΔpKa < 0 for cocrystals, ΔpKa >3 for salts, and in the range 0 < ΔpKa < 3 there is possibility of a cocrystal−salt continuum 7-9.
In the present study, organic acids viz., hydroxybenzoic acids, oxalic acid, para-toulenesulphonic and inorganic acid such as HCl and Tinidazole were the choice of compounds that were commercially available for the preparation of salt/cocrystals solid phases (Figure 1, compounds 1-11). The ΔpKa values for these compounds are tabulated in Table-1. The Hydroxybenzoic acids such as gallic acid (GA), eudesmic acid (EBA), vanillic acid (VA), 4-hydroxy benzoic acid (PBA), 3,4-dihydroxy benzoic acid (DBA) and anacardic acid (AA) are anti-oxidants and cause apoptopsis characterized by DNA fragmentation10. From table 1, it is evident that within the synthesized compounds, compound 2 (TN-HCl), 3 (TN-PTSA) and 4 (TN-OXA) fulfills the criteria of ΔpKa rule, i.e (ΔpKa > 3) indicating the ability for the potential formation of salts of Tinidazole (TN), while the compounds 5-11 with hydroxybenzoic acids as conformers fall in the range 0 < ΔpKa < 3 indicating for the possible formation of a cocrystal−salt continuum. We are in concur with the suggestions of the authors Sarma et al 11 with respect to the term molecular salt (instead of salt) in case of hydroxybenzoic acids, for ionic compounds assembled from organic acids and bases.
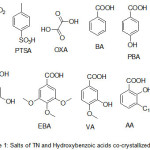 |
Figure 1: Salts of TN and Hydroxybenzoic acids co-crystallized with TN
|
Table 1: pKa Values of Tinidazolea and Organic acidsb Used in This Study
|
Compound |
Acids/Base | pKa |
ΔpKa |
|
1 |
TN | 4.76 | |
|
2 |
HCl | -7 |
11.76 |
|
3 |
PTSA | -0.43 ± 0.10 |
5.19 |
|
4 |
OXA | 1.38 ± 0.54 |
3.38 |
|
5 |
BA | 4.20 ± 0.10 |
0.56 |
|
6 |
PBA | 4.57 ± 0.10 |
0.19 |
|
7 |
DBA | 4.45 ± 0.10 |
0.31 |
|
8 |
GA | 4.33 ± 0.10 |
0.43 |
|
9 |
EBA | 4.23 ± 0.10 |
0.53 |
|
10 |
VA | 4.35±0.10 |
0.23 |
|
11 |
AA | 3.05±0.10 |
1.71 |
ahttps://pubchem.ncbi.nlm.nih.gov/PubchemCID: 5479; bhttp://www.wikipedia.org
Spectroscopic Analysis
FT-IR Analysis
A vibrational stretching frequencies exhibited by TN in the FT-IR spectrum (Figure I) at 2999-2911, 1761, 1522 and 1479, and 1454 cm-1 was assigned to C-H stretching, C=C (imidazole ring), C=N (imidazole ring), N=O (NO2), CH2 bending, C-C stretching, respectively. Furthermore, the peaks at 1367, 1301 and 1264, 1191-1123 and 1037 cm-1 were assigned to N=O symmetric stretching, S=O asymmetric stretching, C-O stretching,S=O symmetric stretching and C-N stretching, respectively. In case of the FT-IR spectra of TN-PTSA (Figure II), absorption band at 1163 cm-1 (SO3 stretching) and 1028 cm-1 (O=S=O stretching in SO3H) indicates the presence of SO3H groups. In case of TN-HCl FT IR spectrum (Figure III), it is observed that the bands associated with –C=C (imidazole ring)-, -C=N (imidazole ring) and N=O (NO2) asymmetric stretching shifted to 1785, 1541 and 1503 cm-1 respectively indicating for the formation of TN-HCl. The observed change in the absorption bands (compared to TN IR spectrum) is ascribed to an ionic interaction between the imidazole nitrogen and the corresponding HCl and PTSA conformers.
Furthermore, IR stretching frequencies were useful to differentiate the solid form nature, salt or molecular salts (in the present case TN-Hydroxybenzoic acids, compounds 5-11), based on the characteristic vibrational bands of the carboxylate (COO-) groups (Table 2).12-14. In general free COOH stretching appears at 1720-1700 cm-1 (in this present case the –C=O stretch for the Hydroxybenzoic acids appeared in the range 1655-1685 cm-1) and COO– absorbs strongly at 1650-1550 cm-1 (asymmetric) and has a weaker band at 1400 cm-1 (symmetric). Absence of peaks in the region 1720-1706 cm-1 means that COOH dimer is absent in all the compounds. These characteristic vibrational bands are very much evident in the TN-Hydroxybenzoic acids (compounds 5-11) indicating the possibility of molecular salts.
Table 2: Vibrational stretching frequencies of compounds 1-11
|
Salts/Molecular salts |
1 | 2 | 3 | 4 | 5 | 6 | 7 | 8 | 9 | 10 |
11 |
| COO–,υmax, υmax | – | – | – | 16181368 | 16061366 | 16021366 | 16151367 | 16481368 | 15871367 | 15961368 | 16181366 |
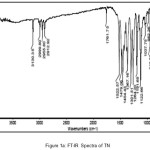 |
Figure 1a: FT-IR Spectra of TN |
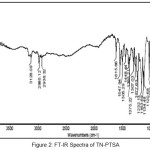 |
Figure 2: FT-IR Spectra of TN-PTSA
|
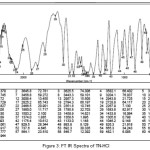 |
Figure 3: FT IR Spectra of TN-HCl
|
1H NMR Analysis
An insight into the 1H NMR of Tinidazole and TN-salts/molecular salts was evaluated to know the formation of salt/molecular salts. In case of 1H NMR of tinidazole (Figure IV), a signal with one proton integration in the aromatic region at δ 8.05 ppm is assigned to the imidazole ring, while the triplet signal with two proton integrations in the region 4.68 ppm and 3.68 ppm corresponds to two methylene (2 X -CH2) linking the imidazole ring and the aliphatic propyl sulphonyl group (-CH2-CH2-SO2-). The protons signals in the aliphatic region at 3.18 ppm as quartet with three proton integration, 2.51 ppm as singlet with three proton integration and 1.21 ppm as triplet with three proton integration corresponds to –CH3–CH2-, –CH3 and –CH3-CH2 groups respectively.
In case of TN-HCl (compound 2) and TN-PTSA (compound 3) (Figure V and VI), it observed that there is a shift in the signal of imidazle ring proton to 8.20 ppm when compared to the imidazole ring proton of tinidazole, indicating the formation of the corresponding salts. However, in case of the remaining compounds in the series, a marginal increase in the signal shift of the imidazole ring was observed, possibly due to the weak hydrogen bonding between TN and Hydroxybenzoic acids.
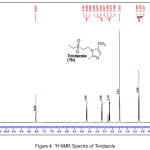 |
Figure 4: 1H NMR Spectra of Tinidazole
|
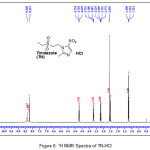 |
Figure 5: 1H NMR Spectra of TN-PTSA
|
 |
Figure 6: 1H NMR Spectra of TN-HCl
|
Powder X-Ray Diffraction Analysis
In order to confirm the formation of new solid forms of pharmaceuticals, powder X-ray diffraction measurements is used as an important tool for their structural characterization15. Confirmation of the formation of salt/molecular salts can be determined by PXRD and single crystal X-ray (or neutron) diffraction techniques 16-21.Recently, we have reported the powder X-Ray diffraction patterns of the TN and TN-PTSA and confirmed that the powder diffraction pattern of TN-PTSA solid form is different from the XRD pattern of TN6. In the present case, TN, TN-GA and Gallic acid compounds were recorded for powder X-Ray diffraction analysis and the respective patterns are shown in Figure VII, VIII and IX. The TN-GA solid form exhibited a change in X-ray powder diffraction pattern that is different from the XRD pattern of Gallic acid and TN. The powder X-Ray diffraction analysis of TN showed characteristic peaks at 8.19, 10.20, 10.36, 14.47, 14.63, 16.34, 16.71, 16.88, 17.28, 17.79, 18.02, 19.04, 20.89, 21.56, 21.80, 21.97, 23.07, 23.29, 25.38, 27.23, 28.15, 28.34, 30.06, 31.74, 32.30, 33.31, 43.81, 49.56 (2θ ± 0.2o 2θ) while TN-GA showed characteristic at peaks 7.97, 8.46, 10.40, 11.72, 12.45, 14.64, 14.78, 16.03, 16.45, 16.74, 16.99, 17.55, 18.03, 18.32, 18.95, 19.24, 19.56, 20.90, 21.09, 21.80, 21.97, 23.46, 23.75, 24.23, 24.38, 25.20, 25.65, 25.86, 26.82, 27.51, 27.80, 28.44, 28.61, 31.14, 31.94, 32.51, 33.49, 35.93, 37.28, 38.30, 39.25, 40.69, 41.00, 42.66, 43.00, 43.48 (2θ ± 0.2o 2θ) and Gallic acid showed peaks at 14.36, 16.01, 16.40, 18.54, 19.02, 19.69, 23.21, 23.97, 24.77, 25.21, 25.52, 27.54, 29.02, 30.78, 31.92, 34.18, 35.97, 36.36, 37.22, 37.40, 38.73, 42.20, 44.03, 44.40, 44.68, 45.07 (2θ ± 0.2o 2θ).
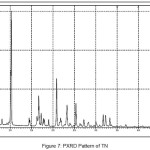 |
Figure 7: PXRD Pattern of TN
|
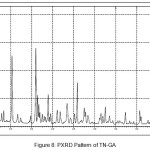 |
Figure 8: PXRD Pattern of TN-GA |
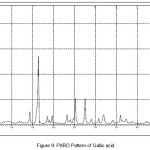 |
Figure 9: PXRD Pattern of Gallic acid
|
Thermal Analysis
The newly obtained solid forms of pharmaceutical compounds with potential biological activity2 are identified by thermal analysis. The purity of the solid phase is usually indicated by a sharp melting endotherm in differential scanning calorimetry (DSC). The observation of dissociation/decomposition and/or phase changes of the solid forms upon heating is indicated by endotherm/exotherm in DSC thermogram. The DSC data of various TN-salts/molecular salts is depicted in Table 3. The crystalline nature of TN and TN-PTSA is indicated by the sharp endothermic peak6 in the corresponding DSC endotherm graphs (Figure X, XI). For TN, single sharp endothermic peak is observed at 127.44oC with heat of process of160.7 J g-1, while the DSC curve of TN-PTSA (endotherm) is observed at 184.20oC with heat process of 100.0 J g-1. In principle, a higher melting point of the solid form indicates a more stable compound. Furthermore, TN-PTSA, TN-OXA and TN-AA exhibited sharp endothermic peaks (Figure XI, XII, XIII) while some of the TN-Hydroxy benzoic acids and TN-HCl exhibited broad endotherm peaks (a brief explanation for these endotherm peaks is given in Table 3).
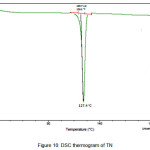 |
Figure 10: DSC thermogram of TN
|
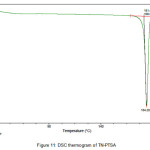 |
Figure 11: DSC thermogram of TN-PTSA
|
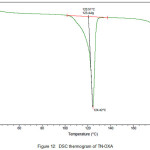 |
Figure 12: DSC thermogram of TN-OXA
|
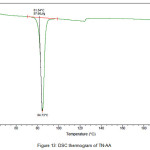 |
Figure 13: DSC thermogram of TN-AA
|
Table 3: Melting points of (oC) TN-salts/molecular salts;
|
Compound |
m.p of (oC) conformer |
m.p of (oC) salts / molecular salts |
Characteristic observations |
|
*TN |
– |
– |
— |
| TN-HCl |
– |
165.7 172.5 |
Two broad endothermic peaks, indicative of melting followed by decomposition |
| TN-PTSA |
106-107 |
181.4 |
Sharp endothermic peak / Tonset |
| TN-OXA |
189-191 |
120.5 |
Sharp endothermic peak/ Tonset |
| TN-BA |
122.4 |
84.3 106.2 |
Two broad endothermic peak corresponding to heat of de-hydration with loss of non-bounded water molecule followed by melting |
| TN-PBA |
214.5 |
125.8 135.6 182.9 |
Three endothermic peaks, corresponding to heat of de-hydration with loss of bounded water molecule, TN-PBA melting and decomposition |
| TN-DBA |
197-200 (dec) |
85.99 201.1 |
Two endothermic peaks, with loss of non-bounded water molecule followed by melting/decomposition |
| TN-GA |
251-252 |
86.3 115.0 |
Two broad endothermic peak corresponding to heat of de-hydration with loss of non-bounded water molecule followed by melting |
| TN-EBA |
171-172 |
110.8 121.5 |
Broad endothermic peak corresponding to heat of de-hydration with loss of bounded water molecule and decomposition |
| TN-VA |
211.5 |
109.1 117.1 124.3 |
Broad endothermic peak corresponding to heat of de-hydration with loss of bounded water molecule, melting and decomposition |
| TN-AA |
92.5-93.0 |
81.5 |
Sharp endothermic peak / Tonset |
* m.p. of API: 127.4oC
Solubility
In order to achieve the desired product specifications and bioavailability22, 23 of new solid phases (polymorphs, salts, molecular salts, cocrystals), it is important to understand and control transformation of new solid phases through solubility experiments. Aqueous solubility profiles of TN and corresponding salts/molecular salts are tabulated in Table 4. In our experiments, the following solubility trend was observed, the solubility of TN (compound 1) is 3.7 mg /mL, TN-HCl (compound 2) is 321.2 mg/mL and TN-PTSA (compound 3) is 184.2 mg /mL. These results clearly indicates enhancement of solubility by 86.8 folds and 49.7 folds respectively when compared to TN. In case of the TN-carboxylic acids series, the solubility of TN-GA (24.8 mg/mL) and TN-OXA (24.3 mg/mL) is 6.7 times of TN, while the solubility of remaining TN-hydroxybenzoic acids such as TN-BA, TN-AA,TN-PBA,TN-VA,TN-DBA, TN-EBA is 3.7 mg/mL, 3.9 mg/mL, 4.6 mg/mL, 5.1 mg/mL,8.7 mg/mL and 8.7 mg/mL respectively. In general, in case of TN-hydroxybenzoicds the solubility range varied between 1 to 2.35 fold when compared to TN.
Table 4: Solubility profile of TN-salts/molecular salts
|
Compound No |
Solid forms |
Aqueous solubility of salts/molecular salts (mg/mL) |
Conformers |
aAqueous solubility of conformers (mg/mL) |
|
1 |
TN |
3.7 |
— |
— |
|
2 |
TN-HCl |
321.2 |
— |
— |
|
3 |
TN-PTSA |
184.2 |
Para-toulenesulphonic acid (PTSA) |
670 |
|
4 |
TN-OXA |
24.3 |
Oxallic acid (OXA) |
143 |
|
5 |
TN-BA |
3.7 |
Benzoicacid (BA) |
3.4 |
|
6 |
TN-PBA |
4.6 |
para-hydroxy benzoicacid(PBA) |
5.0 |
|
7 |
TN-DBA |
8.7 |
3,4-dihydroxy benzoicacid (DBA) |
18.2 |
|
8 |
TN-GA |
24.8 |
3,4,5-trihydroxy benzoicacid (GA) |
11.9 |
|
9 |
TN-EBA |
8.7 |
3,4,5-trimethoxy benzoicacid (EBA) |
— |
|
10 |
TN-VA |
5.1 |
3-methoxy-4-hydroxy-benzoicacid (VA) |
1.5 |
|
11 |
TN-AA |
3.9 |
Anacardic acid (AA) |
— |
a the solubility data of the conformers taken from https://pubchem.ncbi.nlm.nih.gov/
Biology Studies
Antibacterial Evaluation
The antibacterial evaluation results of compounds 1-11 (TN salts/molecular salts) is presented in Table-5. The zone of inhibition was measured in mm. From table-1, it is interesting to observe that among the various bacterial strains (viz., Escherichia coli, Staphylococcus aureus, Pseudomonas aeruginosa and Bacillus subtilus), Bacillus subtilus (MTCC 441), exhibited pronounces antibacterial activity towards the TN salts/molecular salts (compounds 1-11). Within the series of these compounds, TN-PTSA and TN-EBA exhibited good antibacterial activity (zone of inhibition: 35-36 mm) while TN-HCl, TN-BA, TN-PBA, TN-DBA, TN-GA, TN-VA exhibited moderate antibacterial activity (zone of inhibition: 33-34 mm) and TN-HCL, TN-OXA and TN-AA displayed weak antibacterial activity when compared to the standard antibiotic drug Streptomycin (zone of inhibition: 28-40 mm). In case of Staphylococcus aureus, TN, TN-EBA exhibited good antibacterial activity (zone of inhibition: 27-30 mm), while the compounds TN-HCl, TN-PTSA, TN-BA, TN-PBA, TN-DBA, TN-GA exhibited moderate antibacterial activity (zone of inhibition: 23-24 mm) and the remaining compounds displayed weak antibacterial activity (zone of inhibition: 14-18 mm). In case of Escherichia coli (MTCC 2692) and Pseudomonas aeruginosa (MTCC 2453), most of the TN salts/molecular salts displayed moderate to weak antibacterial activity.
Table 5: Results of Antibacterial Bioassay of Compounds TN-salt/molecular salts 1-11 (at concentration 30 μg/mL in DMSO)
|
Compound |
Gram negative bacteria |
Gram positive bacteria |
||
|
Pseudomonas aeruginosa |
Escherichia coli |
Staphylococcus aureus |
Bacillus subtilus |
|
|
Zone of inhibition |
||||
|
1 (TN) |
15 |
20 |
30 |
30 |
| 2 (TN-HCl) |
22 |
23 |
23 |
34 |
| 3 (TN-PTSA) |
19 |
19 |
24 |
35 |
| 4 (TN-OXA) |
0 |
15 |
18 |
30 |
| 5 (TN-BA) |
20 |
19 |
24 |
34 |
| 6 (TN-PBA) |
24 |
23 |
23 |
34 |
| 7 (TN-DBA) |
21 |
20 |
23 |
34 |
| 8 (TN-GA) |
14 |
19 |
23 |
33 |
| 9 (TN-VA) |
17 |
20 |
18 |
34 |
| 10 (TN-EBA) |
25 |
21 |
27 |
36 |
| 11 (TN-AA) |
15 |
13 |
14 |
24 |
| Streptomycin |
25 |
31 |
38 |
40 |
Anti-Inflammatory Activity
Compounds i.e., TN salts/molecular salts at 20 mg/Kg po (Diclofenac sodium was used as s a reference drug at a dosage of 10 mg/Kg po) were tested for ant-inflammatory activity in the carrageenin induced paw edema model and the results are summarized in Table 6. Compounds 1-11 (3rd hour) showed 31.8%, 39.4%, 46.4%, 44.3%, 37.3%, 49.3%, 44.4%, 38.6%,45%, 43.6% and 50.7% ant-inflammatory activity, respectively, whereas standard drug exhibited 67% activity. The most potent compounds were TN-PTSA,TN-HCl,TN-DBA with ant-iinflammatory activity ranging from 45 to 50 % at a dose of 20 mg/Kg po. Within these three potent compounds, compound TN-PTSA was observed to have nearly equivalent ant-inflammatory activity compare to Tinidazole at a dose of 20 mg/Kg po, while tinidazole showed moderate anti-inflammatory activity compared to the standard drug (Diclofenac sodium was used as s a reference drug with the dosage,10 mg/Kg po).
Analgesic Activity
Compounds i.e., TN salts/molecular salts (1-11) at 20 mg/Kg po (Morphine was used as s a reference drug at a dosage of 10 mg/Kg po) were tested for analgesic activity was assessed by thermal hot plate method and the results are summarized in Table 7. Thermal pain model is useful for study of the central mechanism of analgesic activity of drugs. Compounds 1-11 (120 min) showed 75.4%, 78.5%, 75.4%, 75.8%, 42.8%, 86.3%, 83.2%, 71.5%, 60.4%, 66.6% and 94.7% analgesic activity, respectively, whereas standard drug exhibited (morphine) 97.3% activity. The most effective compounds were TN-PBA, TN-PTSA, TN-VA with analgesic activity ranging from 78 to 86 % at a dose of 20 mg/Kg po. Within these three potent compounds, TN-PTSA (86%) was observed to have nearly equivalent analgesic activity compare to Tinidazole at a dose of 20 mg/Kg po, while tinidazole showed a moderate analgesic activity compared to the standard drug (morphine as a reference drug at a dosage of 10 mg/Kg po).
Table 6: Anti-inflammatory activity evaluation of TN salts/molecular salts
|
Compounds |
Percentage of inhibition at 1st hour | Percentage of inhibition at 2nd hour |
Percentage of inhibition at 3rd hour |
|
Tinidazole |
35.78 | 42.22 | 50.70 |
| TN-HCl | 17.85 | 39.11 | 45.07 |
| TN-PTSA | 25.00 | 37.77 | 49.29 |
| TN-OXA | 16.07 | 36.88 | 43.66 |
| TN-BA | 21.42 | 23.33 | 31.83 |
| TN-PBA | 23.21 | 24.44 | 39.43 |
| TN-DBA | 14.20 | 26.66 | 46.47 |
| TN-GA | 19.64 | 26.66 | 44.36 |
| TN-EBA | 28.57 | 31.11 | 37.32 |
| TN-VA | 32.14 | 40.00 | 44.40 |
| TN-AA | 37.85 | 31.11 | 38.60 |
| Diclofenac sodium | 46.42 | 57.77 | 67.32 |
Table 7: Analgesic activity evaluation of TN-salts/molecular salts
|
Compounds |
Analgesic activity (%) at 30min |
Analgesic activity (%) at 60min |
Analgesic activity (%) at 120min |
|
Morphine |
74.65 | 90.41 | 97.30 |
|
Tinidazole |
66.17 | 90.44 | 94.11 |
|
TN-HCl |
34.45 | 47.55 | 60.40 |
|
TN-PTSA |
58.82 | 79.02 | 86.30 |
|
TN-OXA |
42.75 | 60.14 | 66.66 |
|
TN-BA |
29.83 | 57.93 | 75.41 |
|
TN-PBA |
50.00 | 76.38 | 78.50 |
|
TN-DBA |
55.65 | 73.91 | 75.40 |
|
TN-GA |
71.46 | 73.38 | 75.80 |
|
TN-EBA |
9.73 | 32.23 | 42.80 |
|
TN-VA |
68.32 | 76.59 | 83.23 |
|
TN-AA |
44.81 | 62.58 | 71.50 |
Experimental Section
Materials and Methods
Materials
Tinidazole is obtained from Sigma Aldrich, India and the purity of this drug is > 99.5 %. The solvents used in the study are of analytical grade. All the solvents used were purchased from Sigma-Aldrich.
Preparation of TN-Salts/Molecular salts: The TN salts/molecular salts was prepared by grinding an equimolar mixture containing 200 mg (1 mmol) of TN and 1mmol of corresponding carboxylic acids/PTSA wetted with few drops of water was manually grounded in an agate mortar for 100 minutes until a dried powder was obtained.
Powder X-ray diffractometry (PXRD): The powder X-ray diffraction pattern was measured with an X-ray diffractometer (Model RINT Ultima, Rigaku Denki). The conditions of measurement were as follows: target Cu, monochrometer graphite, voltage 45 kV and current 40 mA, with a scanning speed of 1°C/minute. Approximately 200 mg of sample were loaded into the sample holder.
Differential Scanning Calorimeter (Dsc)
DSC thermograms were obtained by a differential scanning calorimeter (Model Q100, TA instruments). The measurements were made using aluminium sample pan, using ~ 2-10 mg samples under nitrogen atmosphere, at a scanning speed of 2°C/minute.
Thermo Gravimetric Analysis (TGA)
Thermo gravimetry (TG) curves were obtained with a thermo gravimeter (Model Q500, TA instruments). The measurements were made using a 50 mg platinum pan (sample weight about 10 mg) under nitrogen atmosphere at a scanning speed of 2 °C/minute. Mass loss (%) was calculated based on the mass of the original sample.
Karl Fischer Titration (KFT)
Water content (% w/w) of the samples (200 mg) was determined by Karl Fischer titrimetry (716 DMS Titrino, Metrohm Limited, Switzerland). The instrument was calibrated by using deionized water, before sample analysis.
Fourier Transform Infrared Spectroscopy (FT-IR)
FT-IR spectra were recorded on a Bomem MB-120 Infrared spectrometer. Spectra over a range of 500 to 5000 cm-1 with a resolution of 1 cm-1 (32 scans) were recorded using KBr pellets. For diffuse reflection analysis, samples weighing approximately 2 mg were mixed with 200 mg KBr by means of an agate motor and pestle, and placed in sample cups for fast sampling.
Aqueous Solubility Measurement by UV Spectrophotometer
The absorbance values for TN and various organic acids in deionised water at different times were detected by a μDISS Profile apparatus. The measurement of solubility was carried out at 320 nm, where the organic acids have no absorption and the concentrations of these salts/molecular salts were calculated by means of a standard curve. In a typical experiment, 10 mL of aqueous medium was added to a flask containing 1mg sample, and the resulting mixture was stirred at 25oC and 400 rpm.
Antibacterial Bioassay
The investigated compounds 1-11 (TN salts/molecular salts) were tested against Gram positive strains of (i) Staphylococcus aureus (MTCC 902) and (ii) Bacillus subtilus (MTCC 441) and Gram negative strains: (iii) Escherichia coli (MTCC 2692) and (iv) Pseudomonas aeruginosa (MTCC 2453) at concentrations of 30 μg/mL, using agar well diffusion method reported by us recently6.
Ant-Inflammatory Activity
Carrageenan induced inflammatory rat model24 is a standard model system for experimentation on acute inflammatory conditions. Studies were carried out using adult wistar rats weighing between 150-200g. Rats were maintained under standard laboratory conditions (temperature 25 ± 2°C) with normal daily cycle (12/12h). The rats were acclimatized to laboratory condition for 10 days before commencement of experiments. The study was duly approved by the Institutional Animal Ethical Committee (IAEC) of CPCSEA (Committee for the Purpose of Control and Supervision of Experiments on Animals). The animals were starved overnight. Test drugs (TN-salts, 20 mg/kg i.p). While diclofenac sodium (standard drug) at dose of 10 mg/kg were administered orally using gastric canula 30 min before the carrageenan injection in sub plantar region of left hind paw. Paw edema was induced by injecting 0.1 ml of 1% w/v carrageenan suspended in 1% CMC into sub-plantar tissues of the left hind paw of each rat. The degree of paw circumference of all the groups was measured (in millimeters) using a vernier caliper after 60,120,180 min of carrageenan injection. Anti-inflammatory activity was calculated as percentage inhibition of edema in the animals treated with under test in comparison to the carrageenan control group. The percentage (%) inhibition of edema is calculated using the formula.
Percentage of inhibition = To−Tt / To ×100
Where Tt is the thickness of paw of rats of test drugs at corresponding time and To is the paw thickness of rats of carrageenan control group at the same time.
Analgesic Activity
Evaluation of analgesic activity of different compounds was carried out on the wistar rats. Rats of both sexes weighing 150-200g randomly grouped into 13. Each group consists of 6 rats, animals fasted for 12 hours with adequate clean water provided ad libitum. Laboratory maintained at standard conditions (temperature 25 ± 2°C) with normal light dark cycle of 12h. The rats were acclimatized to laboratory condition for 10 days before commencement of experiments. The experimental protocol was duly approved by the Institutional Animal Ethical Committee with the number I/IAEC/LCP/026/2016 ♂ or ♀. Animals were treated with different test drugs of TN-salts 20mg/kg per oral (p.o). and morphine (standard drug) 10 mg/kg (intra peritoneal) i.p. Note the reaction time of animals on the thermal hot plate of 55 ± 1°C at 30, 60 and 120 min. Pain reaction time (PRT) was determined with a stop watch. The response to pain stimulus are jumping, raising and licking of hind foot. The cut off time was fixed for 15 seconds. The percent increase in reaction-time (as index of analgesia) was calculated at each time interval. The percentage (%) analgesic activity is calculated using the formula
Percentage analgesic activity = La-Lb/Lb x100
Where La is the latency time after treatment with drug and Lb is the latency time before treatment with drug
Conclusions
In summary, the new solid forms i.e salt/molecular salts of Tinidazole (compounds 1-11) were prepared and characterized by 1H NMR, IR, XRD and DSC studies. Solubility of TN-HCl showed 86.8 folds and TN-PTSA showed 49.7 folds enhancement when compared to TN. TN-PTSA exhibited significant antibacterial activity, anti-inflammatory activity and analgesic activity when compared to TN and TN-Hydroxybenzoic acids. Among the TN-Hydroxy benzoicacids, TN-EBA exhibited good antibacterial activity, TN-DBA exhibited good anti-inflammatory activity and TN-VA exhibited considerably good analgesic activity when compared to TN. The enhancement in the above tested activities demonstrates that the pharmaceutical salt of Tinidazole with the p-Toluenesulfonic acid (TN-PTSA) can be an alternative substitute to Tinidazole and shows the potential to be developed in an oral formulation with improved solubility and bioavailability compare with the poor water soluble TN.
Acknowledgement
Authors thank the management Lalitha college of pharmacy for supporting the biological evaluation studies during the course of the work
References
- https://medlineplus.gov/druginfo/meds/a604036.html.
- Hollo, B.; Rodic, M.V.; Vojinovic-Jesic, L.S.; Zivkovic-Radovanovic, V.; Vuckovic´,G.;Leovac, V.M.; Me´sza´ros Sze´cse´nyi, K. J Therm Anal Calorim. 2013.
- Brittain, H.G. Polymorphism in pharmaceutical solids, vol. 192. 2nd ed. New York: Informa Healthcare; 2009.
- Lu, J. Afr J Pharm Pharmacol. 2012, 6,581.
- Braga, D.; Grepioni, F.; Maini, L.;Polito, M. Struct Bond, 2009,132, 25.
- Patnala, S. R. C. M.; Khagga, M.; Bhavani, R.; Bhavani, V. Orient J Chem. 2017, 33, 490.
- Aakeröy, C. B.; Fasulo, M. E.; Desper. J. Mol.Pharmaceutics. 2007, 4, 317.
- Sarma, B.; Nath, N. K.; Bhogala, B. R.; Nangia, A. Cryst. Growth Des. 2009, 9, 1546.
- Childs, S. L.; Stahly, G. P.; Park, A. Mol. Pharmaceutics. 2007, 4, 323.
- Kawase, M.; Motohashi, N.; Kurihara, T.; Inagaki, M.; Satoh, K.; Sakagami, H. Anticancer Res. 1998, 18, 1069, and references therein.
- Bipul, Sarma.; Naba K Nath.; Balakrishna R. Bhogala,; Ashwini Nangia. Crystal Growth & Design. 2009,9,1546.
- Sarma, B.;, Chen, J.; His, H.Y.; Myerson, A.S. Korean J Chem Eng. 2011,28,315.
- Ivanova, B.; Spiteller, M. Spectrochim Acta A. 2010,77, 849.
- Silverstein, R. M., Webster, F. X. Spectrometric Identification of Organic Compounds, 6th ed.; John Wiley & Sons: Singapore, 2004.
- Tjahjono, M.; Schreyer, M.K.; Guo, L.; Garland, M.; J Therm Anal Calorim. 2012, 108, 361.
- Ratajczak, H.; Orville-Thomas, W. J. Molecular interactions; J. Wiley: Chichester [Engl.], New York, 1980.
- Lehtonen, O.; Hartikainen, J.; Rissanen, K.; Ikkala, O.; Pietila, L. O. J. Chem. Phys. 2002, 116, 2417.
- Steiner, T. Angew. Chem., Int. Ed. 2002, 41, 49.
- Majerz, I.; Malarski, Z.; Sobczyk, L. Chem. Phys. Lett. 1997, 274, 361.
- Aakeroy, C. B.; Hussain, I.; Desper, J. Cryst. Growth Des. 2006, 6, 474.
- Boenigk, D.; Mootz, D. J. Am. Chem. Soc. 1988, 110, 2135..
- Nehm, S. J.; Rodrıguez-Spong, B.; Rodrıguez-Hornedo, N. Cryst. Growth Des. 2006, 6, 592.
- Good, D. J.; Rodrıguez-Hornedo, N. Cryst. Growth Des. 2009, 9, 2252.
- Winter, C. A.; Risley, E. A.; Nuss, G. W. Proc. Soc. Exp. Biol. Med. 1962, 111, 544.

This work is licensed under a Creative Commons Attribution 4.0 International License.
![]()
A New Edition of Web of Science
Journal Impact Factor
2022: 0.5
Five Year: 0.8
Journal is Indexed in

Cabells Whitelist
![]()


