Surface Enhanced Raman Spectra and Theoretical Study of an Organophosphate Malathion
Asenath Benitta T1, Sudhir Kapoor2, Sheela Christy R1, Isac Sobana Raj C1 and Thampi Thanka Kumaran J3
1Nesamony Memorial Christian College, Marthandam, Tamilnadu, India.
2Radiation and Photochemistry Division, Bhabha Atomic Research Centre, Mumbai 400085, India.
3Malankara Catholic College, Mariagiri, Kaliyakavilai, Pin - 629153, Tamilnadu, India.
Corresponding Author E-mail: tasenathbenitta@yahoo.co.in
DOI : http://dx.doi.org/10.13005/ojc/330223
Article Received on : January 27, 2017
Article Accepted on : March 25, 2017
Surface Enhanced Raman Scattering (SERS) is an established technique for the rapid and sensitive analysis of chemicals, pesticides and pharmaceuticals. The aim of this work is to develop sensitive and cost effective SERS substrates for pesticide detection using modified mirror reaction and physical deposition method. The prepared substrates were examined using Field Emission Scanning Electron Microscope (FESEM). The prepared slides were then used to detect an organophosphate pesticide, Malathion. The available simple geometry of Malathion was optimized using 6-311++G(d,p) basis set of Gaussian 09 software. The experimental Raman spectra, Surface Enhanced Raman spectra and theoretically computed wavenumbers are compared and the results are presented briefly.
KEYWORDS:Malathion; FESEM; modified mirror reaction; nanocluster deposition
Download this article as:| Copy the following to cite this article: Benitta A. T, Kapoor S, Christy S. R, Raj I. S. C, Kumaran T. T. J. Surface Enhanced Raman Spectra and Theoretical Study of an Organophosphate Malathion. Orient J Chem 2017;33(2). |
| Copy the following to cite this URL: Benitta A. T, Kapoor S, Christy S. R, Raj I. S. C, Kumaran T. T. J. Surface Enhanced Raman Spectra and Theoretical Study of an Organophosphate Malathion. Orient J Chem 2017;33(2). Available from: http://www.orientjchem.org/?p=31407 |
Introduction
Wrong agricultural habits have caused an adverse effect to human health and environment because toxic and biologically harmful substances are used as insecticides [1]. Insecticides used to increase the yield in agriculture are sometimes pollutants. Organophosphate pesticides are compounds of toxic agents used as insecticides in several Asian countries. They cause harmful effects to human life, such as irritation to eyes, sensory disturbances and respiratory depression. Due to the environmental concerns related with the excess accumulation of pesticides in food products and their toxic effects, a focus on insecticide detection at trace concentration is essential. A number of faster and sensitive detection systems for the identification and analysis of insecticides is available in literature [2-4]. The earlier methods for insecticide detection based on gas chromatography, are time consuming, complex and labor intensive with a possibility of incomplete assessment due to limited database mapping. They also require expensive and bulky equipment, and hence are not portable. All these are overcome by SERS which has several advantages over other spectroscopic techniques due to its accuracy, portability and sensitivity.
Surface Enhanced Raman Spectroscopy is proven to be a powerful tool for chemical and biomolecule detection. More interest in using SERS technique is shown in the analysis of food contaminants, chemical additives and pesticide residues. Compared to the conventional chromatographic procedures, simple sample preparation and detailed analysis can be achieved by SERS. With the advancements in nanotechnology, more sensitive and reliable SERS substrates are fabricated. Noble metal nanostructures or nanoparticles provide enormous enhancement to the Raman scattering process. A large magnitude of enhancement is attained which places the sensitivity of SERS to a higher level, compared to the sensitivity of fluorescence based detection.
A compact Raman spectroscopy system, using silver nanorod film fabricated by magnetron sputtering is already in use for field portable pesticide detection [5]. The obtained results specify a sensitive detection for the trace organic analysis of toxic chemical agents. It has been reported that nanoparticles of gold and silver in solution state, are effective systems for the removal of two common pesticides (Chlorpyrifos and Malathion) from water [6]. The time dependent removal of these pesticides from water has been monitored by UV-Visible spectroscopy and the adsorption of pesticides on nanoparticles have been confirmed with infrared spectroscopy. This method provides a new technology for drinking water purification, particularly by using silver nanoparticles.
A new format of apta-sensing based on polymer gold nanoparticle for SERS detection of Malathion has already been performed [7]. A rapid, simple and eco-friendly method using micro Raman spectroscopy for the determination of pesticide residues of Dimethoate, Chlorpyrifos and Malathion on the surface of fruits has been reported [8]. Based on the results, it has been concluded that micro Raman spectroscopy can be utilized for the determination of pesticide residues on the surface of fruits.
This paper deals with the development and applications of SERS in the chemical analysis of food, mainly focusing on pesticides. The main objective in this work is to fabricate highly sensitive, reliable and cost effective SERS substrates using modified mirror reaction (MMR) and physical deposition by cluster deposition system (AgNC). The prepared substrates examined using FESEM were used to detect various concentrations of Malathion. Geometry optimization of Malathion was performed using 6-311++G(d,p) basis set of Gaussian 09 software [9] and the theoretical vibrational frequencies were simulated from the same software. The experimental Raman spectra, SERS and theoretically simulated Raman spectra are compared.
Experimental details
In the present study, the substrates were prepared chemically by modified mirror reaction. In brief, a fine brown precipitate of Ag2O was produced by adding 20 μL of 3.2 wt.% KOH solution in 18 mL of a 2 wt.% AgNO3 solution. The precipitate was dissolved by adding ammonium hydroxide (29.5%) drop by drop. Then 6 wt.% AgNO3 solution was added and the solution turned yellow. The solution became colourless on adding a drop of 6 wt.% ammonium hydroxide solution. Then 3 mL methanol, 10 μL 10 wt.% Na3P5O10, and 40 μL of 5 wt.% Na2HPO4 was added consecutively to form a yellow colloid. Finally, 6 mL 35 wt.% glucose was added, which yielded a colloidal solution. Glucose acts as a fixing agent. Nano particles form even in the absence of glucose.
The glass slides were cut in to the dimension of 7.5 cm x 2.5 cm and was cleaned with Piranha solution for few minutes or until the visible reaction of organic material with the solution stops. The Piranha solution is a mixture of three parts of concentrated H2SO4 and one part of H2O2 (29.5%) [3:1]. The glass slides were then rinsed with Milli Q water (resistivity 18.2 MΩcm). To clean the glass slides further, it was sonicated in propanol, acetone and Milli Q water and then dried under nitrogen gas. The cleaned glass slides were immersed in the colloidal suspension for 24 hours at room temperature to form Ag nano-film on them. The substrates were taken out and rinsed
with copious amount of Milli Q water and dried under nitrogen gas. These substrates were then heated for 3 hours at 2000 C in the vacuum oven kept inside the anhydrous conditions of an argon glove box by maintaining O2 and H2O level less than 0.1 ppm to remove oxidation product, if any.
Substrates of silver nano particles were also made by physical deposition of silver nano particles on glass slides. The Nanodep60 nanocluster deposition system from Oxford Applied Research UK produces nano particles of high purity and with practically no chemical contamination. This deposition system is based on the principle of inert gas phase condensation. In this deposition method, a silver plate is sputtered using a DC magnetron source and the sputtered silver atoms move in to the aggregation zone under an inert gas flow. The super saturated metal atoms while flowing through the inert carrier gas, nucleates and forms clusters of nanometer scale. The sputtering based cluster source can produce a large range of mean cluster sizes from 200 to 15000 atoms per cluster, and a wide variety of elements and alloys can be used as source materials.
The nanoclusters formed in the aggregation chamber are made to flow through an aperture into the deposition chamber where the glass slides are kept for deposition.. The deposition chamber is maintained at a slightly low pressure than the aggregation chamber by differential pumping. The distance between the substrate and aperture was approximately 55 cm. The base pressure achieved in the system before the start of deposition was 4×10 -7 milli bar and a working pressure of 5×10⁻⁵ milli bar was obtained during the aggregation gas (Ultra high pure Argon of 99.999% purity) flow where the flow rate was maintained at 100 sccm (standard cubic centimeter per minute). The current in the DC magnetron was held constant at 0.2 A and the power level was about 70 Watts
Results and Discussion
Surface Characterization
The morphology of Ag nanoparticles prepared by modified mirror method was examined using FESEM. It can be seen from the FESEM image shown in Fig. 1 that Ag nanoparticles of the order of 20 nm was obtained and distributed uniformly on the slides surface. The efficiency of the substrate was then tested using Crystal Violet (CV) solution. For this the CV was diluted in milli Q water by sequential dilution method and few drops were put over the prepared substrate using a micro pipette. SERS was recorded for the substrate with CV and the observed peaks were more or less similar to that reported in literature [10]. An attempt was made to deposit silver nanoparticles by physical deposition using cluster deposition system. It was made possible to get somewhat clean Ag particles over the substrate using this method. The FESEM of this substrate is shown in Fig. 2. It is seen from the FESEM image that the silver nano particles were of the order of 40 nm.
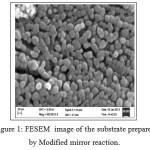 |
Figure 1: FESEM image of the substrate prepared by Modified mirror reaction. Click here to View figure |
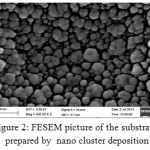 |
Figure 2: FESEM picture of the substrate prepared by nano cluster deposition Click here to View figure |
Vibrational Analysis
The vibrational frequencies were calculated using the triple split valence basis set 6-311++G(d,p) which includes diffuse and polarization functions.The vibrational bands assignments corresponding to the vibrational frequencies were elucidated by means of potential energy distributions (PEDs) using VEDA 4 program [11]. As SERS spectra is recorded in the range 400-2000 cm-1 only a partial vibrational analysis is presented. Optimized geometry of Malathion is shown in Fig 3. The vibrational frequencies, their assignments and the atoms involved are presented in Table 1.
The P=S bond shows a strong stretch band at 652 cm-1 in the reported Raman spectrum of Malathion [8]. A simulated wavenumber at 644 cm-1 supports this. The bands located at 1022, and 1733 cm-1 are due to C-C stretching and C=O stretching [12]. Theoretical values for these vibrations are obtained at 1022 and 1783 cm-1 .
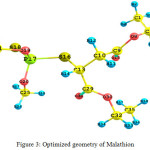 |
Figure 3: Optimized geometry of Malathion Click here to View figure |
Table 1: Vibrational frequencies and assignments of Malathion along with potential energy distribution (PED).
| Simulated wavenumber (cm-1) | SERS wavenumber (cm-1) | Expt. Raman [8] (cm-1) | Atoms | Assignments |
| 17831387133313291022644 | 1696134913451267– | 1733—1022652 | O15=C9H2-C1-H4H6-C5-C1H33-C32-C35C1-C5P17=S18 | C=O stretch (85%)H-C-H bend (14%)H-C-C bend (55%)H-C-C bend (64%)C-C stretch (76%)P=S stretch (77%) |
SERS samples were made for mM, µM and nM concentrations of Malathion. All SERS spectra were base line corrected. Base line is the spectrum in the absence of peaks. Base lines from data can be removed by subtracting a base line estimate from the data. This estimate can be constructed by fitting a function such as a low order polynomial, to the data which appears to contain no peaks. The base line areas of the data can be marked either automatically or manually and then connected with interpolation or fit with a function. The resulting curve fit results can be subtracted from the data. The difference contains the required data peaks. A comparative graph of the SERS spectra of Malathion at different concentrations after base line correction is shown in Fig 4
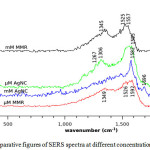 |
Figure 4: Comparative figures of SERS spectra at different concentrations of Malathion. Click here to View figure |
The enhancement of SERS bands in the range 1100-1700 cm-1 indicates that the atoms of Malathion has an interaction with the metal surface. Other bands corresponding to the region 400-1100 cm-1 are weakened in SERS. A sharp SERS band at 1582 cm-1 is seen to broaden for both modified mirror reaction and cluster deposition methods as it is seen in other works reported in literature [13]. At low concentration the atoms see different electric fields directly leading to the broadening of the spectrum.
A simulated wave number at 1783 cm-1 having a PED (potential energy distribution) of 85%
is due to C=O stretch according to VEDA 4 program. This band is obtainted as a medium strong band at 1733 cm-1 in the reported Raman spectrum [8]. A medium strong SERS band at 1696 cm-1 is assigned to C=O stretching vibration of Malathion with a large shift in frequency. Similarly two more SERS bands at 1349 and 1345 cm-1 due to H-C-H bending and H-C-C bending are very weak in the reported Raman spectrum. Simulated wavenumbers for these vibrations are at 1387 and 1333 cm-1 and these have a very low intensity with a shift of about 38 cm-1 and 12 cm-1 from SERS.
A strong Raman peak at 652 cm-1 is completly absent in SERS. But a simulated wavenumber at 644 cm-1 having a PED of about 77 % is assigned to P=S stretching. The same effect is also seen in the medium weak band at 1022 cm-1 due to C-C stretching present in the Raman spectrum but absent in SERS. This is seen in the simulated Raman spectrum at 1022 cm-1 and has a PED of
76 %. A simulated wavenumber of 1329 cm-1 is assigned to H-C-C bending of the methyl group
(numbered as 35, 36, 37, 38) and methylene group (numbered as 32, 33, 34). It has a PED of 64% .
This is obtained as a weak SERS signal at 1267 cm-1 corresponding to the H-C-C bending vibration. All the above results clearly shows that all these vibrations corresponding to the first 8 atoms of Malathion along with C=O stretching and atoms of the methyl and methylene group lie close to
the Ag substrate and sticks to it. By fixing two atoms on the XY plane, the optimized geometry of Malathion was rotated with the help of a C++ program such that two atoms corresponding to strong SERS signals had minimum negative value. It was found that the atoms H4, C9 were placed on the XY plane and sticks to the silver substrate.
The first element to be noted in a new SERS active substrate is sensitivity. From the SERS spectra it was found that the substrate exhibits good enhancement ability, and is highly sensitive. Another prime factor for SERS detection is reproducibility of the substrate. The SERS spectra was recorded for various concentration of Malathion by taking an average of ten randomly selected locations. This average is reproducible. Further the strong SERS signals suggest the presence of hot spots over the substrate, resulting in high reproducibility. It is pertinent to mention that the prepared substrates has a detection limit of 0.002 ppm. The sensitivity obtained from colloidal gold nanoparticles based on Lee-Meisel method for the detection of Malathion was 0.123 ppm [13].
NBO Calculations
The Natural Bond Orbital (NBO) calculation were performed using NBO 3.1 program [14] available in the Gaussian’09 software package, to understand various second-order interactions between the filled orbitals of one subsystem and vacant orbitals of another subsystem.
Natural Charge Analysis
The natural charge analysis on the electronic structure of Malathion describes the distribution of charges of the atoms in the molecule. Distribution of positive and negative charges are important in increasing or decreasing the bond length between atoms. In this molecule oxygen and carbon atoms exhibits negative charges, and are donors. Hydrogen atoms have positive charge, and they are acceptors. The various positive and negative charges obtained from natural charge analysis can be plotted in a graph and is shown in Fig 5. The highest positive charge is obtained as 1.596 e for P17
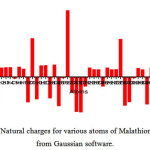 |
Figure 5: Natural charges for various atoms of Malathion obtained from Gaussian software. Click here to View figure |
Natural Bond Orbital Analysis
NBO analysis provides a basis for intermolecular charge transfer or conjugative interactions in molecular systems. For each donor NBO (i) and acceptor NBO (j), the stabilization energy E (2) associated with electron delocalization between donor and acceptor is estimated as
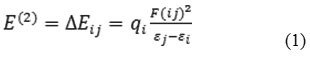
where qi is the ith donor orbital occupancy, εi and εj are diagonal elements and F (ij) is the off diagonal NBO Fock matrix element. Some electron donor, acceptor orbitals and the interacting stabilization energy resulting from second order micro disturbance theory have been reported [15, 16].
In NBO analysis large E (2) value shows strong intramolecular hyperconjugative interactions between the atoms of the molecule. The second order perturbation theory analysis of Fock matrix in NBO basis for Malathion is shown in Table 2. The lone pair interactions between n1(O8)→σ*(C9-O15), n1(O30)→σ*(C29-O31), n1(O20)→σ*(P17-S18) obtained as 34.39, 32.97 and 17.11 kJ/mol, respectively serves as an evidence for charge transfer interactions. The lone pair n1(O20) interaction with the anti bonding orbital (C25-H26) reveals the presence of C-H…O intramolecular hydrogen bonding.
Table 2: Second Order Perturbation Theory Analysis of Fock Matrix in NBO Basis.
|
Donor NBO (i) |
E.D (e) |
Acceptor NBO (j) |
E.D (e) |
E(2) kJ mol-1 |
|
n(1)O8 |
1.96220-0.57498 |
σ*(C9-O15) |
0.02337 0.60045 |
34.392 |
|
n(1)O20 |
1.94464-0.58311 |
σ*(P17-S18) |
0.080500.16051 |
17.112 |
|
n(1)O20 |
1.94464-0.58311 |
σ*(C25-H26) |
0.01022 0.39219 |
10.543 |
|
n(1)O30 |
1.96206 -0.57813 |
σ*(C29-O31) |
0.02249 0.60576 |
32.969 |
Homo-Lumo Analysis
Frontier molecular orbitals (lowest unoccupied molecular orbital (LUMO) and highest occupied molecular orbital (HOMO)) play an important role in the electric and optical properties of compounds [17]. The frontier orbital gap helps to understand the chemical reactivity and kinetic stability of the molecule [18]. The molecular orbitals and energies for HOMO and LUMO is shown in Fig 6. The HOMO presents a charge density localised around the phosphorothyl and carbonyl groups. LUMO is characterised by a charge distribution on ethyl, methyl and carbonyl groups present in the compound.
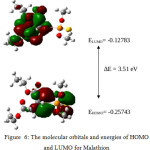 |
Figure 6: The molecular orbitals and energies of HOMO and LUMO for Malathion Click here to View figure |
The energy difference between the highest occupied molecular orbital and the lowest unoccupied molecular orbital in Malathion was found to be 3.51 eV. Low HOMO-LUMO energy gap value predicts the eventual charge transfer interactions taking place within the molecule and suggests that the molecule is bioactive.
The values of hardness and chemical potential of Malathion, can be evaluated from the HOMO and LUMO orbital energies using the following approximate expressions
![]()
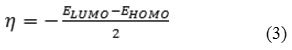
where μ is the chemical potential, and η is the hardness [19, 20]. To evaluate the electrophilicity of Malathion, the electrophilicity index, ω can be measured using the expression [21]
![]()
The theoretically calculated HOMO-LUMO energy gap , dipole moment , chemical potential and electrophilicity index are listed in Table 3
Table 3: Zero point vibrational energy, HOMO-LUMO energy gap, Chemical potential, Hardness and Electrophilicity index of Malathion.
|
Zero point vibrational energy (kJ/mol) |
Dipole moment (Debye) |
SCF energy (a.u) |
HOMO-LUMO energy gap (eV) |
Chemical potential ( μ )(eV) |
Hardness (η)(eV) |
Electrophilicity index (ω) (eV) |
|
784.27 |
5.759 |
-1981.996 |
3.510 |
5.2414 |
1.7632 |
7.790 |
Conclusion
Organophosphate pesticide Malathion was detected and analysed using the SERS substrates prepared by modified mirror reaction and physical deposition method. A much better basis set 6-311++G(d,p) including diffuse and polarization functions was used for Malathion using Gaussian 09 software. From the SERS spectra obtained for this pesticide, the prepared substrate was suitable as a highly sensitive SERS substrate and a detection limit of 0.002 ppm was obtained. Substrates prepared by modified mirror reaction and physical deposition are highly sensitive, reproducible and cost effective. The obtained results indicate that this method can be used for sensitive detection and analysis of other toxic chemical agents and pesticides.
References
- Database on Pesticides comsumption, Food and agriculture organization of the United nations, statistical analysis service, Rome, Italy 1950.
- Lehotay, S.J.; Son, K.A.; Kwon H.; Koesukwiwat U.; Fu W.; Mastovska K., Journal of Chromatography A, 2010, 1217 (16), 2548–2560.
CrossRef - Molto, J.C.; Pico Y.; Font G.; Manes D., Journal of Chromatography A, 1991, 555, 137-145.
CrossRef - Tonogai Y. ; Tsumura Y.; NakamuraY.; ItoY.; WatanabeY.;. Shiomi Y., Journal of Chromatography A, 1993, 639, 352-358.
CrossRef - Article in proceedings of spie- the International Society for Optical Engineering February 2011. http://www.researchgate.net/publication/260451739.
- Sreekumaran Nair A.; Pradeep T. Journal of Nanoscience and Nanotechnology, 2007, 7 .,1-7.
- Francisco Barahona; Cameron L. Bardliving; Adrienne Phifer; John G. Bruno and Carl A. Batt, Industrial Biotechnology, 2013, 9(1), 42-50.
CrossRef - Yande Liu; Tao Liu. Computer and Computing Technologies in Agriculture IV, Volume 347 of the series IFIP Advances in Information and Communication Technology 2010, 427- 434.
- Frisch M.J.; Trucks G.W; Schlegal H.B.; Scuseria G.E.; Robb M.A.; Cheesman J.R.; Zakrzewski V.G. ; Montgomerg, Jr. J.A.; Stratmann R.E. ;Burant J.C. ; Dapprich S.; Millam J.M.; Daniels A.D.; Kudin K.N.; Strain M.C. ; Farkas O.; Tomasi J. ;Barone V. ; Cossi M.; Cammi R.; Mennucci B. ; Pomelli C. ; Adamo C.; Clifford S. ; Ochterski, J. ; Petersson G.A.; Ayala P.Y.; Cui Q. ; Morokuma K. ; Rega N.; SalvadorP.; Dannenberg J.J.; Malich D.K.; Rabuck A.D.; Raghavachari K.; Foresman J.B.; Cioslowski J. ; Ortiz J. V.;. Baboul A.G; Stetanov B.B.; Liu G.; Liashenko A.; Piskorz P. ; Komaromi I. ; Gomperts R. ; Martin R.L. ; Fox D.J.;Keith T. ; Al-Laham M.A. ; Peng C.Y.; Nanayakkara A.; Challacombe M.; Gill P.M.W. ; Johnson B.; Chen W.; Wong M.W.; Andres J.L.; Gonzalez C. ; Head-Gordon M.; Replogle E.S.; Pople J.A. GAUSSIAN 98, Revision A 11.4, Gaussian, Inc, Pittsburgh PA, 2009.
- Botta R.; Upender G.; Sathyavathi R.; Narayana Rao D.; Bansal C. Materials Chemistry and Physics, 2013, 137, 699-703.
CrossRef - Jamroz M. H. Vibrational Energy Distribution Analysis VEDA 4, Warsaw, 2004.
- Quintas G.; Garrigues S.; M. de la Guardia, Talanta, 2004, 63 345-350.
CrossRef - Albuquerque C.D.L.; Poppi R.J. Analytica Chimica Acta 2015, 879, 24-33.
CrossRef - Glendening E.D.; Reed A.E.; Carpenter J. E.; Weinhold F. NBO Version 3.1, University of Wisconsin, Madison, 1998.
- James C. ; Amal Raj A.; Reghunathan R.; Hubert Joe I.; Jeya Kumar V. S. Journal of Raman Spectroscopy, 2006, 37, 1381-1392.
CrossRef - Liu J.N. ; Chen Z.R.; Yuan S.F. Journal of Zhejiang University Science B, 2005, 6, 584-589.
CrossRef - Fleming I. Frontier Orbitals and Organic Chemical Reactions, John Wiley & Sons, London, 1976.
- Kosar B.; Albayrak C. Spectrochimica Acta Part A, 2011, 78, 160-167.
CrossRef - Pearson R.G. ; Chemical Hardness, Wiley-VCH, Oxford, 1997.
CrossRef - Parr R.G.; Yang W. Density Functional Theory of Atoms and Molecules, Oxford University Press, New York, 1989.
- Parr R.G.; Szentpaly L.v. ; Liu S. Journal of the American Chemical Society, 1999, 121(9) 1922-1924.
CrossRef

This work is licensed under a Creative Commons Attribution 4.0 International License.
![]()
A New Edition of Web of Science
Journal Impact Factor
2022: 0.5
Five Year: 0.8
Journal is Indexed in

Cabells Whitelist
![]()


