Study of Ambient Air Quality Trends and Analysis of Contributing Factors in Bengaluru, India
Amrita Thakur
Department of Chemistry, Amrita School of Engineering, Bengaluru, Amrita Vishwa Vidyapeetham, Amrita University, India.
Corresponding Author E-mail: t_amrita@blr.amrita.edu
DOI : http://dx.doi.org/10.13005/ojc/330265
Presence of certain substances in air adversely affects human health, environment and climate. These chemicals are mainly added due to human activities. Maintaining air quality requires regular monitoring, identification of source of pollution and adoption of preventive measure. Bangalore a city in India has grown in size and population recently due to growth of IT industry. This rapid growth and related civic activity has affected its ecological services. The objective of this study is to identify air pollution trend in Bangalore and investigate the factors contributing towards it. Data for analysis has been obtained from state pollution control board website and has been used without any modification. Three criteria pollutants measured regularly and for longest period of time, sulphur dioxide (SO2), nitrogen dioxide (NO2) and respirable particulate matter (PM10) have been investigated for air quality analysis.
KEYWORDS:Air Pollution; Bengaluru; Transport
Download this article as:| Copy the following to cite this article: Thakur A. Study of Ambient Air Quality Trends and Analysis of Contributing Factors in Bengaluru, India. Orient J Chem 2017;33(2). |
| Copy the following to cite this URL: Thakur A. Study of Ambient Air Quality Trends and Analysis of Contributing Factors in Bengaluru, India. Orient J Chem 2017;33(2). Available from: http://www.orientjchem.org/?p=31619 |
Introduction
Accumulation of certain substances in the air which adversely affect the well being of human, plant, animals and the environment causes air pollution. These chemicals are added in many ways, for example pesticides, fumigants etc are released intentionally, hydrocarbons during fuel use and solvents escape when used (solvents etc). Some of these chemicals change their nature by reactions in atmospheric conditions. Quality of air is maintained naturally as these chemicals disperse soon after release. Recent problem of air pollution is actually arisen as the rate of addition of pollutants is much more than its removal.
Air is everywhere and so is its influence. Polluted air can adversely affect the human health, buildings, monuments, plants, ecosystems and the list is endless. Polluted air has been linked to climate as particulate matter absorb or reflect sun light and affect cloud formation and rainfall pattern of a place1. Its health impact has been reported worldwide. World Health Organization (WHO) studies has reported premature death of 3.7 million people world over in 2012 due to air pollution2 while in India positive association between air pollution and health impacts in cities like Delhi, Hisar and Hyderabad5 has been reported.
Every country has issued air quality guidelines for pollutants concentration in air for protecting public health from air pollution in a country. In India, Central Pollution Control Board(CPCB) in its notification 20096 has identified 12 criteria pollutants, which are particulate matter (PM10, PM2.5), sulphur dioxide, nitrogen dioxide, carbon monoxide, ozone, lead, benzene, ammonia, Benzo(a)Pyrene (BaP Particulate phase only), Arsenic and Nickel to be measured at national level through National Air Quality monitoring Program7 and for easy understanding of the pollution level by everybody CPCB has developed Exceedence Factor (EF) which is calculated by the formula shown by equation given below.
EF = Observed Annual Mean of Criteria Pollutants/Annual Standard For Respective Pollutant
Air quality can be low, moderate, high or critical based on the following criteria:
Critical pollution (C) : EF >1.5
High pollution (H) : EF ∈ [1.0-1.5]
Moderate pollution (M) : EF ∈ [0.5- 1.0]
Low pollution (L) : EF < [0.5- 1.0]
Study Area
Bengaluru, the cultural, educational, industrial and administrative capital of Karnataka, India is located between 12o59’north and 77o35’east longitudes and at an altitude of 900m above mean sea level. Its average rain fall is 1286.6mm and temperature variation is between 7.8oc and 38.9oc8. Its urban area has grown in 466% and decadal population growth by 51.39% 9 in past few decades. To accommodate such large population the city limits have expanded at the cost of nearby villages10 and illegal conversion of the green belt area11. Aim of this paper is to explore the changes in air quality in past ten years and the contributing factors. During this time period Bengaluru’s identity changed from Garden city to an important centre of IT industry.
Air Pollution Measurement in Bengaluru
Air pollutants are measured under national ambient air quality program (NAMP) by monitoring stations which are shown in Figure 1 on a regular basis and KSPCB publishes annual average of pollutants Sulphur dioxide (SO2), Nitrogen dioxide (NO2) and particulate matter with aerodynamic diameters less than 10 µm (PM10 or RSPM) in its website. The Exceedence Factor has been calculated by using these data from Equation 1 for six stations. These stations are selected as measurements for them are available for longest period of time (2006-15) and they also represent mixed urban [Yashwanthpur (YPR) and AMCO Batteries(AMCO)], industrial [Peenya, KHB and Graphite India(GI)] and sensitive area [Victoria Hospital(VH)].
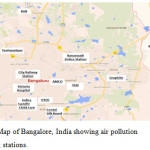 |
Figure 1: Map of Bengaluru, India showing air pollution monitoring stations.
|
Assessment of Air Quality Trend
Based upon the available data, the variations in SO2, NO2 and PM10, for the period 2006 – 20015 are shown in figure 2.
![Figure 2: Variation in NO2[2a], SO2[2b] and RSPM[2c] concentration in μg/m3 for the period of 2006 – 2015 Bangalore, India (graphs are based on data taken from the KSPCB website)](http://www.orientjchem.org/wp-content/uploads/2017/04/Vol33No2_Stud_Amri_fig22-150x150.jpg) |
Figure 2: Variation in NO2[2a], SO2[2b] and RSPM[2c] concentration in μg/m3 for the period of 2006 – 2015 Bengaluru, India (graphs are based on data taken from the KSPCB website) Click here to View figure |
Graphs represented in Figure 2(2a, 2b, 2c) which are based on data obtained from KSPCB indicate a decrease in sulphur dioxide levels for all monitoring stations since 2006. SO2 level has always been lower than the national standard value of 50 μg/m3 for all the stations under study and the Exceedence Factor has been found to be under 0.5, which reflects low level of SO2 in the air. Sensitive area Victoria hospital(VH), even if there is a decrease in the SO2 concentration has EF between 0.56 to 0.805 putting the air quality in moderate category as the standard SO2 concentration for a sensitive area is low (20 μg/m3)6.
The NO2 level on the other hand is relatively higher and has shown an increasing trend during the study period. CPCB annual mean standard for NO2 is 40 μg/m3 for residential and industrial area and 30 μg/m3 for sensitive area6. Data indicates that the NO2 level is still under limit with Exceedence Factor (EF) under moderate category for all the monitoring stations. VH, the sensitive area, has shown the EF between 1 and 1.5 in 2007-10 and 2014-15 respectively.
The concentration of RSPM (respirable suspended particulate matter) has been increasing during the study period. There is no regular pattern but for majority monitoring stations its concentration has crossed the standard of 60 μg/m36.
Analysis of Factors Contributing to Air Pollution
These data indicate that the air quality in Bengaluru is within acceptable limits set by CPCB but there is an increasing trend for NO2 and RSPM. It is important to understand the various factors contributing towards these air pollutants for better understanding of air quality and its future trend.
Air quality assessment, emission inventory and source apportionment study for Bengaluru city was conducted in 2010 by Tata Energy Research Institute12. According to this study major contributors of RSPM load in the air are road dust re-suspension and vehicular emission, nitrogen dioxide emission is due to emission from vehicle while Sulphur dioxide by DG (diesel generator) sets and vehicle movement. Data on pollution level recorded on Bharat Bandh (state of strike across India including Bengaluru) 5th July 2010 also supports TERI’s observation as there is a reduction of 50% NO2, 33.5% SO2 and 61% RSPM at AMCO batteries( Residential monitoring station) and 39% in NO2, 31% in SO2 and 72% in RSPM at Graphite India(Industrial monitoring station)13 from previous day. With 5.56 million registered vehicles in 2015, Bengaluru has shown101.34% increase vehicular population since 200614.
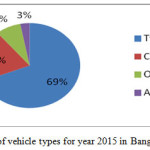 |
Figure 3: Share of vehicle types for year 2015 in Bengaluru. |
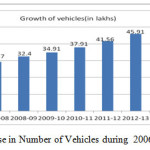 |
Figure 4 Increase in Number of Vehicles during 2006-15 in Bengaluru |
According to annual report published by Department of Transport Bengaluru, (Figure 3) two wheelers (69%) and privately owned cars (20%) make 90% of the total vehicular population. That is city has large number of non-transport vehicle which is indicative of two things – first the city has grown and people have to commute for their daily civic requirement and second the lack of efficient public transport as most people depend on their own transport for commutation. Future population growth under this situation will lead to more emission of SO2, NO2 and RSPM and the air quality of Bengaluru is expected to decrease.
Vehicles not only emit the above mentioned criteria pollutants but also other pollutants. Two wheelers especially with two stroke engines are known to emit significant amount of particulate matter along with un-burnt hydrocarbon. Emission of RSPM, hydrocarbon (HC) and carbon monoxide (CO) from Petrol two stroke engine driven two and three wheelers is 29%, 73% and 42% respectively15. This fact suggest that the concentration of hydrocarbon and carbon monoxide in air is higher as 69% Bengaluru’s vehicular population is two wheeler with majority of them having two stroke engine.
Even if the population of three wheelers are less (3% of vehicle population in the city), their contribution towards RSPM emissions cannot be ignored. Studies have indicated that a typical three-wheeler is driven 100 to 120 km per day for 360 days of the year and contributes 8% of total RSPM, 26% of HC and 15% of CO16. Adoption of CNG fuel in three wheelers would not have shown any improvement in emission as studies in Delhi after adoption of CNG has not indicated emission reduction17.
Pollution due to diesel cannot be ignored in Bengaluru as a large number of relatively older and diesel operated buses, trucks and light commercial vehicles (LCVs) are running on the city roads12. Like any other city in India number of diesel operated car has also increased in Bengaluru over past years. According to Retail Survey by Nielsen18 the utility vehicle/ car sector in India consumes 28.5% of diesel and we can consider that similar consumption trend is prevalent in Bengaluru also. Diesel exhaust is known to contain carbon monoxide, nitrogen oxides, sulfur oxides, hydrocarbons and unburned carbon particles (soot). Exhaust from diesel engines is considered to contribute to more than 50% of RSPM (PM10). Its contribution towards fine particulate matter with a diameter below 2.5 μm (PM2.5) and ultra-fine particles with a diameter below 0.1 μm, is even higher19. The increasing trend in NO2 can be correlated with the diesel consumption trend. Relation between vehicular emission and PM10 and PM2.5 and vehicular emission has also been reported by researchers in India20.
Pollution due to fuel adulteration cannot be ignored when the number of vehicle is more. Adulteration of fuel is known to increase the concentration of HC, CO, NO2, PM10 and smoke from the vehicular exhaust21. Adulteration of gasoline and diesel is indulged primarily due to the significant price difference between these fuels and the adulterant and is prevalent in India22 and Bengaluru is not an exception.
The observed decreasing trend in SO2 level can be attributed to adoption of Bharat Stage IV norms which is equivalent to Euro IV standards23 since 2010 for vehicles as well as fuel(less than 50 ppm sulphur). Another factor which might be responsible for reduction in SO2 concentration in air is its deposition as sulphate (TERI report has indicated presence of high sulphate concentration in PM1012). Adoption of Bharat Stage IV norms has also helped in controlling NO2 level as the catalytic converters in vehicles responsible for converting NO2 to N2 and O2 work efficiently in presence of low sulphur fuel.
Pollution from transport also depends on the condition in which vehicles are operated. Emission is known to be more when a vehicle is moving at slow speed or in idling conditions. Fast and uncontrolled urban growth in Bengaluru with poor infrastructure facility has adversely affected the mobility of vehicles. Mobility Indicators based on the aspects like congestion, mobility and accessibility of transport has declined in the city. The Bengaluru Mobility Indicators 2010-11 report indicates a decrease in indicators like congestion index, city bus supply index, para transit index and service accessibility index while an increase in travel time index and on street parking index from 2008 to 2011 which are indication of slow moving traffic24. The average traffic speed in the city is 15kmph and a slow moving traffic with frequent acceleration and breaking off burns more fuel and hence emit more pollutant.
Generator sets commonly used by hotels, schools, residential apartments etc in Bengaluru due to frequent power cuts, peak hour restrictions and maximum demand restrictions use diesel, kerosene and CNG as fuel. Studies have confirmed the presence of pollutants like particulate matter, methane, carbon monoxide and sulphur dioxide in high concentrations near generator sets25 Their numbers are increasing with the population increase and gap in demand and supply of power requirements.
Trend in RSPM is irregular and there are spurts of increase in its concentration for specific measurement locations in specific time which might be due to construction activity. Resettlement of road dust and construction activities like land clearing, digging, demolition, transportation of material etc increase RSPM level. Since adherence to the guidelines to prevent air pollution is not in practice at majority of construction sites which reflects in abnormal increase in RSPM level during construction. For example the observed increase in RSPM at the monitoring station KHB during 2011-13 was due to the road construction near new international airport was going on and the increase of PM10 in 2014-15 at YPR is due to ongoing metro rail project.
Conclusion
Except for RSPM, levels of other two pollutants (SO2 and NO2) are under control. Transport sector is the main contributor of air pollutants in Bengaluru. It is observed that the rapid expansion of city without development of proper infrastructure has led to increase in number of non transport vehicles, majority of them are two wheelers. These vehicles not only emit the RSPM, SO2 and NO2 but also HC and CO and their concentration in air is expected to have increased in the same proportion. Diesel consumption in vehicles and DG sets emits SO2 and particulate matter of all size. Since diesel consumption has increased, presence of particulate matter of size less than 2.5 and 1 μm is also expected to have increased which is a cause of concern. Adoption of Bharat Stage IV has helped in controlling the air pollution. High concentration of RSPM level due to construction activity can be managed if proper care is taken during construction.
References
- Ramanathan, V.; Crutzen, P. J.; Kiehl, J.T.; Rosenfeld, D. Aerosols Science, 2001, 294, 2119-2124.
- WHO. Ambient (outdoor) air quality and health. Fact sheet 2014 31.
- CPCB. Environmental Health Series: EHS/1/2008, Ministry of Environment & Forests, Govt. of India, 2008
- CPCB, Environmental Health Series: EHS/1/2008.
- Kaushik, C.P.; Ravindra, K.; Yadav, K.; Mehta, S.; Haritash, A.K. Environmental Monitoring and Assessment. 2006,122, 27-40.
CrossRef - Integrated Environmental Strategies India Program, USEPA, Washington DC, USA, 2004.
- The gazette of India, Extraordinary, Part III – section 4, 2009.
- Indian Meteorological Department, Meteorological centre, Bengaluru 2008.
- Census 2011.
- Venkataraman, M. Working Paper No: 464, Indian Institute of Management , Bengaluru 2013.
- Ravindra, A.; Venkataraman, M.; Narayan, E.; Masta D. Centre of Excellence in Urban Governance, Centre for Public Policy, Indian Institute of Management, Bengaluru, 2012.
- Air Quality Assesment for Bengaluru, TERI, 2010.
- KSPCB report on Bharat Bandh, 2010.
- Annual Administrative Report, Department of Transport and Road safety, Karnataka, India, 2015.
- Masami K.; Carter, B.; Jitendra S. The World bank, 2000.
- Environment Pollution (Prevention & Control) Authority for NCR, Proposal for emission controls on petrol two stroke engine driven two and three wheelers,1999.
- Narain, U.; Krupnick, A. Resource for future, Discussion Paper 07-06,2007.
- Nielsen, All India Study on Sectoral Demand of Diesel & Petrol, Petroleum Planning and Analysis Cell, Ministry of Petroleum and Natural Gas, Government of India, 2013.
- Gilman, P. EPA/600/8–90/057F. US Environmental Protection Agency, 2002.
- Shubhankar, B.; Ambade, B.; Singh, S.K.; Meshram, S.G.; Orient J Chem, 2016, 32(1), 523-532.
- Kalligeros, S.; Zannikos, F.; Stournas, S.; Lois, E.; Anastopoulos, G. J. Energy Conversion and Management, 2004, 3(4), 68-75.
- Centre for Science and Environment, Delhi, 2002.
- The gazette of India, Part II-section 3 sub-section (i), 2008.
- Bengaluru Mobility Indicators, Directorate of Urban Land Transport (DULT), Karnataka, India. 2011.
- Oguntoke, O.; Adeoye A. Indoor and Built Environment. 2016, 25, 1–13.

This work is licensed under a Creative Commons Attribution 4.0 International License.
About The Author
![]()
A New Edition of Web of Science
Journal Impact Factor
2022: 0.5
Five Year: 0.8
Journal is Indexed in

Cabells Whitelist
![]()


