Spectral Characterization and Vibrational Assignments of Ethyl 4-(3-(2,3-Dihydrobenzofuran-5-Carboxamido)Phenyl)-6-Methyl-2-Oxo-1,2,3,4-Tetrahydropyrimidine-5-Carboxylate by ab Initio Density Functional Method
1Department of chemistry, Government Arts College, C-Mutlur, Chidambaram-608102, Tamil Nadu, India.
2Centre for Functionalized Magnetic materials, Immanuvel Kant Baltic Federal University, Kaliningrad, Russia-234100.
3Centre for Research & Development, PRIST University, Vallam, Thanjavur-613403, Tamil Nadu, India.
Corresponding Author E-mail: drsmgac@gmail.com
DOI : http://dx.doi.org/10.13005/ojc/330216
Download this article as:
![]()
In the present investigation, then novel compound ethyl 4-(3-(2,3-dihydrobenzofuran-5carboxamido)phenyl-1,2,3,4-tetrahydro-6-methyl-2-oxopyrimidine-5-carboxylate(DFOC) were synthesized .The synthesized compound have been characterized by using UV-visible, FT-IR, FT-Raman,1H-NMR and C13NMR spectral studies. The harmonic vibrational frequencies, optimized molecular geometry have been carried out with the help of B3LYP density functional theory (DFT) method. The stability of the molecule was analyzed by means natural bond orbital analysis and delocalized π-π* interactions. Moreover, the frontier molecular orbital analysis, molecular electrostatic potential surface and several thermodynamic properties of DFOC were investigated using DFT calculations.
KEYWORDS:DFOC; NBO; NLO HOMO-LUMO and DFT
Introduction
Dihydropyrimidin-2-(1H)-ones plays a vital role in natural and synthetic organic chemistry. It have wide range of biological activities 1,2. Such as, anti-leishmanial3, anti-tuberculosis4, analgesic, anti-inflammatory5-7, antimicrobial8, antifungal9 anti-emetic10 and antitumor properties11. The nonlinear optical active molecules with π_conjugated backbones, electron donating electron withdrawing moieties are important class of materials in modern technologies, such as telecommunication and optoelectronics12, multiphoton microscopy13, Organic light-emitting diodes (OLED) 14, organic field effect transistors (OFET)15 and to achieve hierarchical self-assembly in “all-organic” photovoltaic devices16
Here, we report a synthesis a new nonlinear molecule ethyl 4-(3-(2,3-dihydrobenzofuran-5-carboxamido)phenyl-1,2,3,4-tetrahydro-6-methyl-2-oxopyrimidine-5-carboxylate(DFOC). The optimized molecular structure, FT-IR, FT- Raman freaquencies and NMR chemical shift values were analyzed using experimental and theoretical approach. The nonlinear optical behavior of the title molecule has been by the first hyperpolarizabilty components. The intramolecular charge transfer occurs from the donor-acceptors interactions are examined using Natural bond orbital analysis. In addition UV-Visible analysis, frontier molecular orbital energies (HOMO and LUMO), electronegativity (χ), hardness (η), Electrophilicity (ѱ) several thermodynamic properties, and molecular electrostatic potential maps (MEP) are investigated.
Computational Details
The theoretical calculation of DFOC were performed quantum chemical calculations of DFOC have been performed using Gaussian 03 program package utilizing DFT/ 6-31G(d,p) the B3LYP level of theory 17-19. By using VEDA4 program, FT-IR, FT-Raman frequencies are on the basis of potential energy distribution.20 The theoretically wavenumber were scaled down uniformly by a factor of 0.9608 for obtaining a decent agreement with experimental results.
Experimental
Synthesis of Ethyl1,2,3,4-Tetrahydro-6-Methyl-4-(3-Nitrophenyl)-2-Oxopyrimidine-5-Carboxylate
Ethanolic mixtures of 3-nitro-benzaldehyde (0. 6 mmol), ethyl acetoacetate (0. 9 mmol) and urea (0. 9 mmol) were stirred in Con. Hydrochloric acid in a RB. The reaction mixture was refluxed at 80oC for 12h. The thin layer chromatography was performed to check completion of the reaction. The crude content was cooled and poured into crust-ice, the obtained solid product were filtered and washed with ethanol. The crude product was recrystallized from absolute ethanol. Yield:73%, melting point = 218oC.
IR (KBr): ν ~ [cm-1] 3441,3356, 3240, 3105, 2962, 1703, 1649, 1633, 1H NMR (400 MHz, DMSOd6): δ = 1.1-1.08 (t, 3H, J = 7.07 Hz), 2.26(s, 3H), 4.01-3.94 (q, 2H, J = 7.1 Hz), 5.29-5.28 (d, 1H, J = 3.01 Hz), 7.64-7.62 (d, 1H, J = 7.8 Hz, ArH), 7.67-7.66 (d, 1H, J = 7.71 Hz, ArH), 7.69-7.67 (m, 1H, ArH), 8.11-8.07 (s, 1H, ArH), 8.13 (s, 1H, NH), 9.36 (s, 1H, NH), 13C NMR (75 MHz, DMSOd6): δ = 165.0, 151.7, 149.3, 147.6, 146.9, 132.1, 130.3, 122.9, 120.9, 98.2, 59.3, 53.4, 17.0, 13.9.
Reduction of Compound (I) to Ethyl1,2,3,4-Tetrahydro-6-Methyl-4-(3-Aminophenyl)-2-Oxopyrimidine-5-Carboxylate
The compound I is stirred with 10% Palladium on charcoal in equimolar quantity of ethanol with methanol and ethyl acetate (50%).The reaction mixture was stirred under hydrogen atmosphere for 12 h. Then the completion of reaction TLC monitoring, the reaction mixture was filtered. The filtrate was concentrated under reduced pressure resulting in a solid compound which was further purified by recrystallization. Yield: 73% melting point = 201oC.
IR (KBr): ν ~ [cm-1] 3441,3360, 3242, 3105, 2976, 1707, 1651, 1616, 1H NMR (400 MHz, DMSOd6): δ = 1.11-1.09 (t, 3H, J = 7.08 Hz), 2.21(s, 3H), 3.97-3.95 (q, 2H, J = 7.9 Hz), 4.98-4.97 (d, 1H, J = 3.04 Hz),5.03(s, 2H,-NH2)6.39-6.37(d, 1H, J = 7.03 Hz, ArH), 6.41-6.40 (d, 1H, J = 6.91 Hz, ArH), 6.43-6.42 (m, 1H, ArH), 6.93-6.91 (s, 1H, ArH), 7.59 (s, 1H, NH), 9.07 (s, 1H, NH), 13C NMR (75 MHz, DMSOd6): δ = 165.4, 152.1, 148.5, 147.6, 145.4, 128.6, 113.8, 112.8, 111.6, 99.4, 59.0, 54.0,17.1, 14.0.
Ethyl 4-(3-(2,3-Dihydrobenzofuran-5-Carboxamido)Phenyl)-1,2,3,4-Tetrahydro-6-Methyl-2-Oxopyrimidine-5-Carboxylate (III)
The compound(II) (0. 01mmol) was dissolved in DMF (10 ml) and added using O-(7-azabenzotriazol-1-yl)-N,N,N′,N′-tetrame thyluroniumhexa fluoro phosphate (HATU) (0.076mmol), N,N-Diiso-propyl ethylamine (DIEA) (0.11mol), 2,3-dihydrobenzofuran-5-carboxylic acid (0.01mmol) added at 0oC.The reaction mixture was stirred for 8h, then it was kept at room temperature for 4h. The completion of the reaction was monitor by TLC. The product mixture diluted with water, extracted with ethyl acetate and separated the organic layer, washed with water and brine solution. The organic layer was dried over unhydrous sodium sulphate and concentrated to produce crude solid which was purified by column chromatography eluting with 30-40%ethylacetate in hexane to obtained compound(III).Yield: 71%, melting point =158oC.
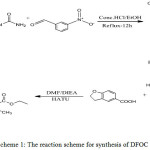 |
Scheme 1: The reaction scheme for synthesis of DFOC |
IR (KBr): ν~ [cm-1] 3369, 3277, 3226, 3015, 1701, 1643, 1H NMR (400 MHz, DMSOd6): δ = 1.1-1.08 (t, 3H, J = 7.07 Hz, C-15), 2.24 (s, 3H, C-12), 3.2 (t, 2H, C-29), 4.00-3.95 (q, 2H, J = 7.1 Hz, C-14), 4.63-4.59 (t, 2H, J = 8.72 Hz, C-30) 5.13-5.12 (d, 1H, J = 3.01 Hz, C-6), 6.94-6.86 (d, 1H, J = 8.6 Hz, ArH, C-21), 6.95-6.94 (d, 1H, J = 7.72 Hz, ArH,C-28), 7.27-7.23 (m, 1H, ArH, C-20), 7.84-7.63 (m, 3H, ArH, C-19, 27, 25), 7.85 (s, 1H, ArH, C-17), 7.94 (s, 1H, NH-3,), 9.16 (s, 1H, NH-5), 10.01 (s, 1H, NH-22). 13C NMR (75 MHz, DMSOd6): δ = 165.3, 165.0, 162.5, 151.9, 148.2, 145.3, 139.4, 130.5, 128.6, 127.8, 124.8, 121.5, 119.6, 118.2, 108.6, 108.3, 99.4, 71.9, 59.1, 54.2, 28.5, 28.3, 17.7.
Spectral Measurements
The FT-IR spectrum of the synthesized DFOC was measured in the 4000–400 cm−1 region at the spectral resolution of 4 cm−1 using on SHIMADZU FT-IR affinity Spectrophotometer (KBr pellet technique). The UV spectrum has been recorded with SHIMADZU- 1650 spectrophotometer (λmax nm) in spectral grade methanol solvent. NMR spectral studies were carried out using Bruker 300 MHz spectrometer, using TMS as an internal standard and DMSO-d6 as solvent and recorded at Indian Institute of Technology (IIT), Chennai.
Results and Discussion
Molecular geometry
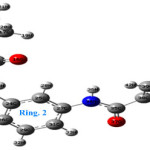
The optimized geometrical parameters of DFOC using DFT/B3LYP6-31 G(d,p) level of theory. The optimized structure of DFOC as shown in fig(1). The geometrical geometrical parameters such as bond length, bond angle and dihedral angle are listed in table S1 and compared with available crystal data of analogous molecule21. The bond length of C4–O9, C14–O16, and C35–O37 are calculated as 1.221, 1.224 and 1.227Å respectively from the B3LYP method. All the above C=O bond lengths are more or less equal one to other because they are conjugated with a phenyl group and mesomeric effect of ethoxy group in ester moiety. The C4, C14, and C35 atoms are having SP2 hybridization. The bond length for C14–O15, O15–C17, C45–O47 and C48–O47 are calculated about 1.3582, 1.4454, 1.3604 and 1.4535 Å. In which the bond length of C14-O15 is very lower value O15 atoms having inductive effect dominate mesomeric effect 22.
Table S1: The theoretical bond parameters of DFOC
|
Bond Length |
(Å) |
||
|
(C1−C2) |
1.3642 |
(C2–C14–O16) |
123.59 |
|
(C1–N5) |
1.3832 |
(O15–C14–O16) |
121.57 |
|
(C1–C10) |
1.5073 |
(C14–O15–C17) |
115.56 |
|
(C2–C3) |
1.5292 |
(O15–C17–C18) |
107.54 |
|
(C2–C14) |
1.4654 |
(O15–C17–H19) |
108.93 |
|
(C3–N7) |
1.4644 |
(O15–C17–H20) |
108.89 |
|
(C3–C24) |
1.5379 |
(C3–C24–C25) |
118.79 |
|
(C4–N5) |
1.4028 |
(C3–C24–C26) |
122.27 |
|
(C4–N7) |
1.3647 |
(C25–C24–C26) |
118.92 |
|
(C4–O9) |
1.2219 |
(C24–C25–C27) |
121.26 |
|
(N5–H8) |
1.0095 |
(C24–C25–H28) |
118.78 |
|
(H6–N7) |
1.0109 |
(C27–C25–H28) |
119.94 |
|
(C14–O15) |
1.3582 |
(C24–C26–C29) |
119.67 |
|
(C14–O16) |
1.2249 |
(C29–C26–H30) |
119.53 |
|
(O15–C17) |
1.4454 |
(C25–C27–C31) |
119.66 |
|
(C27–N34) |
1.4095 |
(C25–C27–N34) |
116.69 |
|
(N34–C35) |
1.3803 |
(C31–C27–N34) |
123.62 |
|
(C35–O37) |
1.2273 |
(C27–N34–C35) |
129.07 |
|
(C45–O47) |
1.3604 |
(C27–N34–H36) |
114.44 |
|
(O47–C48) |
1.4535 |
(C35–N34–H36) |
116.18 |
|
Bond Angle |
( °) |
(N34–C35–O37) |
123.42 |
|
(C2–C3–C24) |
112.77 |
(N34–C35–C38) |
115.01 |
|
(C2–C3–H50) |
107.03 |
(O37–C35–C38) |
121.55 |
|
(C24–C3–H50) |
107.63 |
(C35–C38–C39) |
123.75 |
|
(C1–N5–C4) |
125.03 |
(C41–C45–O47) |
113.46 |
|
(C3–N7–C4) |
123.28 |
(C43–C45–O47) |
124.42 |
|
(C3–N7–H6) |
117.69 |
(C45–O47–C48) |
107.69 |
|
(C4–N7–H6) |
113.16 |
(O47–C48–C49) |
107.04 |
The C45–O47 bond length is shorter, which indicates the lonepair of oxygen atom overlapping with the π-orbitals of the phenyl ring. The bond length for C4–N5, C1–N5, C4–N7, C3–N7, C27–N34 and C35–N34 are calculated about 1.4028, 1.3832, 1.3647, 1.4644, 1.4095 and 1.3803Å. This C3–N7 bond length is higher value due to increasing P character of C3 carbon atom and it also having SP3 hybridization. The heterocyclic C=C double bond of C1–C2 bond length is lower value 1.3642 Å. Because it conjugated with the π*(anti-bonding) orbital of the carbonyl ester, and the aromatic bond distance lies in the range of 1.3924- 1.4091 Å. In these present study carboxamide pyrimidine molecules, bond angle C1–N5–C4, C3–N7–C4 and C27–N34–C35 are 125.03, 123.28and 129.09° are respectively.
The C27–N34–C35 bond angle increases because N34 attached with two bulkier group, they are steric hinders one to another and they have slightly distorted pyramidal structure. The deviation in the calculated bond angles for C14–O15–C17 and C45–O47–C48 were (115.56°-107.69°) 7.87°. The lower bond angle value of C45–O47–C48indicate that it have been present in the five-membered cyclic structure (i.e) benzofuran ring.
Natural Bond Orbital Analysis
The NBO is an efficient method to analyze the charge transfer interaction of a molecular system.23 In the present investigation the strong delocalization in the aromatic system gives rise the orbital overlap between the π(C–C)→π*(C–C) interactions gives the strong intra molecular interactions resulting in the π-conjugation due to the π-electron delocalization. These interactions are observed as an increase in electron density (occupancy) in (C–C) antibonding orbitals that weakens the respective bonds24. In our study the strong intramolecular interaction between πC1–C2→π*C14–O16 since the stabilization energy of 104.56Kcal/mol. In addition, the interaction between n O15→ π*C14–O16 shows the hyperconjugation interaction energy about 192.05 Kcal/mol. The highest interaction around the carboxamide, dihydropyrimidinones and the ester moiety can induce large bioactivity of the title molecule. In DFOC molecule has five oxygen atoms and the lone pair of electrons in it shows higher hyper conjugative interaction energies. The stabilizing lone pair interaction are LP(O9) → σ*C4–N5,LP(O15) → π*C14–O16,LP(O16) → σ*C14–O15,LP(O37) → σ*N34–C35andLP (O47) → π*C43–45 shows stabilization energies of116.48,192.05,136.52,108.99 and 128.74 Kcal/moles are listed in table S2.
Table S2: Second order perturbation theory analysis of NBO basis for DFOC
|
Type |
Donor(i) |
ED/e |
Type |
Acceptor(j) |
ED/e |
KJ/mol |
bE(j)−E(i) a.u |
cF(i,j) a.u |
||||
|
σ |
C49 – H51 |
1.9782 |
σ* |
O47 – C48 |
0.0192 |
6.53 |
0.77 |
0.031 |
||||
|
σ |
N5 – H8 |
1.9842 |
σ* |
C1 – C2 |
0.0252 |
13.77 |
1.29 |
0.058 |
||||
|
σ |
H6 – N7 |
1.9803 |
σ* |
C2 – C3 |
0.0284 |
8.66 |
1.04 |
0.041 |
||||
|
π |
C1 – C2 |
1.8403 |
π* |
C14 – O16 |
0.3145 |
104.56 |
0.28 |
0.078 |
||||
|
π |
C26 – C29 |
1.6689 |
π* |
C24 – C25 |
0.3611 |
94.56 |
0.28 |
0.072 |
||||
|
π* |
C27 – C31 |
0.3875 |
77.49 |
0.28 |
0.065 |
|||||||
|
π |
C27 – C31 |
1.6249 |
π* |
C24 – C25 |
0.3611 |
79.45 |
0.28 |
0.066 |
||||
|
π* |
C26 – C29 |
0.3486 |
92.97 |
0.28 |
0.071 |
|||||||
|
π |
C38 – C40 |
1.6413 |
π* |
C35 – O37 |
0.3066 |
84.52 |
0.27 |
0.067 |
||||
|
π* |
C39 – C41 |
0.3459 |
94.35 |
0.28 |
0.071 |
|||||||
|
π* |
C43 – C45 |
0.3833 |
70.50 |
0.27 |
0.061 |
|||||||
|
π |
C39 – C41 |
1.7057 |
π* |
C38 – C40 |
0.3775 |
68.28 |
0.29 |
0.063 |
||||
|
π* |
C43 – C45 |
0.3833 |
90.37 |
0.29 |
0.072 |
|||||||
|
π |
C43 – C45 |
1.6242 |
π* |
C38 – C40 |
0.3775 |
102.3 |
0.29 |
0.075 |
||||
|
π* |
C39 – C41 |
0.3459 |
77.03 |
0.29 |
0.066 |
|||||||
|
n |
N5 |
1.6757 |
π* |
C1 – C2 |
0.2323 |
169.28 |
0.31 |
0.102 |
||||
|
π* |
C4 – O9 |
0.3392 |
178.45 |
0.33 |
0.106 |
|||||||
|
n |
N7 |
1.7427 |
σ* |
C4 – O9 |
0.3392 |
192.05 |
0.32 |
0.11 |
||||
|
n |
O9 |
1.8459 |
σ* |
C4 – N5 |
0.0891 |
116.48 |
0.65 |
0.122 |
||||
|
σ* |
C4 – N7 |
0.0735 |
102.68 |
0.71 |
0.12 |
|||||||
|
n |
O15 |
1.8056 |
π* |
C14 – O16 |
0.3145 |
192.05 |
0.33 |
0.113 |
||||
|
n |
O16 |
1.8532 |
σ* |
C2 – C14 |
0.0564 |
68.87 |
0.72 |
0.099 |
||||
|
σ* |
C14 – O15 |
0.0984 |
136.52 |
0.63 |
0.129 |
|||||||
|
n |
N34 |
1.6688 |
π* |
C27 – C31 |
0.3875 |
143.72 |
0.3 |
0.092 |
||||
|
π* |
C35 – O37 |
0.3066 |
231.58 |
0.29 |
0.113 |
|||||||
|
n |
O37 |
1.8654 |
σ* |
N34 – C35 |
0.0747 |
108.99 |
0.7 |
0.122 |
||||
|
σ* |
C35 – C38 |
0.0651 |
80.25 |
0.67 |
0.103 |
|||||||
|
n |
O47 |
1.8356 |
π* |
C43 – C45 |
0.3833 |
128.74 |
0.34 |
0.097 |
||||
|
n |
O9 |
1.9752 |
σ* |
C4 – N5 |
0.0891 |
8.87 |
1.08 |
0.043 |
||||
|
σ* |
C4 – N7 |
0.0735 |
11.42 |
1.14 |
0.05 |
|||||||
|
n |
O37 |
1.9748 |
σ* |
C31 – H33 |
0.0169 |
4.94 |
1.19 |
0.033 |
||||
|
σ* |
N34 – C35 |
0.0747 |
8.12 |
1.13 |
0.042 |
|||||||
|
σ* |
C35 – C38 |
0.0651 |
9.29 |
1.1 |
0.045 |
|||||||
aE(2) means energy of hyper conjugative interaction (stabilization energy).
bEnergy difference between donor(i) and acceptor(j) NBO orbitals.
cF(i,j) is the fork matrix element between i and j NBO orbitals.
The delocalization energies of πC26–C29→ π*C24–C25, π*C27–C31 and πC27–C31→ π*C24–C25, π* C26–C29 shows 94.56,77.49 and 79.45,92.27 kcal/mol respectively. The interactions between the oxygen lone pair LP(O47) and the anti-bonding orbital π* C43–C45) which have total stabilization energies128.74 Kcal/mol. The intra-molecular hyper conjugative interaction of the σ(C49–H51) distribute to π* O47–C48 leading to stabilization of 6.53 Kcal/mol. The magnitude of the intra-molecular interactions due to the orbital overlap of theπ (C–C) and π* (C–C) in benzofuran ring results in ICT causing stabilization of the whole system. The benzofuran ring has strong delocalization energies πC38–C40→ π*C39–C41, π*C43–C45 and πC43–C35 → π*C38–C40, π*C39–C41 exhibit 94.35,70.5 and 102.3, 77.03 Kcal/mol respectively. In our molecule, the NBO analysis of donor-acceptor interactions to providing very small resonance energy for LP(O9) → σ*C4–N5, σ*C4–N7 and LP(O37) → σ*C31–H33, σ*N34–C35, σ*C35–C38 are 8.7,11.21and4.94,8.12,9.29 Kcal/mol respectively, due to increasing S-character of Oxygen lone pair.
Vibrational Assignments
The molecular structure of DFOC belongs to C1 point group symmetry there would not be any relevant distribution. The title molecule consists of 56 atoms and expected to have 156 normal modes of vibrations (3N-6). The complete vibrational assignments along with the frequencies are presented in Table S3. The both recorded and simulated spectra of FT-IR and FT-Raman are shown in Figs. S1 and S2.
 |
Table S3: The Fundamental vibrational assignments of DFOC Click here to View table |
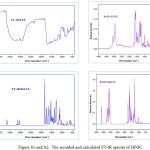 |
Figure S1 and S2: The recorded and calculated FT-IR spectra of DFOC |
Ring 1
In aromatic heterocyclic compounds, the N-H stretching vibrations occur in region 3450‒3250 cm-1 25. The N–H stretching frequency observed at 3370cm-1 for aryl amide analogues26. In the present study the νN34–H36 stretching modes are observed at 3277cm-1 respectively in FT-IR. The lower in frequencies in solid phase may attribute due to hyperconjugation interaction arises with the adjacent carbonyl group. The strong band observed in the region 1715-1600 cm-1 27. In the present work, the very strong band observed at 1701cm-1in FT-IR and also very strong band at1700cm-1 in FT-Raman are assigned for the νC35=O37 stretching vibration with 79% PED contribution. The scaled wavenumber, at 1690cm-1 in B3LYP method. The C–H stretching vibrations of benzofuran appear in the region 3148-3063cm-1 28. In our molecule the aromatic C–H stretching vibrations observed at 3105cm-1 in FT-IR and its corresponding theoretical wavenumber at 3104, 3092 and 3057 cm-1 respectively. In furan νC45–O47 stretching modes are calculated at 1239cm-1 higher frequency (mode no59). Because the bond angle of C–O–C have more angle strain. The bond angle in furan (C45–O47–C48) 107.60 and in ester C14–O15–C17 to give115.56
 |
Graph 1 Click here to View graph |
Ring 2
Aromatic C–H stretching vibrations are expected to observed in the region 3115–3074 cm-1 29.In our molecule the aromatic C–H stretching vibrations observed at 3067 cm-1 in FT-Raman spectrum. The C=C stretching vibrations of phenyl rings are assigned region of 1625-1430 cm−1. In the phenyl ring, the six carbon atoms undergo coupled vibrations called skeletal vibration.30, 31 For our present work, the ring C=C stretching vibrations are calculated in theoretical wavenumber at 1597,1582 cm−1, respectively. The strong bands observed at 1592 cm−1 in FT-Raman spectrum. In our present study, the bands computed at 1101, 1088 cm−1 are assigned to assigned to trigonal bending and breathing mode of the phenyl ring and these bands shows good agreement with experimental FT-IR bands at 1093, and FT-Raman bands at 1086 cm−1.
Ring 3
In the present study, N–H stretching modes are observed at 3270, 3210cm-1 for dihydropyrimidine32. The νN5–H8,νN7–H6 stretching modes are observed at 3369 and 3277cm-1 respectively in FT-IR. The lower in frequencies in solid phase may attribute due to resonance delocalization of dihydropyrimidine ring. The C−N stretching absorption in the region 1382–1266 cm−1 33. The C-N stretching vibration coupled with scissoring of N–H is moderately active in the region 1275±55 cm-1 34. For the pyrimidine ring, the four νC−N stretching vibrations are identified with the help of PED analysis. The C–N stretching wavenumbers are calculated at 1335 and 1216cm-1. In pyrimidine molecule C=C stretching observed at 1645cm-1and 1650-1710cm-1. In our present investigation the νC1=C2 stretching vibration occurs at 1544cm−1 in FT-IR and 1546 cm-1inFT- Raman. The magnitude of C=C stretching frequency is lower than the expected value is due to presence of carboxylate substituent in the neighbouring atom. The π electron conjugated with the carboxylate group. Generally the carbonyl groups are appeared in the region 1700-1660 cm-135, 36. The carbonyl absorption in FT-IR is sensitive for both C and O atoms. The stretching vibration of νC14=O16 is observed as strong band at 1643 cm−1 in FT-IR assured the carbonyl group of the ester. These C14=O16 stretching frequencies is below the expected range, because the conjugation of the C14=O16 bond with pyrimidine ring which may increase its single bond character, resulting in lowered values of carbonyl stretching wavenumber. Generally, in esters, the intense νO15C14 and νO15C17stretching vibration wavenumber appeared at 1112 and 999cm-1in FT-Raman. Because the force- constant of C–O bond is decreased by the O15 atom electron donating nature to the adjacent C14=O16 carbonyl group due to mesomeric effect. The stretching modes of methyl group are expected in the range 3000-2800cm-1. 37, 38 In our title molecule, methyl group asymmetric stretching vibrations are calculated at 3055, 3018, 3011, and 3009cm-1. The symmetrical νC18H21+ νC18H22+ νC18H23 stretching vibration was observed at2937cm-1 in FT-Raman. This observed frequency was relatively very closed to the calculated value at2939 cm-1. The heteroatomic structure shows the presence of C–H stretching vibration in the region3200-3100cm-139. The FT-Raman spectra of the DFOC can be observed to C–H stretching mode at 2974cm-1. While the calculated value of C–H stretching mode appeared at 2973cm-1[mode no18] with 100% of PED contribution.The C–H stretching mode of C–H bond linked to the phenyl group because the C3 carbon atom in SP3 hybridization.
Nonlinear Optical Property
Nonlinear optical material has vast applications in the field of telecommunication, optical interconnections and optical memory for emerging technology in the area of signal processing. 40, 41 In the present study, NLO property of the title molecule has been theoretically predicted and the results are present in the Table S4. From the results, the total dipole moment of the title molecule (2.5589 Debye) is mainly attributed to an overall imbalance in charge. The first hyperpolarizabilty are calculated about 2.936 x10⁻³⁰esu. The β0 value of the title compound is six times greater than that of standard urea. Urea is one of the prototypical molecules used in the study of the NLO properties of molecular systems. Hence the investigated molecule a good nonlinear optical material.
Table S4: The Non-Linear Optical properties of DFOC
|
Parameters
|
Dipole moment ( μ ) Debye |
Parameters Hyperpolarisability ( β0 ) x10-30esu | |
|
|
|||
|
μx |
0.0929 |
βxxx |
-166.94 |
|
μy |
2.5466 |
βxxy |
-288.55 |
|
μz |
0.2333 |
βxyy |
-15.31 |
|
μ |
2.5589 Debye |
βyyy |
217.85 |
|
Parameters |
Polarizability |
βxxz |
-390.22 |
|
αxx |
384.08 |
βxyz |
-129.96 |
|
αxy |
55.88 |
βyyz |
29.35 |
|
αyy |
270.34 |
βxzz |
38.53 |
|
αxz |
0.58 |
βyzz |
-41.91 |
|
αyz |
30.13 |
βzzz |
74.22 |
|
αzz |
197.54 |
β0 |
2.936 x10⁻³⁰esu |
|
α |
6.308 x10⁻³⁰esu |
||
Standard value for urea (μ=1.3732 Debye, β0=0.3728×10⁻³⁰esu): esu-electrostatic unit
Frontier Molecular Orbital Analysis
The frontier molecular orbital analysis (FMOs) were mainly used to predict chemical reactivity, stability and biological implications of a molecular system.42 predicting the most reactive position in π-electron systems and also explained several types of reactions in conjugated system43. As can be seen from the figure S3 HOMO is located on dihydrobenzofuran and partially over pyrimidine ring. By contrast, LUMO is located over dihydropyrimidine with carboxylate side chain of DFOC molecule. Hence, electron delocalization mainly takes place in carboxamide moiety and is also evident from enormous stabilization energy of CO‒NH from NBO analysis. The small energy gap of ∆E = 4.5765 eV is corresponding to the chemical reactivity of the molecule. The globule reactivity descriptors and ∆E values of DFOC is shown in table S5.
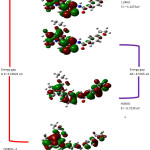 |
Figure S3: The frontier molecular orbitals of DFOC Click here to View figure |
Table S5: The global reactivity descriptors of DFOC
|
Molecular properties |
B3LYP 6-31G(d,p) |
| E HOMO (eV) |
-5.7239 |
| E LUMO (eV) |
-1.1473 |
| E (HOMO-LUMO) (eV) |
4.5765 |
| E HOMO-1(eV) |
-6.0616 |
| E LUMO+1(eV) |
-0.8624 |
| E (HOMO-1-LUMO+1) (eV) |
5.1992 |
| Ionization potential (I) |
5.7239 |
| Chemical hardness(η) |
2.2882 |
| Electronegativity(χ) |
3.4356 |
| Electron affinity(A) |
1.1473 |
| Chemical potential (μ) |
-3.4356 |
| Electrophilicity (ѱ) |
2.5791 |
NMR-Analysis
The NMR spectroscopy is currently used for structural analysis and functional group determination of biological macromolecules. The experimental and simulate NMR chemical shifts are presented in Table S6. The observed 1H and 13C NMR spectra of the title molecule are given in Fig S4. The chemical shift of carbon atom of bond –C35O37–N34H–is an important indicator to identification of carboxamido group. In our study the chemical shit of C35 was observed at165.05ppm in experimental observation and its theoretical shift at 163.49ppm in B3LYP level. The another carbonyl carbon atoms C14 and C4, thus its NMR signal is observed to the downfield at 165.31 and 151.95ppm which are theoretically calculated at 167.30 and149.13ppm respectively. The ring formation C3 atom predicted at 56.95ppm shows good agreement with the experimental chemical shift at 54.25ppm.
Table S6: 1H and 13C NMR Spectral analysisof DFOC
| Observed values | Calculated values | Position of Carbon atom | Observed values | Calculated values | |
|
H33 |
7.85 |
9.29 |
C14 |
165.31 |
167.30 |
|
H44 |
7.84 |
8.26 |
C45 |
162.50 |
164.16 |
|
H42 |
7.67 |
7.56 |
C35 |
165.05 |
163.49 |
|
H28 |
7.67 |
7.52 |
C4 |
151.95 |
149.13 |
|
H32 |
7.63 |
7.50 |
C1 |
148.20 |
147.85 |
|
H30 |
7.25 |
7.14 |
C24 |
145.36 |
145.04 |
|
H36 |
10.04 |
7.0 |
C27 |
139.49 |
140.84 |
|
H46 |
6.86 |
6.94 |
C40 |
130.52 |
132.76 |
|
H50 |
5.11 |
5.62 |
C29 |
128.62 |
129.30 |
|
H8 |
9.16 |
5.29 |
C38 |
127.88 |
129.23 |
|
H54 |
4.63 |
4.75 |
C41 |
124.89 |
126.54 |
|
H53 |
4.61 |
4.61 |
C39 |
121.50 |
119.80 |
|
H20 |
4.00 |
4.33 |
C26 |
119.62 |
117.48 |
|
H19 |
3.98 |
4.22 |
C31 |
118.26 |
117.09 |
|
H6 |
7.94 |
4.05 |
C25 |
108.62 |
114.30 |
|
H52 |
3.31 |
3.41 |
C43 |
108.38 |
109.15 |
|
H51 |
3.23 |
3.11 |
C2 |
99.41 |
103.72 |
|
H13 |
2.24 |
2.75 |
C48 |
71.90 |
71.96 |
|
H11 |
2.24 |
2.59 |
C17 |
59.16 |
61.49 |
|
H23 |
1.11 |
1.47 |
C3 |
54.25 |
56.95 |
|
H22 |
1.10 |
1.42 |
C49 |
28.55 |
30.27 |
|
H21 |
1.08 |
1.16 |
C10 |
28.36 |
21.71 |
|
H12 |
2.24 |
1.01 |
C18 |
17.79 |
12.31 |
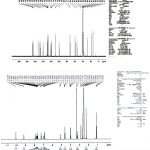 |
Figure S4: 1H and 13C NMR Spectral data of 2,3DCP. Click here to View figure |
Aromatic carbons give signals in overlapped areas of the spectrum with the chemical shift value lie in the range of 100‒150ppm 44, 45. The chemical shifts of benzofuran ring carbon atoms are assigned to region 162.50‒108.38ppm respectively. In the above results reveals that the chemical shift of C45 is observed at the downfield at 162.50 ppm due to delocalization of the lone pair electron from O47 to the C45=C43 in the benzofuran ring. The four free aromatic carbons in the phenyl ring shows a chemical shift value in the region128.62 -108.62ppm from the experimental observation and 129.30 – 109.15 ppm are predicted B3LYP level. In addition, carboxamide and pyrimidine ring attached to the carbon atoms C27 and C24 shows signals at 145.36and139.49 ppm and its corresponding theoretically δ-value calculated at 145.04and 140.84 ppm respectively. The chemical shift of methylene carbon atoms C48, C49 and C17 shows signals at 71.90, 28.55, and 59.16ppm respectively. The carbon atoms C48 and C17 shows higher δ- value compared to the C49 therefore both C48 and C17 carbon atoms can be attributed to the bond linked with the more electronegative oxygen atom. The least δ- value of 28.36 and 17.79 ppm observed for C10 and C18 atoms, because of the consequence of lower charge distribution, being favored by the part of effective atomic charges.
In the 1H-NMR chemical shift of title molecule, a singlet at δ10.04 ppm confirmed the presence of carboxamido moiety. Moreover, two singlets observed at 9.16 and 7.94 ppm are corresponding signals of two N5–H77 and N7–H9 protons of the dihydropyrimidinone ring. The multiples at 6.86 to7.85ppm for seven aromatic protons indicate the presence of benzene and benzofuran ring, which correlates to the calculated chemical shift at 6.94-9.29 ppm, respectively. In addition, the singlet peak appeared at 2.24ppm mark the methyl hydrogen in the dihydropyrimidinone ring, and another methyl proton observed at δ1.16 -1.46ppm as triplet represents the ester group. As can be seen from Table 6, the theoretical chemical shift values are closer agreement with experimental results.
Molecular Electrostatic Potential.
MEP is useful discriptors for determining the reactive sites and hydrogen bonding interactions of the molecule.46,47 According to the calculated results the maximum positive region is localized on the N–H bonds (N5–H8, N7–H6, N34–H35), indicating a possible site for nucleophilic attack. The MEP map shows in fIg.S5 that the negative potential sites are on electronegative carbonyl oxygen atoms (O9, O16 and O37) and the positive potential sites are around the hydrogen atoms. These sites give information about the region from where the compound can have intermolecular interactions. This predicted the most reactive site for both electrophilic and nucleophilic attack.
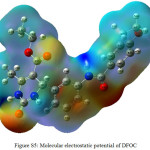 |
Figure S5: Molecular electrostatic potential of DFOC Click here to View figure |
UV Analysis
In order to understand the electronic transitions of DFOC molecule were performed by TD-DFT method. From fig.S6 the absorption maximum of investigated molecule observed at 282 nm and this band is due to the π→π* transition of the molecule. The intensity of the band is very high. The absorption maxima (284 nm) of DFOC is calculated, by TD-DFT/6-31G(d,p) level of theory. The predicted results involving the vertical excitation energies, oscillator strength (f) and wavelength are carried out and are listed in Table S7.
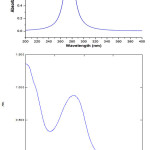 |
Figure S6: The experimental and simulated UV-spectra of DFOC molecule
|
Table S7: The oscillator strength and excitation energies of DFOC
| Orbitals | Energy gap | Theoretical value | Oscillator strength | Experiment | |
| value | |||||
|
Excited State |
1: Singlet-A |
4.0339 eV |
307.35 nm |
f=0.0031 | |
|
110 →112 |
-0.1345 |
||||
|
111 →112 |
0.6859 |
||||
|
Excited State |
2: Singlet-A |
4.3568 eV |
284.57 nm |
f=0.5006 | 282.60nm |
|
107 →113 |
0.12215 |
||||
|
111 →113 |
0.65147 |
||||
|
Excited State |
3: Singlet-A |
4.5507 eV |
272.45 nm |
f=0.0101 | |
|
107 →113 |
-0.4727 |
||||
|
110 →112 |
0.34942 |
||||
|
110 →113 |
-0.2641 |
||||
|
111 →113 |
0.15312 |
Conclusion
This works reports the synthesis and computational analysis of nonlinear molecule ethyl 4-(3-(2,3-dihydrobenzofuran-5-carboxamido)phenyl)-1,2,3,4-tetrahydro-6-methyl-2-oxopyrimidine-5-carboxylate. The structure was determined and characterized by UV-visible, FT-IR, FT-Raman and NMR spectral studies. The NBO results reveals the strong hyperconjugative interactions occurs in the molecule leads to the highest stabilization energy of of the molecular system. The investigated DFOC have small energy gap 4.5765eV is responsible for the nonlinear optical activity. The first hyperpolarizabilty calculated as 2.936 x10⁻³⁰esu, which is eight times greater than that of reference urea. The effect is even more important for nonlinear molecule with strong intramolecular charge transfer from electron donor group to electron acceptor group (D– π –A) interacting through a conjugated π system. The UV-visible absorption analysis, mainly takes place π–π * transition of the title molecule. The charge sites are identified by the molecular electrostatic potential mapped surface.
References
- Kappe, C.O. Acc. Chem. Res 2000, 33, 879–888.
CrossRef - Kappe, C.O. Eur. J. Med. Chem. 2000, 35, 1043–1052.
CrossRef - Deshmukh, M.B.; Salunkhe, M.; R.Patil, D.; Anbhule, P.V. Eur. J. Med. Chem. 2009, 44, 2651–2657
CrossRef - Shakya, N.; Srivastav, C.; Bhavanam, S.; Tse, C.; Desroches, N.; Agrawal, B.; Kunimoto, D.Y.; Kumar. R. Bioorganic & Medicinal Chemistry. 2012, 20, 4088–4097.
CrossRef - Galanakis, D.; Kourounakis, A. P.; Tsiakitzis, K.C.; Doulgkeris, C.; Rekka,E. A.; Gavalas, A.; Kravaritou, C.; Christos, C.; Kourounakis, P.N. Bioorg. Med. Chem.Lett. 2004, 14, 3639–3643.
CrossRef - Ashraf, M.; Abdel-Megeed,Hamdy, M.; Rahman, A.; Gamal-Eldien, S.; Mahmoud, A.; Gendy, E. Eur. J.Med.Chem. 2009, 44, 117–123.
- Papadopoulou, C.; Geronikaki, A.; Hadjpaulou-Litina, D. IlFarmaco. 2005, 60, 969–973.
CrossRef - Akhaja, T. N.; Raval, J. P.; Chinese Chemical Letters. 2012, 23, 446–449.
CrossRef - Mihaelamoise, ValeriuSunel, marcel popacatalinalionate. Cellulose Chemistry and Technology. 2011, 4,191-196.
- Patel, L.; Lindley, C. Exp. Opin. Pharmacother. 2003, 12, 2279–2296.
CrossRef - Mohamed, H.; Samir, Y.; Mohamed, A.; Awatef, A.; Yousry, A. Medicinal Chemistry Research. 2013, 22, 5598–5609.
CrossRef - Cole, J. M. Analyst. 2011, 136, 448–455.
CrossRef - S. Sumalekshmy, C. Fahrni, J. Chem. Mater. 2011, 23, 483 –500.
CrossRef - Makoto Satsuki, N.I., Sadaharu Suga, Hisayoshi Fujikawa, Yasunori Taga, 2007. Organic light emitters using coumarin derivative asluminescent agents having efficiency and durability; display panels. US7252892 B2.
- Marks, T. J.; Hersam, M. C. Materials science: semiconductors grown large and thin. Nature. 2015, 520, 631–632.
CrossRef - Huang, C. H.; McClenaghan, N.D.; Kuhn, A.; Bravic, G.; Bassani, D.M. Tetrahedron. 2006, 62, 2050–2059.
CrossRef - Frisch, M.J.; Trucks, G.W.; Schlegel, H.B.; Scuseria, G.E.; Robb, M.A.; Cheeseman, J.R. Montgomery J.A.; Vreven, T.; Kudin, K.N.; Burant, J.C.; Millam, J.M.; Iyengar, S.S.; Tomasi, J.; Barone, V.; Mennucci, B.; Cossi, M.; Scalmani, G.; Rega, N.; Petersson, G.A.; Nakatsuji, H.; Hada, M.; Ehara, M.; Toyota, K.; Fukuda, R.; Hasegawa, J.; Ishida, M.; Nakajima, T.; Honda, Y.; Kitao, O.; Nakai, H.; Klene, M.; Li, X.; Knox, J.E., Cross, J.B.; Adamo, C.; Jaramillo, J.; Gomperts, R.; Stratmann, R.E.; Yazyev, O.; Austin, A.J.; Cammi, R.; Pomelli, C.; Ochterski, J.W.; Ayala, P.Y.; Morokuma, K.;. Voth, G.A .; Salvador, P.; Dannenberg, J.J.; Zakrzewski, V.G.; Dapprich, S.; Daniels A.D.; Strain, M.C.; Farkas, O.; Malick, D.K.; Rabuck, A.D.; Raghavachari, K.; Foresman, J.B.; Ortiz, J.V.; Cui, Q.; Baboul, A.G.; Clifford, S.; Cioslowski, J.; Stefanov, B.B.; Liu, G.; Liashenko, A.; Piskorz, P.; Komaromi, I.; Martin, R.L.; Fox, D.J.; Keith, T.; Al-Laham, M.A.; Peng, C.Y.; Nanayakkara, A.; Challacombe, M.; Gill, P.M.W.; Johnson, B.; Chen, W.; Wong, M.W.; Gonzalez, C.; Pople, J.A. Gaussian 03, Revision C.02, Gaussian Inc., Wallingford, CT, 2004.
- Schlegel, H.B. J. Comput. Chem. 1982, 3, 214–218.
CrossRef - Jamroz, M. H. Vibrational Energy Distribution Analysis: VEDA4 program (Warsaw, Poland, 2004)
- Michalska, D. Raint Program, Wroclaw University of Technology, 2003.
- Dhandapani, A.; Manivarman, S.; Subashchandrabose, S. Chemical Physics Letters. 2016, 655-656, 17–29.
CrossRef - Keynotes in Organic Chemistry by Andrew F. Parsons Blackwell Publishing: Oxford, UK, 2003.
- Snehalatha, M.; Ravikumar, C.; Joe, N.; Sekar, V.S.; Jayakumar, A. Spectrochim. Acta 2009, 972, 654–662.
CrossRef - Demirciog, Z.; Albayrak, C.; Buyukgungor, O. SpectrochimicaActa Part A: Molecular and Biomolecular Spectroscopy. 2014, 128, 748–758.
CrossRef - Karabacak, M.; Sahin, E.; Cinar, M.; Erol, I.; Kurt, M. J. Mol. Struct. 2008, 886, 148–157.
CrossRef - Pochampally, J.; Valeru1, A.; Macha1, R.; Tigulla1, P.; Gandu, B.; Anupoju, G. World Journal Of Pharmacy And Pharmaceutical Sciences. 2014, 3, 1908-1930.
- Dhandapani A.; Manivarman S.; Subashchandrabose S.; Saleem H.; J. Mol. Struct. 2014, 1058, 41–50.
CrossRef - Contreras, C. D.; Montejo, M.; opez Gonz alez, J. J. L.; Zinczukc. J.; Brand, S. A. J. Raman Spectrosc. 2011, 42, 108–116
CrossRef - Durgadevi, D.; Dhandapani, A.;Manivarman, S.; Subashchandrabose, S. Canadian Chemical Transactions. 2016, 4, 99-120
- Bellamy, L.J.The Infrared Spectra of Complex Molecules, John Wiley & Sons Inc., New York, 1975.
CrossRef - Varsanyi, G. Vibrational Spectra of Benzene Derivatives, Academic Press, New York, 1969.
- Shaquiquzzaman, M.; Ahmad Khan, S.; Amir, M.;MumtazAlam, M. Saudi Pharmaceutical Journal. 2012, 20,149–154.
CrossRef - Silverstein, M.; Basseler, G.C.; Morill, C. Spectrometric Identification of Organic Compounds Wiley, New York, 1981.
- Roeges, N.P.G. A Guide to the Complete Interpretation of Infrared Spectra of Organic Structures, Wiley, New York,1994.
- Vein, D.L.; Colthup, N.B.; Fateley, W.G.; Grasselli, J.G. The Handbook of Infrared and Raman Characteristic Frequencies of Organic Molecules, Academic Press, San Diego, 1991.
- Gunasekaran, S.; Ponnambalam, U.; Muthu, S. ActaCiencia Ind. 2004, 30, 1015-1020.
- Dollish, F. R.; Fateley, W. G.; Bentely, F. F. Characteristic Raman Frequencies on Organic Compounds, Wiley, New York.1997.
- Silverstein, R. M.; Clayton Bassler, G.; Morril, T. C.; Spectroscopic Identification of Organic Compounds, John Wiley, New York. 1991.
- Contreras, C. D.; Montejo, M..; LopezGonzalez, J. J.; Zinczukc. J.; Brand, S. A. J. Raman Spectrosc. 2011, 42,108–116.
CrossRef - Weng, J.; Mei, Q.; Fan, Q.; Ling, Q.; Tongc, B.; Huang, W. RSC Adv. 2013, 3, 21877.
CrossRef - Tanak H.; Comput. Theoret. Chem. 2011, 967, 93–101.
CrossRef - Ozdemir, M .; Sonmez, M .; Şen, Dinçer, M. Spectrochim. Acta A. 2015, 137 1304–1314.
- Fukui, K.; Yonezawa, T.; Shingu, H.J. J. Chem. Phys. 1952, 20, 722–725.
CrossRef - Kalinowski, H.O.; Berger, S.; Braun, S. Carbon-13 NMR Spectroscopy, John Wiley & Sons, Chichester, 1988.
- Politzer, P.; Truhlar. D.G. Chemical Application of Atomic and Molecular Electrostatic Potentials, Plenum, New York, 1981.
CrossRef
- Luque, F.J.; Lopez, J.M.; Orozco, M. Theor. Chem. Acc. 2000,103, 343–345.
CrossRef - Okulik, N.; Jubert, A.H. Internet Electron. J. Mol. Des. 2005, 4, 17–30.
Accepted on: April 12, 2017


ISSN Online: 2231-5039

![]()


