Preparation of Vancomycin Hydrochloride Nanoparticles and Survey of the Factors Influence their Properties
1Department of pharmaceutics, Ahvaz Jundishapur University of Medical Sciences, Ahvaz, Iran.
2Department of pharmaceutics, Tabriz University of Medical Sciences, Tabriz, Iran.
3Department of Chemistry, Biology and Biotechnology, University of Perugia, Perugia, Italy.
4Department of science pharmaceutics, University of Perugia Via del Liceo, 1, 06123 Perugia, Italy.
5Nanotechnology Research Center, Ahvaz Jundishapur University of Medical Sciences, Ahvaz, Iran.
6Department of Medicinal Chemistry, Ahvaz Jundishapur University of Medical Sciences, Ahvaz, Iran.
Corresponding Author E-mail: amanzarei@ymail.com
DOI : http://dx.doi.org/10.13005/ojc/330204
Download this article as:
![]()
Vancomycin hydrochloride (VCM) is a glycopeptides antibiotic. We intend to optimize preparation condition of VCM nanoparticles. Nanoparticles have high bioavailability and oral absorbable fraction. After drug to polymer ratio optimization, loading efficiency, production yield and particle size were measured by changing the organic phase volume, aqueous phase volume and emulsifier concentration in selected formula. DSC, XRD, FTIR, dissolution rate, and zeta potential were surveyed. The mean particle size, percentage of loading efficiency and production yield for selected formula were 430 nm, 89% and 98% respectively. Particle size has been inversely associated with most evaluated independent factors. Loading efficiency and production yield had inverse correlation with organic phase volume and with the rest of factors had linear correlation.
KEYWORDS:Vancomycin; VCM; Double emulsion; Eudragit RS-100; Nanoparticle
Introduction
Among the major challenges in pharmaceutical fields it is certainly relevant the issue concerning the improvement of permeability and absorption of drugs (1). Particle size is one of the factors most influencing the permeability of drugs and accordingly, nanoparticles sized antibiotics featuring impressive antimicrobial effect and enhanced penetration in infected tissues (2). VCM, a widely known glycopeptide antibiotic, is very active against gram positive bacteria and is used to treat a number of bacterial infections (3) and especially in those cases where resistance to other antibiotics is critical as in the representative case of penicillin and methicillin resistant Staphylococcus aurous (4) showing a good general inhibitory effect on staphylococci and streptococci (5). This widely used drug is the preferred treatment in bacterial infections in patients with hypersensitivity to beta-lactam antibiotics (6).
Due to VCM inability to pass through the intestinal wall, this antibiotic needs to be administered intravenously to treat systemic infections (7). In fact, CM treatment is recommended and truly useful in the cases of complicated skin, bloodstream, endocarditic, bone and joint infections, as well as the first line treatment of meningitis (8). In theses case, plasma concentration measurement is necessary to determine the correct dosage (9).
VCM operates by inhibiting cell wall synthesis of gram positive bacteria while does not generally show efficiency against gram negative bacteria (one exception is Neisseria species). VCM binds with high affinity to the D-Ala-D-Ala C-terminus of the pentapeptide, thus blocking the addition of late precursors by transglycosylation to the nascent peptidoglycan chain and preventing subsequent cross-linking by transpeptidation. VCM does not penetrate into the cytoplasm; therefore, interaction with its target can take place only after translocation of the precursors to the outer surface of the membrane (10, 11). In addition, it should be also taken into account that VCM is a large hydrophilic molecule that has poor distribution across the gastrointestinal mucosa. In fact, when taken orally, is absorbed very poorly and it just orally administered to reach the active site in the large intestine to treat severe Clostridium_difficile colitis (7).
Nanoparticles VCM represents a promising approach to solve current limits concerning oral formulation that cannot be prescribed for systemic infection. Oral administration due to its simplicity and the corresponding patient’s comfort represents the ideal procedure for many types of drug. In the case of VCM this approach is crucially limited by several issues. Therapeutic concentration of VCM is 20-40 µg/mL. The absorption of this drug from oral administration is minimal, and its arising serum concentrations is not quantifiable (12). After the venous administration, VCM almost penetrates to all tissue. Its volume of distribution is about 50 liters (Vd= 0.4 L/Kg) and protein binding is approximately 37-55% (13). VCM elimination occurs primarily through the kidneys (fe= 97%) and it can be revealed in different parts of the body including the cerebrospinal (when the meninges are inflamed), bile, pericardial and synovial fluids (14). During oral administration of drugs, absorption of drug molecules requires to cross one or more biological membranes before they reach the blood stream. The ability of drug molecules to cross biological membranes, or in other words, the permeability of drugs is a very biopharmaceutical important parameter that determines absorption and subsequent distribution, metabolism and excretion (3).
Nanoencapsulation method is investigated for controlled drug release, specific treatment, reduction of the adverse effects, higher performance, to maintain constant concentration of drug in the blood and tissue cells and increase efficacy of the drug therapy (8).
Main goals of orally nanoparticles administration is to increase the drug’s bioavailability, control the release and reduce gastrointestinal irritation caused by the drug. Nanoparticles are absorbed via transcellular by M cells surface with formation of vesicles and then are transmitted to lymphocytes. As a result, nanoparticles don’t participate liver metabolism (first pass effect), and they turn around portal vein. In addition, the colloidal polymer acting as drug carrier also helps to avoid the drug denaturation in the intestinal tract, improving drug bioavailability by prolonging the exposure time of the nanoparticles in the mucous membrane and increasing the blood concentration (15). De Jaeghere et al. showed that intracellular infections caused by bacteria, viruses, fungi or parasites can be treated by nano drugs more effectively than conventional drugs (16).
Nanoencapsulation method is investigated for controlled drug release, specific treatment, reduction of the adverse effects, higher performance, to maintain constant concentration of drug in the blood and tissue cells and increase efficacy of the drug therapy (8). There are several methods for the nanoencapsulation and specifically depends on the physicochemical properties of the drug. The most important parameter in determining the correct approach is related to the water solubility of the drug considering that water is directly involved in formation of external continuous phase. For nanoencapsulation of a large number of hydrophilic molecules, including peptides and protein a limited number of techniques are available. For these molecules the used solvent, heat and pressure are very important. Most recently the technique of multiple emulsions (three-phase) for the encapsulation of peptides and proteins has used with good results (17). By using a double emulsion (W/O/W), high encapsulation efficiency for hydrophilic molecules is obtained. The control of temperature and viscosity of internal phase secondary emulsion (W/O) is also very important (18). To deliver an effective dose of drug to the site of action and abstinence of drug side effects, the pharmaceutics needs appropriate pharmaceutical carriers and formulations. In this regard, the use of colloidal carriers such as liposomes and nanoparticles is suitable methods to achieve this goal. It is known that design of drug delivery systems based on nanoparticles, will have more therapeutic efficacy, low toxicity, convenience and patient compliance followed by drug accumulation at the site of action (19, 20). Okochi et al. studied the medicinal properties and drug formulation stability for the effective preparation of w/o/w emulsion as drug carrier for VCM (21). By providing the nanoparticles of this drug try to be the increases the VCM oral absorption and then its oral form will be used for systemic infections. Absorbing nanoparticles depend on to the surface properties, size and shape. Nanoparticles can be absorbed by endocytosis and are not destroyed by endosomes; the result is greater bioavailability (6). The aim of the present study is finding the optimal conditions for producing nanoparticles from aspect of loading, production yield and particle size.
Experimental
VCM and Eudragit RS-100 were purchased from Sigma-Aldrich. Dichloromethane, Poly Vinyl Alcohol, Methanol and n-Hexane were purchased from Merck. Considering the VCM is drug water soluble, its nanoparticles were prepared by solvent evaporation method as w1/o/w2 emulsion. In the first stage, the primary emulsion (w1/o) was established. 5 ml of water containing 100 mg of VCM, as an internal aqueous phase of primary emulsion drop by drop was added in 20 ml of organic solvent methylene chloride containing 100 mg (F1), 200 mg (F2) and 300 mg (F3) Eudragit RS-100 polymer (External phase of primary emulsion) under the homogenizer with 24000 rpm at 4°C. After three minutes, the w1/o was formed. Then the primary emulsion over 25 ml polyvinyl alcohol 0.2% was added and pre emulsion w1/o/w2 was formed. Nanoparticles, under stirring for one hour with 1000 rpm at ambient temperature to remove the solvent were set. The resulting nanosuspensions were centrifuged (18000g), upper solution for measuring the amount of the drug was used, and sediment was freeze dried. Absorption of solution was read with spectroscopy in 280.2 nm of the total amount of the drug and the amount of it in the upper solution; the actual amount of loaded drug is obtained. Production yield, of the ratio of the dried nanoparticles (A) to the amount of all solid material in the dispersed phase (B) be gained (22)
Production Yield = 100 (A/B)
The loading efficiency of existing drugs in the sample from this equation was calculated:
Loading Efficiency = 100 (C0/Ct)
Which in Co and Ct are the observed true concentration and theoric concentrations respectively (23).
To study the particle charge, zeta potential was checked. The higher zeta potential indicates more charge on the surface of the particles and therefore, the stability of the suspended particles can be more. In such a condition, particles are inclined to the less accumulation and are suspended in solutions excellent. Suspended particles more easily are absorbed by the cells compared with aggregated particles (24). To study the possibility of chemical interaction such as the hydrogen bonds between the drug and the carrier the spectrum of FT-IR was studied (25). In order to check possible changes drug polymorphism and crystalline, before and after preparation of nanoparticles, spectrum of XRD and DSC were achieved (26). In order to implementing dissolution test, 200 ml phosphate buffer saline pH=7.4 were used. During the duration of the test (24 hours), speed 100 rpm, temperature of dissolution medium on the 37°C was kept constant. The equivalents of 20 mg of pure drug in the dialysis membrane with cut off 10 KD were put and sampling at times 0.5, 1, 2, 3, 4, 5, 6, 8, 12 and 24 hours was performed and in wavelength 280.2 nm were quantified. To optimize the nanoparticles preparation, the parameters change was carried out by Experimental of Design (EOD). The amount of drugs entrapped (DE), loading efficiency (LE), production yield (PY) and particle size (PS) were analyzed. In this study, the organic phase in volume of 15, 20 and 25 ml was varied. 20, 25 and 30 ml were the selected volume for aqueous phase. The used emulsifier concentrations were ٪0.1, ٪0.2 and ٪0.4. Data analysis by the EOD was performed and the effects of each component alone or in the presence of other influential factors can be determined and the conditions that lead to ideal result would be achieved.
Results
The F2 formula was selected as the best formulation. XRD, FT-IR, DSC and zeta potential analysis was performed on selected formulation. Importance of zeta potential is which its amount is associated with stable colloidal dispersion. For molecules and particles that are small enough, high zeta potential causes more stable system and therefore, prevent from aggregation of particles. The zeta potential was +25.7 mv, which indicates a good stability of formulations. To study the possibility of chemical interaction between the drug and polymer the spectrum of FT-IR was studied, which shows a lack of interaction between them (Figure 1). Also to realize the possible changes drug polymorphism and crystalline, before and after preparation of nanoparticles, spectrum of XRD was achieved, which shows a lack of interaction (Figure 2). DSC represents maintain the crystallinity of the drug and there is no incompatibility between the drug and the polymer (Figure 3). Drug release from nanoparticles was studied and the results showed that in 24 hours more than 95℅ of the drug is released. In addition the nanoparticles did not show burst ralease (Figure 4). To check out optimal production conditions, with changes in the selected formula, 27 formulations were designed and each of the formulations had different emulsifier concentration, the organic and aqueous phase volume. The effect of each, some or all of them to be determined on formulations. With the design of the experiments with using minitab program as well as use of Design of Experimental and obtained views, data were analyzed and the amount of DE, LE, PY and PS as the responses were inserted (Tables 1, 2).
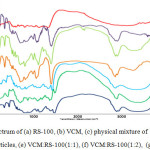 |
Figure 1: FTIR spectrum of (a) RS-100, (b) VCM, (c) physical mixture of VCM:RS-100(1:2), (d) Blank of nanoparticles, (e) VCM:RS-100(1:1), (f) VCM:RS-100(1:2), (g) VCM:RS-100(1:3).
|
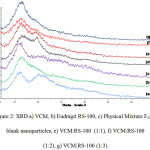 |
Figure 2: XRD a) VCM, b) Eudragit RS-100, c) Physical Mixture F2, d) blank nanoparticles, e) VCM:RS-100 (1:1), f) VCM:RS-100 (1:2), g) VCM:RS-100 (1:3).
|
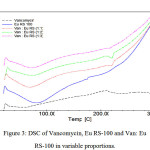 |
Figure 3: DSC of Vancomycin, Eu RS-100 and Van: Eu RS-100 in variable proportions.
|
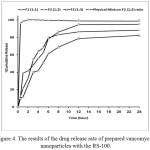 |
Figure 4: The results of the drug release rate of prepared vancomycin nanoparticles with the RS-100.
|
Table 1: Factorial design results for prepared formulations.
|
Formulation code |
Variable levels in coded form |
PS (nm) |
LE (%) |
DE (%) |
PY (%) |
||
|
X1 |
X2 |
X3 |
|||||
|
F1 |
15 |
20 |
0.1 |
480 |
80 |
26 |
94 |
|
F2 |
15 |
25 |
0.2 |
502 |
82 |
29 |
95 |
|
F3 |
15 |
30 |
0.4 |
570 |
81 |
28.5 |
96 |
|
F4 |
20 |
20 |
0.1 |
490 |
82 |
29 |
97 |
|
F5 |
20 |
25 |
0.2 |
468 |
79 |
31.2 |
98.6 |
|
F6 |
20 |
30 |
0.4 |
510 |
85 |
30.2 |
98.2 |
|
F7 |
25 |
20 |
0.1 |
580 |
84 |
30.8 |
96.5 |
|
F8 |
25 |
25 |
0.2 |
520 |
88 |
31.5 |
98.1 |
|
F9 |
25 |
30 |
0.4 |
590 |
88 |
30.7 |
98.2 |
|
F10 |
15 |
20 |
0.1 |
490 |
83 |
26.3 |
94 |
|
F11 |
15 |
25 |
0.2 |
476 |
81 |
27 |
95.2 |
|
F12 |
15 |
30 |
0.4 |
520 |
86 |
28.1 |
95.7 |
|
F13 |
20 |
20 |
0.1 |
480 |
77 |
25.7 |
94.5 |
|
F14 |
20 |
25 |
0.2 |
442 |
87 |
28.8 |
97.7 |
|
F15 |
20 |
30 |
0.4 |
526 |
90 |
30.1 |
98.1 |
|
F16 |
25 |
20 |
0.1 |
490 |
88 |
29 |
96.8 |
|
F17 |
25 |
25 |
0.2 |
575 |
90 |
30.1 |
97.9 |
|
F18 |
25 |
30 |
0.4 |
520 |
90.1 |
30.3 |
97.8 |
|
F19 |
15 |
20 |
0.1 |
450 |
87.1 |
25.2 |
93.4 |
|
F20 |
15 |
25 |
0.2 |
440 |
88 |
26.5 |
64.5 |
|
F21 |
15 |
30 |
0.4 |
473 |
89 |
25.8 |
94.7 |
|
F22 |
20 |
20 |
0.1 |
410 |
89 |
26.3 |
94.1 |
|
F23 |
20 |
25 |
0.2 |
415 |
93 |
26.3 |
96.6 |
|
F24 |
20 |
30 |
0.4 |
435 |
91.5 |
28.2 |
94.3 |
|
F25 |
25 |
20 |
0.1 |
465 |
91.5 |
27.8 |
94.1 |
|
F26 |
25 |
25 |
0.2 |
472 |
92.8 |
29.1 |
95.3 |
|
F27 |
25 |
30 |
0.4 |
495 |
93.1 |
29.3 |
95.9 |
X1= organic solvent volume, X2= aqueous solvent volume, X3= emulsifier concentration, DE= drug entrapped, LE= loading efficiency, PS= particle size, PY= production yield
Table 2: Equations obtained for each of the dependent variables against the independent variables
| Term | Equation of regression coefficients |
| PY versus X1, X2, X3 | PY =94.9533- 1.64 × (Organic Phase Volume) -2.3067× (Aqueous Phase Volume) + 0.98×(Cocentration of Emulsifier) |
| DE versus versus X1, X2, X3 | DE =26.78-1.8267 × (Organic Phase Volume) -2.6267×(Aqueous Phase Volume) + 0.6533 × (Cocentration of Emulsifier) |
| LE versus X1, X2, X3 | LE =79.533- 5.4 × (Organic Phase Volume) +3.1333×(Aqueous Phase Volume) + 2.1333×(Cocentration of Emulsifier) |
| PS versus X1, X2, X3 | PS =1109.2 – 58.867× (Organic Phase Volume) -43.867× (Aqueous Phase Volume ) – 489.2×(Cocentration of Emulsifier) |
Increasing the ratio of polymer to drug increased production yield (from 96.38% to 98/35%). production yield increased with the increases in the emulsifier concentration, On the other hand, reducing the volume of the aqueous phase, production yield increased. By reducing the volume of the organic phase, production yield is increased (Figure 5).
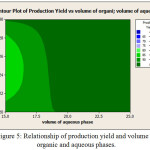 |
Figure 5: Relationship of production yield and volume of organic and aqueous phases. |
Also increasing the ratio drug to polymer, caused to decrease the amount of entrapped drug (from 31.52% to 23.69%). The amount of drug loading has inverse relationship with aqueous and organic phase volume. There is a direct relationship between emulsifier concentration and loading (Figure 6). Decreasing the ratio of polymer to drug and reduction of temperature dispersion phase to 4°C causes smaller particle, as a result the particle size increased from F1 to F3. However, increasing the nanoparticles size is not significant for formulations F2 to F3 (P>0.05) (Table 3). Particle size enlargement is decreasd in the high emulsifier concentration, On the other hand, reducing the organic and aqueous phase volume, causes large the particles size (Figure 7).
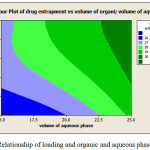 |
Figure 6: Relationship of loading and organic and aqueous phases volume.
|
Table 3: Effect of Drug-polymer ratio on the loading, loading efficiency and particle size.
|
Formulations |
Drug: Polymer ratio |
Production yield |
Theoretical drug content (%) |
Mean amount of drug entrapped |
Drug loading efficiency (%±SD) |
Mean particle size |
|
(%±SD) |
(%±SD) |
(nm±SD) |
||||
|
F1 |
1:01 |
96.38±1.5 |
50 |
31.52±1.04 |
63±2.19 |
362±36.12 |
|
F2 |
1:02 |
97.84±1.4 |
33. 33 |
29.79±1.12 |
89.37±0.36 |
430± 31.94 |
|
F3 |
1:03 |
98.35±1.7 |
25 |
23.69±1.02 |
94.76±1.5 |
499±29.26 |
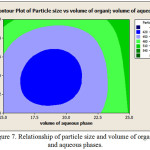 |
Figure 7: Relationship of particle size and volume of organic and aqueous phases. Click here to View figure |
Discussion
Simple and multiple emulsions consist of oil and water that are considered as heterogeneous systems with a weak stability. Especially for the preparation of w/o/w emulsion, stability of internal phase emulsion (w/o) is very important. w/o/w emulsions such as liposomes or microspheres are used as a carrier useful for water-soluble drugs. In the multiple emulsions w/o/w, selective emulsifier between the inner surfaces is hydrophobic while selective emulsifier in outer surface should be hydrophilic. In many cases, mixtures of two or more emulsifiers are used to achieve higher stability (21). Okochi and his colleagues have shown that the study of medicinal properties and particularly w /o /w emulsion stability containing vancomycin, as drug carriers is essential (21). In this study eudragit RS-100 polymer was used, because of absorption of prepared nanoparticles with hydrophobic polymer for hydrophilic particles, showed higher value (27), thereby further hydrophilic particles may be quickly eliminated. In general, nanoparticles with hydrophobic polymers such as polystyrene or polymers without charge or positive charge have the tendency to epithelial and absorbed by entrocytes. negatively charged polymer show a drastic increase in adhesion properties and absorbed by M cells and entrocytes (28).
Increasing the ratio of polymer to drug increases production yield (from 96.38% to 98/35%). The cause of the increase in production yield of the formulation from F1 to F3 can be due to an increase of surrounded drug particles by polymer and prevention of particle dissolution by external aqueous phase, which may cause increased production yield (Table 3). On the other hand, reason of the increase of production yield in the ratio of high polymer can be due to the decrease in the speed of dichloromethane diffusion from concentrated solutions to aqueous phase that provide more time for droplets formation, and may increase production yield (29). Increasing in production yield with the increase in the emulsifier concentration, because the phase concentration of w2 will be more and the particles are transferred more to w2 and result in opportunity the particles formation becomes higher. On the other hand, reducing the volume of the aqueous phase, the low drug is dissolved in this phase, and consequently production yield is increased. By reducing the volume of the organic phase, methylene chloride diffusion rate decreases and consequently; the time formation of the particles is increased, resulting in increases in production yield (Figure 5). Loveymi et al. showed increases in the amount of emulsifiers resulted in an increase in the production efficiency because non-ionic emulsifiers that cause the formation of hydrophobic areas contribute to solve some of the drugs and polymers. Emulsifiers in higher concentrations may be to drape beyond the oil–water surface and as a result led to the creation of a hydrophobic area that prevents the drug dissolution and consequently, production yield increases (30).
Increasing the ratio of polymer to drug decreases the amount of entrapped drug (from 31.52% to 23.69%). In the larger ratio of polymer to drug (F3), solubility of the drug in the solvent and the continuous phase of final emulsion is low and tendency of the nuclei constituent to the distribution from organic phase (dichloromethane) to aqueous phase (W2 or soluble polyvinyl alcohol) is elevated and loading of drug inside nanoparticles will be less (Table 3). By reducing the amount of polymer in internal organic phase, the viscosity of this phase is decreased and according to Einstein’s-Stock’s equation, diffusion coefficient of drug from internal phase to the external aqueous phase is increased (31), and this reduces the amount of drug loading in the particles. Looks with an increase in the organic phase volume, evaporation rate of this phase become less, which reduces the speed of the polymer film formation. This issue reduces the entrance of the drug to the w2 phase and as a result reduction in the amount of loading. On the other hand by increasing aqueous phase volume, the more drug can be solved in it and as a result the amount of loading will be less., because by increasing the emulsifier concentration, entrance of the drug to w2 phase will be less and as a result the amount of drug loading to be more (Figure 6).
Decreasing the ratio of polymer to drug and reduction of temperature dispersion phase to 4°C, Increases the viscosity but because of lack of large increase in viscosity of between the surface (dispersed and continuous phase) don’t created obstacle to divide of the dispersed phase into smaller particle and these particles are formed there. As a result, the particle size increases from F1 to F3. However, increasing the nanoparticles size is not significant for formulations F2 to F3 (P>0.05) (Table 3). Briefly increasing ratio of polymer to drug, primary emulsion viscosity is increased, obstacle is created against divided large particles to small particles and larger particles appear (Figure 7). Perumal et al. reported that the increase in the average particle size with increasing at the rate of agitation can be related to the tendency of droplets to coalesce and to accumulation of particles. At higher speeds strong mechanical force, uniform and incremental apply resulting in a rapid dispersion of the formed droplets and most likely induce formation of larger droplets. They showed that formed droplets during the encapsulation process is closely related to the final size of nanospheres (32). Particle size enlargement with decrease in the emulsifier concentration, because the phase concentration of w2 will be less and the particles are transferred more to w2 and likely result in higher colloid formation and this causes enlargement of the particles. On the other hand, by reducing the volume of the organic phase, the its viscosity become augmentation and immigration of emulsion droplets from organic phase fewer and thus the possibility of the formation of colloid will be higher and this is causing enlargement of the particles. By reducing the volume of the aqueous phase, leaving the emulsion droplets from the organic phase lesser and as a result likely formation of colloids is more and this issue makes the large particles (Figure 7).
The spectrum of the DSC, XRPD and FTIR showed that peak of VCM in all formulations stable. By increasing proportion of drug-polymer ratio, the intensity of spectrum of the drug is increased. The amount of organic and aqueous phases has an inverse relationship with production yield, the amount of loading and particle size. Emulsifier concentration has a direct relationship with production yield, the amount of loading and inverse relationship to particle size. It seems that for preparing of suitable nanoparticles, organic and aqueous phases must be reduced and the amount of emulsifier concentrations to be considered average in order to achieve smaller particle size and high loading.
Acknowledgement
The authors would like to thank Nanotechnology Research Center of Jundishapur University of Medical Sciences, for providing a grant to support this work.
References
- Gupta, S.; Kesarla, R.; Omri, A. ISRN Pharm., 2013, 2013, 1-16.
- De Jong, W. H.; Borm, P. J. Int. J. Nanomedicine., 2008, 3, 133-149.
CrossRef - Dash, A.; Cudworth, G. J. Pharmacol. Toxicol. Methods., 1998, 40, 1-12.
CrossRef - Bennett, J. E.; Dolin, R.; Blaser, M. J. Principles and practice of infectious diseases. Philadelphia. Churchill Livingstone Elsevier. 2014, 246-270.
- Bennett, J. E.; Dolin, R.; Blaser, M. J. Principles and practice of infectious diseases. Philadelphia. Churchill Livingstone Elsevier. 2010, 346-354.
- Hans, M.; Lowman, A. Curr. Opin. Solid State Mater. Sci., 2002, 6, 319-327.
CrossRef - Swenson, J.; Facklam, R.; Thornsberry, C. Antimicrob. Agents Chemother., 1990, 34, 543-549.
CrossRef - Zinutti, C.; Barberi-Heyob, M.; Hoffman, M.; Maincent, P. Int. J. Pharm., 1998, 166, 231-234.
CrossRef - Freytag, T.; Dashevsky, A.; Tillman, L.; Hardee, G.; Bodmeier, R. J. Control. Release, 2000, 69, 197-207.
CrossRef - Craig, C. R.; Stitzel, R. E. pharmacology. Philadelphia. Lippincott Williams & Wilkins. 2004, 369-420.
- Reynolds, P. E. Eur. J. Clin. Microbiol. Infect. Dis., 1989, 8, 943-950.
CrossRef - Kamienski, M.; Keogh, J. pharmacology demystified. New York. McGraw Hill Professional. 2006, 203-250.
- Rowland, M.; Tozer, T. N. clinical pharmacokinetics and pharmacodynamics concepts and applications. Philadelphia. Lippincott Williams and Wilkins. 2005, 73-217.
- Shargel, L.; Wu-Pong, S.; Yu, A. B. Applied Biopharmaceutics And Pharmacokinetics. New York. McGraw-Hill. 2012, 625-641.
- Hussain, N.; Jaitley, V.; Florence, A. T. Adv. Drug Deliv. Rev., 2001, 50, 107-142.
CrossRef - De Jaeghere, F.; Doilker, E.; Gurny, R. Nanoparticles. In: Encyclopedia of Control Drug Delivery (ed.E. Mathiowitz). New York. John Wiely And Sons Inc. 1999, 641-664.
- Jelvehgari, M.; Valizadeh, H.; Rezapour, M.; Nokhodchi, A. Pharm. Dev. Technol., 2010, 15, 71-79.
CrossRef - Benoit, J.-P.; Faisant, N.; Venier-Julienne, M.-C.; Menei, P. J. Control. Release, 2000, 65, 285-296.
CrossRef - Lockman, P.; Mumper, R.; Khan, M.; Allen, D. Drug Dev. Ind. Pharm., 2002, 28, 1-13.
CrossRef - Xia, X.; Hu, Z.; Marquez, M. J. Control. Release, 2005, 103, 21-30.
CrossRef - Okochi, H.; Nakano, M. Adv. Drug Deliv. Rev., 2000, 45, 5-26.
CrossRef - Comoglu, T.; Gönül, N.; Baykara, T. Il Farmaco. 2003, 58, 101-106.
CrossRef - Bogataj, M.; Mrhar, A.; Kristl, A.; Kozjek, F. J. Microencapsul., 1991, 8, 401-406.
CrossRef - Honary, S.; Zahir, F. Trop J Pharm Res., 2013, 12, 265-273.
- Pazè, C.; Sazak, B.; Zecchina, A.; Dwyer, J. J. Phys. Chem. B., 1999, 103, 9978-9986.
CrossRef - Silverajah, V.; Ibrahim, N. A.; Zainuddin, N.; Yunus, W. M. Z. W.; Hassan, H. A. Molecules, 2012, 17, 11729-11747.
CrossRef - Jung, T.; Kamm, W.; Breitenbach, A.; Kaiserling, E.; Xiao, J.; Kissel, T. Eur. J. Pharm. Biopharm., 2000, 50, 147-160.
CrossRef - Kumar, N.; Ravikumar, M. N.; Domb, A. Adv. Drug Deliv. Rev., 2001, 53, 23-44.
CrossRef - Lachman, L.; Lieberman, H. A.; Kanig, J. L. The theory and practice of industrial pharmacy. Mumbai. Varghese Publishing House. Lea & Febiger. 1986, 760-802.
- Loveymi, B. D.; Jelvehgari, M.; Zakeri-Milani, P.; Valizadeh, H. Iran J Pharm Res., 2012, 11, 1001-1012.
- Valizadeh, H.; Zakeri-Milani, P.; Barzegar-Jalali, M.; Mohammadi, G.; Danesh-Bahreini, M. A.; Adibkia, K. Drug Dev. Ind. Pharm., 2007, 33, 45-56.
CrossRef - Perumal, D. Int. J. Pharm., 2001, 218, 1-11.
CrossRef
Accepted on: March 13, 2017


ISSN Online: 2231-5039

![]()


