Effect of Al13 Polycation Grafting on Apple Wastes Activated Carbon That Have A Porous Structure
Zoubida Marsa1, Chafia Bouchelta1, Nassima Ramdane1, Med Salah Medjram1 and Pierre Magri2
1Laboratory LGCES, Faculty of Technology, Skikda 20 Août 1955 University, El-Hadaeik Road, P.O. Box 26, Skikda 21000, Algeria.
2Laboratory LCP-A2MC, Lorraine University, 1bd Arago Metz France.
Corresponding Author E-mail: medjram_ms@yahoo.fr
DOI : http://dx.doi.org/10.13005/ojc/330207
Article Received on : January 28, 2017
Article Accepted on : April 04, 2017
Using physical activation, modified apple wastes with Al13 polycation were utilized such a feedstock’s for activated carbon production .thence, The characteristics of synthesized materials were: N2 adsorption/desorption , Scanning electron microscopy, and Fourier-transform infrared analyses.AS a beginning, one studied the effect of Al13 grafting on textural and chemical surface characteristics of activate,d carbons- Al13 generated . The increasing Al13 content has major inffluences on the porous structure of the prepared activated carbon; it causes more structurale and intensifies the surface zone and the pore volume (484 m2/g, micropore area of 400 m2/g and microporous volume of 0.185 cm3/g is the best surface area).ALSO The methyl orange adsorption performance of the received adsorbent was investigated to identify the role of Al13, especially its particular structure and high positive charge (+7). Adsorption performance of the grafted activated carbon was significantly enhanced. Raising charges at carbons materials surface by Al13 grafting improvedthe methyl orange adsorption kinetics. The adsorption data was relevant to Langmuir, Freundlich and Temkin models. The results indicated that the adsorption data belonging better to the Langmuir isotherm model. The prepared activated carbon- Al13 founded to be an efficient material for anionic dye removed from wastewater.
KEYWORDS:Apple wastes; modified activated carbon; Al13; Physical activation; Adsorption; Methyl orange
Download this article as:| Copy the following to cite this article: Marsa Z, Bouchelta C, Ramdane N, Medjram M. S, Magri P. Effect of Al13 Polycation Grafting on Apple Wastes Activated Carbon That Have A Porous Structure. Orient J Chem 2017;33(2). |
| Copy the following to cite this URL: Marsa Z, Bouchelta C, Ramdane N, Medjram M. S, Magri P. Effect of Al13 Polycation Grafting on Apple Wastes Activated Carbon That Have A Porous Structure. Orient J Chem 2017;33(2). Available from: http://www.orientjchem.org/?p=31700 |
Introduction
Activated carbon is regarded as an oldest adsorbent known in air pollution control and wastewater treatment .nevertheless, the use of this adsorbent for depollution processes is considerably restricted because it is very costly . Therefore, researchers are searching the substitution of this expensive adsorbent by a decreased-cost adsorbents prepared from different agricultural, industrial and local wastes which are abundant and cheap. Many agricultural wastes have been explored as decreased-cost adsorbent. Some of them comprise: cherry stones [1], olive stones [2–5], oil palm stones [6,7], apricot stones [8,9], sugar cane bagasse [10,11], nutshells [12], pecan shells [13–14], date stones [15,16], and peels of many fruits like orange [17], banana [18,19], pomegranate peel [20], yellow passion fruit and mandarin [21], beet pulp [22], grape seed [23], and apple [24]. Apples constitute one of the most plentiful fruits, with a world production of 68.3 million metric tons for 2005. Although, about 12% of the production is destined to the manufacturing of apples juice and cider. In the other hand, the solid residue from pressing apples (apple pulp) represents more than 12 wt% of the fruit. Hence , large quantities of about 0.84 Mt of apple pulp are produced every year all over the world [25]. This by-product has many applications like: antioxidants production [26-28], hydrogen production [29], extraction of lactic acid [30] and pectin [31], animal feed [32], and activated carbons [24].whereas, many studies have been done by Suarez-Garcia et al. for the feasibility of production of activated carbon from apple peel by using the chemical activation with phosphoric acid [24, 33, 34]. Nevertheless, the preparation of activated carbon from apple wastes by physical activation has never been studied previously and especially a preparation of grafted apple wastes activated carbon using Al13 polycation in order to improve the surface and structural properties of the original materials. Al13 was widely used because of its specific structure, high molecular weight, and high positive charge. The objective of this study is to prepare a modified activated carbon with Al13 polycation from apple wastes by using the physical activation process under steam in a fixed-bed reactor. A particular attention has been paid to the effects of grafting Al13 on porosity development and on the increase of activated carbon adsorption performance.well, To investigate the effects of Al13 on the adsorption performance of the prepared activated carbons, the removal methyl orange (with negative charges) from aqueous solution on the modified decreased-cost adsorbents (with more positive charges after Al13 grafting) were learned.in addition the equilibrium of the adsorption was depicted by Temkin,Langmui,Freundlish models.
Experimental
The Raw Apple Wastes (AW)
The wastes of various sorts of Apple were provided from Algerian juice manufactories .for one week ,the primary matter had firstly to be air-dried at room temperature. then dried at 110 °C for about 48 h.Analysis of apple wastes indicated that : pH (4.18), apparent density (0.60 g/cm3), moisture (5.6 %), ash (3.8%) and volatile matter (79%), were implemented.
However inorganic elements was defined by Suarez-Garcia et al. (3.3% in dry weight) [35]. Suarez-Garcia also studied the elemental and the biopolymer analysis (wt.%, db.) of apple wastes. The results pointed out that it is formed of 49.56% carbon, 8.43% hydrogen, 38.85% oxygen and 0.97% nitrogen. Respectively The value for hollocellulose and lignin was 44% and 17.3% , 6.7% soluble in organic solvents and 31.3% soluble in water [24, 35]. When we have examined the proximate and chemical analysis of apple wastes, we can deduce that the preparation of activated carbon were promoted by their lignocellulosic composition.
Preparation of Al13
Al13 is produced by the hydrolysis of aluminum chloride. This stage is a slow process of hydrolysis with a ranging ratio of OH/Al between 2.2 to 2.8 giving almost a pure solution of the polycation Al13 [36-37].
The solution of Al13 was synthesized in laboratory. The experimental procedure was described in our previous works [38-39] by respecting the molar report OH/Al = 2.2. while putting in a beaker in thermostatic bath for 20 minutes at 70°C, 100 ml of aluminum chloride solution (AlCl3 . 6H2O) 0.25 M, and by slowly adding of 240 ml of soda solution (NaOH) 0,25 M, with a vigorous agitating and respecting the NaOH flow (2 ml/min), in order to avoid the sursaturation of the hydroxyls ions. Then let cool until 20°C, with a pH between 5 and 6. Add 280 ml ammonium oxalate 0.1 M, and let precipitate 24 hours. Filter and wash with deionized water. Dry with the free air. Using this standard method, the resulting solution will contain 90-95 % of the polycation Al13.In fact,many studies using the nuclear magnetic resonance spectroscopy (NMR), provided the proof of its existence and allowed the aluminum speciation [40-46].
Preparation of Adsorbents
Apple wastes were mixed with Al13 polycation solutions prepared at different concentrations (40, 60 and 80 wt.%) in a ratio of 1g of precursor per 4 ml of solution. The impregnated samples were first stirred for 24 h to introduce the polycation in the materials. Then, we used the distilled water to wash the impregnated material several times to dismiss excess electrolytes and dried at 80°C.
Activated carbons were prepared from modified apple wastes- Al13 by pyrolysis under nitrogen flow and activation under water vapour. Pyrolysis of the grafted material was carried out with a horizontal tubular furnace (length of 450 mm and internal diameter of 65 mm). The reactor was a quartz tube (length of 750 mm and internal diameter of 35 mm), which was placed in the furnace. The schematic diagram of the experimental setup was presented in our previous work [47].
Passing to the pyrolysis step, about 10 g of dried apple wastes- Al13 (40, 60 and 80 wt. %) were placed in the middle of the reactor .we used different pyrolysis temperatures of 400,500,600, 700 and 800°C. Nitrogen flow rate was of 100 cm3 min-1 and heating rate was of 10°C min-1 for all the samples. Once the pyrolysis temperature was reached, sample was maintained at this one for 1 h. The resulting works were then physically activated at 800°C for 4 h under 10°C minutes-1 degree of temperature 100 cm3/ minutes nitrogen circulation degree saturated in steam after passing through the water saturator heated at 80°C. So, the water partial pressure was of 474 hPa. After activation, the model was cooled to ambient temperature under N2 flow rate. The received activated carbons are indicated AAW- Al13 40 %, AAW- Al13 60 %, AAW- Al13 80 %.
Characterization
We had examined the raw and activated carbon produced from apple wastes Al13applying nitrogen adsorption-desorption at – 196°C, Scanning electron microscopy (SEM) and FTIR spectroscopy. The indicators used for determining the maximum activated carbon were the surface area and the porous volume. These values were denoted by adsorption of nitrogen at -196 °C by means of a commercial manometric sorptometer (micrometrics ASAP 2020 Surface Area and Porosity Analyzer). Before the adsorption, the model were out-gassed under vacuum at 200 °C for 3 h. we analyzed adsorption isotherms by using the Brunauer–Emmett–Teller equation (BET) to compute the specific surface area (SBET). The volume of micropore (VDR-µ) was recognized from the Dubinin–Radushkevich equation (DR) [28]. The pore size distribution: BJH adsorption mean pore diameter (ApdBJH), and BJH Adsorption accumulated surface area of pores (SBJH-cp) between 1.7 and 300 nm using the Barrett-Joyner-Halenda (BJH) model we can determine the diameter using the t-method we can calculated the external surface area (Stext),micropore area (St-u)and the micropore volume(Vt-u) .The cross-sectional area of nitrogen molecule was taken equal to 0.162 nm2 and the nitrogen adsorbed was regarded as a liquid which has a density of 0.8081 g/cm3 at -196 °C.
The morphology of the materials was examined using scanning electron microscopy (VEGA3 TESCAN).
Chemical propereties was implemented by FTIR spectroscopy to determine the functional groups at the surface of raw, pyrolysed and activated carbons generated from apple wastes- Al13. Using the KBr wafer technique the infrared transmission spectra were recorded with a Brucker Equinox 55 spectrometer, from 400 to 4000 cm-1. Five hundred scans were taken with a 4 cm-1 resolution. Wafers were prepared from the mixture of 0,5 mg of the sample and 200 mg of KBr. This mixture was condensed in a manual hydraulic press at 59 MPa.
Adsorption Studies
Regardless of the Adsorption of methyl orange is considered as the most important important means of assessing removal capacity from the aqueous phase. The efficiency of the dismissal of dye: respectively methyl orange (MO) from aqueous solutions by AAW- Al13 80 % (prepared under the conditions of pyrolysis and activation temperatures of 800°C during 1 h and 4h for pyrolysis and activation , Nitrogen flow rate of 100 cm3 min-1, heating rate of 10°C min-1 and 80 wt.% Al13 content) was experimentally studied by the way of recording the equilibrium experiments and adsorption isotherms.
Equilibrium Studies
In the equilibrium study, about 0.1 g of AAW- Al13 80 % activated carbon was directly mixed with 1000 ml of methyl orange (MO) solution and agitated in a mechanical shaker at 200 rpm. In the favour of the determination of equilibrium time, the aqueous samples were taken at reset time intervals, and the concentration Ce (mg/l) of dye leftover in the aqueous phase were measured applying a double beam UV–VIS spectrophotometer (1605 SHIMADZU) at λmax 466 nm.
Adsorption Isotherm
Measuredly, Batch adsorption experiments were impemented in 500 ml glass-stoppered flask at a stable temperature (25°C). About 0.1 g of AAW- Al13 80 % was throughly mixed with 100 ml of methyl orange (MO) solution. The isotherms studies were performed by differing the initial (MO) concentrations from 1.2 to 300 mg/L. The melanges were continuously stirred (200 rpm), for 45 minutes.We have determine previously this equilibrium time from equilibrium experiments.
After such agitation, models of 5 ml were subjected to for analysis using UV-Visible spectrophotometer (1605 SHIMADZU) at λmax 466 nm to determine the residual concentration of dye in the aqueous phase. Using equation (1);
The adsorption capacity at time t, qt (mg/g),was calculated.
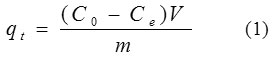
Where C0 and Ce (mg/L)are the liquid-phase concentrations of dye at initial and any time t, respectively. V is the volume of the solutions (L), and m is the mass of adsorbent used (g).
We have applied three isothermal models to the experimental data [48]. The adsorption isotherm point out how the adsorption molecules distribute between the liquid phase and the solid phase when the adsorption operation reaches an equilibrium state. The analysis of the isotherm data by fitting them to different isotherm models is an important step to find the suitable model that can be used for design objective.
Langmuir sample was applied to the experimental data. The Langmuir isotherm is focus on the estimation that the adsorption process takes place on sites having the same energy and each site can be busied by only one molecule. Besides the interactions between adsorbed ions are neglected. The linear expression for the Langmuir isotherm is:
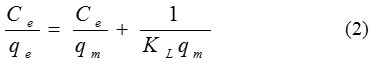
When Ce is the equilibrium concentration of dye (mg/L) and qe is the quantity of the dye molecules adsorbed (mg/L). qm and KL are the maximal adsorption capacity (mg/g) and the Langmuir equilibrium constant (L/g), respectively.
The Freundlich model is an empirical equation estimating that that the adsorption process takes place on a heterogeneous surface through a multilayer adsorption mechanism and adsorption ability is related to the concentration of dyes at equilibrium. The Freundlich model is given by the linear equation:
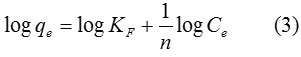
When qe is the amount adsorbed (mg/g), and Ce is the equilibrium concentration of the adsorbate (mg/L). KF is the Freundlich adsorption constant according to adsorption capacity of the adsorbent (mg/g) and 1/n is the adsorption intensity. Values of n > 1 represent suitable adsorption condition.
The Temkin model considers the impacts of indirect adsorbate–adsorbente interactions on adsorption, and suggests that the heat of adsorption of all the molecules in the layer would augment linearly with coverage due to these interactions [30]. The linear form of Temkin isotherm is expressed as:
qe = B ln A + B ln Ce (4)
Where B is the Temkin stable is relevant to heat of adsorption. B = (q0RT)/b, T is the absolute temperature in Kelvin and R is the universal gas constant, 8.314 J. (mol. K)−1. The constant b (KJ. mol−1) is related to the heat of adsorption. A is the equilibrium curving constant (L/mg). The constant A and B can be determined by a plot of qe versus ln Ce.
Results and Discussion
Determination of the Optimal Pyrolysis Temperature
The product of pyrolysed or/and activated apple wastes- Al13 can be determined as the ratio of the mass of pyrolysed or/and activated apple wastes- Al13 upon the mass of the raw grafted material.
Pyrolysis experiments at different temperature have been performed in order to determine the temperature at which the yield is the lowest i.e. the failure of mass after pyrolysis is maximal.
Table 1 indicates that the increase of temperature makes the yield of pyrolysed apple wastes- Al13 decreases from 400to 700°C. This is the result of the partial decomposition of apple wastes. Adapted from a study of Suarez-Garcia et al., four weight loss steps can be identified in the TG/DTG curves of apple pulp [38], the first step happens at 120°C, and can be attributed to moisture release. A second step occurs at 233°C, and is attributable to lowering of hemicellulose and organic and/or aqueous extractives. The third step, at 328°C, would correspond to thermal degradation of cellulose. The last step overlaps with the two last ones and its property temperatures cannot be vary so clearly. This weight loss step, ascribable to lignin degradation, seems with maximal weight loss rate at 406°C. The lowest yield is obtained between 700 and 800°C. The optimal pyrolysis temperature is then fixed at 700°C. All the samples are pyrolysed at this temperature as follows;
Table 1: Effect of pyrolysis and activation temperatures on the yield of pyrolysed and activated apple wastes- Al13.
|
Temperature (°C) |
Yield (wt.%) |
|
| Pyrolysis | 400500600700800 | 3936343332 |
| Activation | 700800900 | 191516 |
Table 1, also informs the results obtained for Al13 80 % grafted samples pyrolysed at 700°C and activated below steam at various activation temperatures and constant hold time (4 h). Results indicated that the yield minimize after activation, because more volatile maters are released after activation. Indeed, as the activation temperature increases from 700 to 800°C, the yield of activated carbon reduces. This is attributed to the removal of volatile matters resulting from the decomposition of significant compounds of apple waste i.e. cellulose and hemicellulose. whereas, the decomposition of hemicellulose and cellulose and greafting Al13 polycation improve the pore diffusion and creates porosity in apple wastes that permit a better diffusion of oxygen into the particles. Thus, lignin, the third component of apple wastes, which the decomposition is more difficult, can better react with the oxidizing agent. At 900°C, the yield increase slightly. Activation of apple wastes at increasing heat does not lead to a decreased yield.
N2 Adsorption-Desorption Isotherms
Figures 1-4 disclose the form and behavior of the N2 adsorption-desorption isotherms, of the t- and DR-plots, and the micropore size distribution from BJH sample, for the series of apple wastes- Al13 activated carbons (40, 60 and 80 % Al13 content). Table 2 resumes the values of the structural parameters which characterize the porous structure of the samples, derived from the N2 adsorption-desorption isotherms at -196°C.
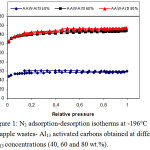 |
Figure 1: N2 adsorption-desorption isotherms at -196 °C of apple wastes- Al13 activated carbons obtained at different Al13 concentrations (40, 60 and 80 wt.%). Click here to View figure |
Figure 1 pointed out the N2 adsorption-desorption isotherms at -196°C, on apple wastes- Al13 activated carbons obtained with different Al13 concentrations (40, 60 and 80 wt.%). All the adsorption isotherms have the type I shape typical for materials with a well-developed microporosity.whereas, a small upward curving at high relative pressure denote that some meso- and/or macropores are evolved inside activated carbon obtained at 60 and 80 % Al13 content.
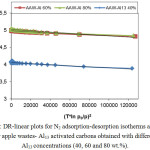 |
Figure 2: DR-linear plots for N2 adsorption-desorption isotherms at -196°C for apple wastes- Al13 activated carbons obtained with different Al13 concentrations (40, 60 and 80 wt.%). Click here to View figure |
However, the DR-plots (Figure 2) implys a type C behavior, with a small upward bending at high pressures, corresponding to low values of (T*ln p0/p)2 which results from adsorption in meso and/or macropores.
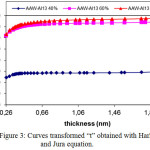 |
Figure 3: Curves transformed “t” obtained with Harkins and Jura equation. Click here to View figure |
The t-plots (Figure 3) indicates that from a thickness (computed by Harkins and Jura equation), we can deduce the particular external area (St-ext) responsible of multilayer adsorption, which characterised type II isotherm besides to type I isotherm. The values of the external area (St-ext) increase gradually with the increase of Al13 content from 40 to 80 % because the polycation is fixed at the surface and introduced in the porous structure after pyrolysis and activation, so, more specific surface is developed in the materials.
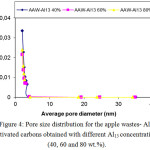 |
Figure 4: Pore size distribution for the apple wastes- Al13 activated carbons obtained with different Al13 concentrations (40, 60 and 80 wt.%). Click here to View figure |
The distribution of Pore extent is regarded to be a good indicator of the uniformity of porous materials. Figure 4 show the pore extent distributions of activated carbons from apple wastes- Al13 obtained at different Al13 concentrations (40, 60 and 80 wt.%). The great augmentation of all pore extent distribution bending for pore diameters of about 2 (nm) indicated the formation of relatively uniform micropores in majority of the structure of the activated materials as stated by the classification adopted by the International Union of Pure and Applied Chemistry (IUPAC). This augmentation came to be significant in the grafted activated carbons prepared with 60 and 80 % of Al13. In fact, the values of (VDR-µ), (Vt-µ) and (St-µ) and (SBET) presented in Table 2 are higher for AAW- Al13 60 % and AAW- Al13 80 %. Nevertheless, only a tiny increase is observed in the values of these parameters at 80 wt.% of Al13. For all the samples, the BJH average pore diameters (ApdBJH) are closer to 2 nm.
From the derived textural data (see Table 2) it copmlys that the increase in Al13 content from 40 to 60 % causes an important development in the surface area and porosity of the prepared samples.Hence; This phenomenon signes that the Al13 species essentially contributed to the remarcable improvement of the surface areas of the modified apple wastes activated carbons. When the Al13 species were introduced into the apple wastes under high activation temperature, the compounds of apple wastes hemicellulose, cellulose and lignin are decomposed under the activating action of H2O + N2, so the native cations were replaced by polyaluminum. Higher Al13 content favor the occupation of more sites and consequently increased the surface area.
Table 2: Textural parameters deduced from N2 adsorption at -196°C on apple wastes-Al13 activated carbons prepared with different Al13 concentrations (40, 60 and 80 wt.%).
|
Samples |
AAW-Al13 40 % |
AAW-Al13 60 % |
AAW-Al13 80 % |
| SBET (m2 g-1)VDR-µ (cm3 g-1)St-ext (m2 g-1)St-µ (m2 g-1)Vt-µ (cm3 g-1)SBJH-cp (m2 g-1)ApdBJH (nm) |
189 0.047 27 162 0.075 10.55 1.96 |
471 0.167 73 398 0.184 38.65 1.95 |
484 0.169 84 400 0.186 47.92 1.98 |
Conserning the three prepared activated carbons,we noticed ordinarily that the values of the micropore area (St-µ) are greater than the values of the external area (St-ext) because these activated carbons exhibited type I adsorption isotherms typical of predominant microporous structure.
Scanning Electron Microscopy
Figure 5 pointed out that:the Scanning electron micrographs accomplished on pyrolysed apple wastes-Al13 (PAW-Al13) and activated apple wastes- Al13 with different Al13 concentrations (40, 60 and 80 wt.%). (AAW-Al13 40 %, AAW-Al13 60 % and AAW-Al13 80 %) . The study of the pyrolysed apple wastes-Al13 structure (Figure 5.a) points out the presence of a few macropores of various size and geometry. Whereas, the augmentation of Al13 concentrations (Figure 5.b, 5.c, 5.d) create gradual and more regular macroporosity in the materials structures.
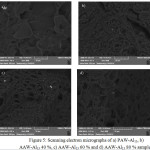 |
Figure 5: Scanning electron micrographs of a) PAW-Al13, b) AAW-Al13 40 %, c) AAW-Al13 60 % and d) AAW-Al13 80 % samples. Click here to View figure |
Figure 6 pointed out that: The FTIR spectra of natural, pyrolysed and activated apple wastes grafted with Al13 and the assignments of IR absorption bands are gathered in Table 3.Also The IR spectrum of natural apple wastes agrees with the results of Suarez-Garcia et al. [49]. This later used infrared spectroscopy in order to compare the behaviour of apple pulp, alone and impregnated with 60 wt.% H3PO4. The assignment of absorption bands indicates that the functional groups carboxyl, ester, aromatic, alcohol, alkene, hydroxyl, ether and carboxyl are ubiquitous in the raw material. That is in conformity with the composition of apple wastes, which are essentially comprised of : hemicelluloses, lignin and, cellulose,.
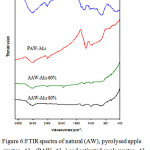 |
Figure 6: FTIR spectra of natural (AW), pyrolysed apple wastes- Al13 (PAW- Al13) and activated apple wastes- Al13 with different Al13 concentrations (AAW- Al13 60 % and AAW-Al13 80 %). Click here to View figure |
IR Spectra obtained for pyrolysed apple wastes-Al13 pointed out that after carbonisation under nitrogen flow, the bands at 3400, 2910, 2840, 1740 and 1035 cm-1 initially present in the raw material disappear. This indicates a decrease of water and aliphatic compound contents. New band appears at 1580 cm-1. This band is assigned to C=C skeletal stretch in condensed aromatic system [49]. This indicates an increase of aromaticity during pyrolysis, which is probably due to the decomposition or cocking of several unsaturated chemical structures.
Table 3: Assignments of IR absorption bands for AW, PAW- Al13, AAW- Al13 60 % and AAW- Al13 80 %.
| σ (cm−1) |
Assignment |
Comment |
| 34002910284017401640158014301375
1336 1240 1150 1060 1035 826-743-690 984 807 715 400-600 |
ν (O-H)νas (C–H)νs (C–H)ν (C=O)ν (C=C)ν (C=C)δ (CH2)δ (C-H)
δ (C-H) ν as (C-O) ν (C-O-C), ν (C=C), methoxyl–O–CH3 ν (C-O), ν (C-C), δ (OCH) ν (C-O) δ (C-H) ν (C-C) |
Stretching in hydroxyl groupsStretching in alkyl groupsStretching in alkyl groupsStretching in esters [38-39]Aromatic skeletal stretching bandsAssigned to skeletal stretch in condensed aromatic systemStretching in ester [39]C-H Asymetric and symetric bendingC-H Asymetric bending [39]Stretching of aromatic ethers, ester and phenols
Stretching vibration in pyranose ring skeletal or stretching in aromatic ring C-O, C-C and OCH stretching Stretching in alcohol Aromatic C–H out-of-plane bending vibrations Al-OH-Al stretching Al-OOH Al-OH Stretching in C–C |
After activation, the IR absorption bands exhibit a lower intensity than after pyrolysis. This change in intensity is the result of (i) the activating action of H2O + N2 at high temperature, oxygen and hydrogen groups are decomposed and extracted from the surface and (ii) to the introduction of Al13 species in the activated apple wastes surface.
Capacity of Adsorption of Methyl Orange
Studies of Equilibrium
Figure 7 pointed out that: the impact of contact time on batch adsorption of MO on AAW-Al13 80 %. Adsorption of the studied dye can be dpicted by a two stage kinetic behaviour, the first with a rapid initial dye adsorption between 1 and 45 minutes followed later on by a much slower rate. The second augments in contact time has a negligible effect on the quantities of adsorption. This phenomenon can be explained as follow: during adsorption of dyes, principally the dye molecules arrived to the boundary layer, afterward they had to disperse into the adsorbent surface, and finally, they had to disperse into the porous structure of adsorbent. Therefore, this phenomenon will take a relatively longer contact time. According to these results, the contact time was fixed at 45 minutes.
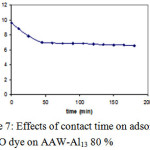 |
Figure 7: Effects of contact time on adsorption of MO dye on AAW-Al13 80 % Click here to View figure |
Adsorption Isotherms
The Adsorption isotherm of MO on AAW-Al13 80 % is indicated in Figure 8. The obtained isotherm was part of type I, that is given by microporous adsorbents with a relatively tiny external surface. Maximal dye adsorption ability determined at the plateau of the isotherm is 71 mg/g. The highly improved capacity of AAW-Al13 80 % may be attributed to its large BET surface area, micropore surface area, the high positive charge and micropore volume of Al13 species that induce certainly higher electrostatic attractions for MO negative charges.
Using Freundlish, and Temkin models) figure 8) The equilibrium adsorption data were interpreted ). Values of Langmuir, Freundlich and Temkin parameters are mentioned in Table 4.
![Figure 8. Modeling of adsorption isotherm of MO on AAW-Al13 80 % [symbols: experiments; solid line: Langmuir model; broken line: Freundlich model; line with symbol: Temkin].](http://www.orientjchem.org/wp-content/uploads/2017/04/Vol33No2_Effe_Zoub_fig8-150x150.jpg) |
Figure 8: Modeling of adsorption isotherm of MO on AAW-Al13 80 % [symbols: experiments; solid line: Langmuir model; broken line: Freundlich model; line with symbol: Temkin]. Click here to View figure |
Table 4. Langmuir, Freundlich and Temkin parameters for the adsorption of MO on AAW-Al13 80 %.
| Models Parameters |
MO |
| Langmuir qm (mg/g)KL (L/mg) R2 FreundlichKF (mg/g)n R2 TemkinA (L/mg)Bb (KJ.mol−1)R2 | 710.0620.980.551.220.951.486.43320.85 |
Figure 8 indicated that there is an acceptable adaptation between experiments and Langmuir model . The comparison of correlation coefficients (R2) of the linearized form of both equations mentions that the Langmuir model yield a better fit for the experimental equilibrium adsorption data than the Freundlich and Temkin models. This proposes the monolayer coverage of the surface of the studied activated carbons. The n value in Freundlich model were superior to 1 (n > 1), indicating a good adsorption of MO on the prepared activated carbon.
Conclusion
This work shows that modified apple wastes with Al13 polycation can be used as precursor to produce activated carbon with a rather well-developed porosity by pyrolysis and physical activation using water vapour. The conditions of 80 % Al13 concentration, 700°C pyrolysis temperature for 1 h hold time with a 10°C min-1 heating rate below 100 cm3 min-1 nitrogen flowing rate, and 800°C activation temperature for 4 h hold time are sufficient to produce an adsorbent with BET surface area of 484 m2/g and micropore volume of 0.17 cm3 g-1. The yield of activated carbon is conversely related to pyrolysis and activation temperatures. SEM examination of pyrolysed and activated apple wastes-Al13 shows that the porosity became more uniform and increases gradually with increasing in Al13 content. Nitrogen adsorption indicated that the activated carbons received are initially microporous. Thence, FTIR spectroscopy pointed out that many oxygen-containing functional groups are existed in the raw material while aromatic structures are enhanced after pyrolysis and activation. Activated carbon prepared from apple wastes- Al13 80 % was utilized as an adsorbent for dismissing methyl orange from aqueous solution. The maximum adsorption capacity for MO dye on the prepared activated carbon was arrived after 45 min and was 71 mg/g. Hence ,the positive charge of the grafted polycation promotes the elimination of the anionic dye from water. The equilibrium data fitted well in the Langmuir model of adsorption, implying homogeneous and monolayer adsorption.
References
- Duran-Valle, J.C.; Gomez-Corzo, M.; Pastor-Villegas, J.; Gomez-Serrano, V.; Study of cherry stones as row material in preparation of carbonaceous adsorbents, J. Anal. Appl. Pyrolysis 2005, 73, 59–67.
CrossRef - Martinez, M.L.; Torres, M.M.; Guzman, C.A.; Maestri, D.M.; Preparation and charachteristics of activated carbon from olive stones and walnut shells, Ind. Crops Prod. 2006, 23, 23–28.
CrossRef - Rios, R.V.R.A.; Martinez-Escandell, M.; Molina-Sabio, M.; Rodriguez- Reinoso, F.; Carbon foam prepared by pyrolysis of olive stones under steam, Carbon 2006, 44, 1448–1454.
CrossRef - El-Sheikh, A.H.; Newman, A.P.; Al-Daffaee, H.K.; Phull, S.; Cresswell, N.; Characterization of activated carbon prepared from a single cultivar of Jordanian Olive stones by chemical and physicochemical techniques, J. Anal. Appl. Pyrolysis 2004, 71, 151–164.
CrossRef - Gonzalez, M.T.; Rodrgljez-Reinoso, F.; Garcia, A.N.; Marcilla, A.; CO2 activation of olive stones carbonized under different experimental conditions, Carbon 1997, 35 (1) 159–165.
CrossRef - Guo, J.; Lua, A.C.; Activated carbon prepared from oil palm stone by one-step CO2 activation for gaseous pollutant removal, Carbon 2000, 38, 1985–1993.
CrossRef - Guo, J.; Lua, A.C.; Textural and chemical characterisations of activated carbon prepared from oil-palm stone with H2SO4 and KOH impregnation, Microporous Mesoporous Mater. 1999, 32, 111–117.
CrossRef - Sentorun-Shalaby, C.; Ucak-Astarlıoglu, M.G.; Artok, L.; Sarici, C.; Preparation and characterisation of activated carbons by one-step steam pyrolysis/activation from abricot sotones, Microporous Mesoporous Mater. 2006, 88, 126–134.
CrossRef - Gergova, K.; Eser, S.; Effects of activation method on the pore structure of activated carbons from apricot stones, Carbon 1996, 34 (7), 879–888.
CrossRef - Ahmedna, M.; Marshall, W. E.; Rao, R. M.; Surface properties of granular activated carbons from agricultural by-products and their effects on raw sugar decolorization, Bioresour. Technol. 2000, 71, 103-112.
CrossRef - Tsai, W. T.; Lee, M. K.; Chang, Y. M.; Fast pyrolysis of rice straw, sugarcane bagasse and coconut shell in an induction-heating reactor, J. Anal. Appl. Pyrolysis 2006, 76, 230–237.
CrossRef - Dawson, E.A.; Parkes, G.M.B.; Barnes, P.A.; Chinn, M.J.; An investigation of the porosity of carbons prepared by constant rate activation in air, Carbon 2003, 41, 571–578.
CrossRef - Guo, Y.; Rockstraw, D.A.; Physicochemical properties of carbons prepared from pecan shell by phosphoric acid activation, Bioresour. Technol. 2007, 98, 1513–1521.
CrossRef - Ng, C.; Marshall, W.E.; Rao, R.M.; Bansode, R.R.; Losso, J.N.; Activated carbon from pecan shell: process description and economic analysis, Ind. Crops Prod. 2003, 17, 209-217.
CrossRef - Haimour, N.M.; Emeish, S.; Utilisation of date stones for production of activated carbon using phosphorique acid, Waste Manage. 2006, 26 , 651–660.
CrossRef - Girgis, B.S.; El-Hendawy, A.; Porosity development in activated carbons obtained from date pits under chemical activation with phosphoric acid, Microporous Mesoporous Mater. 2002, 52 , 105–117.
CrossRef - Rosas, J.M.; Bedia, J.; Rodriguez-Mirasol, J.; Cordero, T.; On the preparation and characterisation of chars and activated carbons from orange skin, Fuel Process. Technol 2010, 91, 1345-1354.
CrossRef - Achak, M.; Hafidi, A.; Ouazzani, N.; Sayadi, S., Mandi, L.; Low cost biosorbent “banana peel” for the removal of phenolic compounds from olive mill wastewater: Kinetic and equilibrium studies, J. Hazard. Mater2009, 166, 117–125.
CrossRef - Kadirvelu, K.; Kavipriya, M.; Karthika, C.; Radhika, M.; Vennilamani, N.; Pattabhi, S.; Utilization of various agricultural wastes for activated carbon preparation and application for the removal of dyes and metal ions from aqueous solutions, Bioresour. Technol. 2003, 87, 129–132.
CrossRef - Kamal Amin, N.; Removal of direct blue-106 dye from aqueous solution using new activated carbons developed from pomegranate peel: Adsorption equilibrium and kinetics, J. Hazard. Mater. 2009, 165, 52–62.
CrossRef - Pavan, F. A.; Gushikem, Y.;. Mazzocato, A. C.; Dias, S. L.P.; Lima, E. C.; Statistical design of experiments as a tool for optimizing the batch conditions to methylene blue biosorption on yellow passion fruit and mandarin peels, Dyes Pigments 2007, 72, 256-266.
CrossRef - Mudoga, H. L.; Yucel, H.; Kincal, N.S.; Decolorization of sugar syrups using commercial and sugar beet pulp based activated carbons, Bioresour. Technol. 2008, 99 3528–3533.
CrossRef - Ozçimen, D.; Ersoy-Meriçboyu, A.; Removal of copper from aqueous solutions by adsorption onto chestnut shell and grapeseed activated carbons, J. Hazard. Mater. 2009, 168, 1118–1125.
CrossRef - Suarez-Garcia, F.; Martinez-Alonso, A.; Tascon, J.M.D.; Pyrolysis of apple pulp: effect of operation conditions and chemical additives, J. Anal. Appl. Pyrolysis 2002, 62, 93–109.
CrossRef - Bhatnagar, A.; Sillanpaa, M., Utilization of agro-industrial and municipal waste materials as potential adsorbents for water treatment-A review, Chem. Eng. J. 2010, 157 277–296.
CrossRef - Virot, M.; Tomao, V.; Le Bourvellec, C.; Renard, C.M.C.G.; Chemat, F.; Towards the industrial production of antioxidants from food processing by-products with ultrasound-assisted extraction, Ultrasonics Sonochem. 2010, 17, 1066–1074.
CrossRef - Wijngaard, H. H., Brunton, N.; The optimisation of solid–liquid extraction of antioxidants from apple pomace by response surface methodology, J. Food Eng. 2010, 96, 134–140.
CrossRef - Suarez, B.; Alvarez, A.L.; Garcia, Y.D.; del Barrio, G.; Picinelli Lobo, A.; Parra, F.; Phenolic profiles, antioxidant activity and in vitro antiviral properties of apple pomace, Food Chem. 2010, 120, 339–342.
CrossRef - Doi, T.; Matsumoto, H.; Abe, J.; Morita, S.; Application of rice rhizosphere microflora for hydrogen production from apple pomace, International journal of hydrogen energy 2010, 35, 7369-7376.
CrossRef - Gullon, B.; Yanez, R.; Alonso, J.L.; Parajo, J.C.; Lactic acid production from apple pomace by sequential hydrolysis and fermentation, Bioressource technology 2008, 99, 308-319.
- Kumar, A.; Chauhan, G.S.; Extraction and characterization of pectin from apple pomace and its evaluation as lipase (steapsin) inhibitor, Carbohydrate Polymers 2010, 82, 454–459.
CrossRef - Joshi, V.K.; Sandhu, D.K.; Preparation and evaluation of an animal feed by-product produced by solid-state fermentation of apple pomace, Bioresour. Technol. 1996, 56, 251-255.
CrossRef - Suarez-Garcia, F.; Martinez-Alonso, A.; Tascon, J.M.D.; Pyrolysis of apple pulp: chemical activation with phosphoric acid, J. Anal. Appl. Pyrolysis 2002, 63, 283–301.
CrossRef - Suarez-Garcia, F.; Martinez-Alonso, A.;. Tascon, J.M.D.; Porous texture of activated carbons prepared by phosphoric acid activation of apple pulp, Letters to the editor / Carbon 2001, 39 ,1103 –1116.
- Suarez-Garcia, F.; Martinez-Alonso, A.; Fernandez llorent, M.; Tascon, J.M.D.; Inorganic matter characterization in vegetable biomass feedstocks, Fuel 2002, 81, 1161-1169.
CrossRef - Ohtsuka, Kunio.; Preparation and Properties of Two-Dimensional Microporous Pillared Interlayered Solids / Chem. Mater. 2001, 13, 704-710.
CrossRef - Liang-guo Yan, Xiao-quan Shan, Adsorption of cadmium onto Al13-pillared acid-activated montmorillonite / Journal of Hazardous Materials 2008, 156, 499–508.
CrossRef - Marsa, Z.; Ramdane, N.; Maghzili, B.; Rogalski, M.; Bouchelta, C.; Medjram, M.S.; Soltane, M.; Comparative study of the adsorption of phenol on Al13 and the bentonite from Mostagh-Algeria, Phys. Chem. News 2012, 64, 69-75.
- Marsa, Z. ; Ramdane, N. ; Medjram, M.S. ; Maghzili, B. ; Rogalski. M. ; Bouchelta, C.; Soltane. M.; Study of the adsorption of phenol on polycation Al13, Scientical environnement et santé 2014, 1 1281, 1-5.
- Ohtsuka, Kunio.; and Hayashi, Yoshimasa.; Incorporation of Low-dimensional Materials into the Two-dimensional Interlamellar Nanospace of a Pillared Interlayered Solid / Chem. Mater. 2001, 13, 704-710
CrossRef - Furrer, Gerhard.; Gfeller, Michael.; and Wehrli, Bernhard.; On the chemistry of the Keggin Al13 polymer: Kinetics of proton-promoted decomposition / Geochimica et Cosmochimica Acta, 1999, 63, 19/20 , 3069–3076.
CrossRef - Wang, Shan Li.; Wang, Ming, K.; Yu Min, Tzou.; Effect of temperatures on formation and transformation of hydrolytic aluminum in aqueous solutions / Colloids and Surfaces A: Physicochem. Eng. Aspects 2003, 231, 143–157.
CrossRef - Zhaoyang, Chen.; Zhaokun, Luan.; Zhiping, Jia,; Xiaosen, Li.; Study on the hydrolysis/precipitation behavior of Keggin Al13 and Al30 polymers in polyaluminum solutions / Journal of Environmental Management 2009, 90, 2831–2840.
CrossRef - Kazparda, V.; Lartigesa, B.S.; Frochotb, C.; d’Espinose de la Cailleriec, J.B.; Viriotb, M.L.; Portald, J.M.; Gornera, T.; Bersillona, J.L.; Fate of coagulant species and conformational effects during the aggregation of a model of a humic substance with Al13 polycations / Water Research 2006, 40, 1965 – 1974.
CrossRef - Molis, E.; Thomas, F.; Bottero, J. Y.; Barres, O.; Masion, A.; Chemical and Structural Transformation of Aggregated Al13 Polycations, Promoted by Salicylate Ligand Langmuir 1996, 12, 3195-3200.
- Shou, Zhao.; Chenghong, Feng.; Xiangning, Huang.; Baohua, Li.; Junfeng, Niu.; Zhenyao, Shen.; Role of uniform pore structure and high positive charges in the arsenate adsorption performance of Al13-modified montmorillonite, Journal of Hazardous Materials 2012, 203– 204, 317– 325.
- Bouchelta,C.; Medjram, M.S.; Bertrand, O.; Bellat, J.P.; Preparation and characterization of activated carbon from date stones by physical activation with steam, J. Anal. Appl. Pyrolysis 2008, 82, 70–77.
CrossRef - Do, D. D.; Adsorption Analysis : Equilibria and Kinetics. Imperial College Press, London, 1998.
- Suarez-Garcia, F.; Martinez-Alonso, A.; Tascon, J.M.D.; A comparative study of the thermal decomposition of apple pulp in the absence and presence of phosphoric acid, Polymer Degradation and Stability 2002, 75, 375–383.
CrossRef - Wilson, H.R.; Smith, C.A.; Kacurakova, M.; Saunders, K.P.; Wellnet, N.; The mechanical properties and molecular dynamics of plant cell wall polysaccharid studied by Fourier- Transform Infrared Spectroscopy, Plant Physiol. 2000, 124 (1), 397–406.
CrossRef

This work is licensed under a Creative Commons Attribution 4.0 International License.
![]()
A New Edition of Web of Science
Journal Impact Factor
2022: 0.5
Five Year: 0.8
Journal is Indexed in

Cabells Whitelist
![]()


