Development and Validation of RP-HPLC Method for Quantification of Berberine in Ethanol Fraction of Methanol Extract and Developed Formulation of Tinospora Cordifolia
Pacific Academy of Higher Education and Research University College of Pharmacy,Udaipur.
Corresponding Author E-mail: roopamdevaliya05@gmail.com
DOI : http://dx.doi.org/10.13005/ojc/330253
Download this article as:
![]()
Simple and precise RP-HPLC method was developed for quantification of berberine in ethanol fraction of methanol extract of Tinospora cordifolia and its formulation. In this, separation was achieved on a HPLC System (Shimadzu) Luna, C18 column. As mobile Phase acetonitrile and water (40:60) were used with a flow rate of 1ml/min and maximum absorbance was found at 266nm. In this we obtained calibration curve in the range of 20 - 640 μg/mL. The slope was 68734, intercept was 20563 and correlation coefficient was found to be 0.999. The limit of detection was 0.8 and limit of quantification was 1.7. For berberine the method was validated according to ICH guidelines. Method was highly precise and accurate because it shows low relative standard deviation as well as good % recovery values. Quantity of berberine was found was found to be 282.3 ppm. In tablet of 325mg.
KEYWORDS:Tinospora cordifolia; Berberine; RP-HPLC; formulation of the solid oral dosage form; Validation
Introduction
T. cordifolia belonging to Menispermaceae family, is also known as Guduchi, Amrita and Giloy. It showes a wide range of pharmacological effects such as general tonic, analgesic, hypoglycaemic and immunomodulatory agent.1-8. It contains alkaloids, glycosides, terpenoids, steroids, bitters and carbohydrates. It contains berberine, an isoqunoline alkaloid, present in roots, rhizomes and stem bark of plants. Berberine extracts have been reported to possess hepatoprotective and anti-inflammatory actions.9-14 Besides its significant antimicrobial activity, berberine is also effective (200 mg/kg/day) in ameliorating diabetic nephropathy in rats15-16. In some research papers analysis of berberine in Fork capsule and marketed tablet, were shown by using LC with UV detection. HPLC method development and validation for the berberine from Berberis aristata andStandardization and formulation of Tinospora Cordifolia Tablet. for polyherbal formulation HPLC conditions were also describe.. HPLC method determination of berberine in Coscinium fenestratum plant extract and RP-HPLC determination of berberine in homoeophatic formulation also reported17-20. In present study quantification of berberine was done by using acetonitrile and water as mobile phase and sensitive method was developed and validated as per ICH guidelines.
Material and Method
All the chemical and reagents used were of HPLC and analytical grade. Berberine, >99.0% purity was purchased from Sigma, (USA).
T. cordifolia stems were collected from the Bangrasia village (10 km from the Bhopal, and authenticated by the Botany Department Saifia Science college, Bhopal (M.P) and voucher specimens were deposited (420/ Bot./saf./14). Shade dried powder of stems of T. cordifolia were subjected for successive solvent extraction using Soxhlation method. On the basis of polarity index (PI), fractionation of methanol extract was done using benzene, ethyl acetate and ethanol by silica gel 60-80 mesh packed chromatographic column. The solvents were removed by distillation and last traces of solvents were removed under vacuum.
Development of formulation. cordifolia tablets were prepared by using spray dried powder of ethanol fraction of methanol extract by direct compression method using microcrystalline cellulose (MCC) and Pregelatinized starch (PGS). Talc used as lubricant and diluents, magnesium stearate used as glidant. The weight of prepared tablet was 325 mg.
Instrumentation and Chromatographic Condition
During RP-HPLC method development, chromatographic conditions adopted are summarized as table no 1.
Table 1: Chromatographic Parameters for berberin
| Column name | Hypersil ODS 5 microns(4.6 × 250mm, 5μm) |
| Flow rate | 1.0 ml per minute |
| Injection volume | 10 μL |
| Detector | UV at 266 nm using SPD–M10 AVP photodiode array detector |
| Temperature | 30oC |
| Mobile phase | Acetonitrile : water (40:60) |
Praration of Mobile Phase
To 40 part of acetonitrile and 60 part of water was mixed to get one liter of mobile phase and filtered through 0.22µm nylon membrane vaccum filteration and degassed by sonication.
Sample Preparation for HPLC
Preparation of Standard Solutions
Accurately weighed 10 mg of berberine was placed into a 10 ml volumetric flask dissolved in ethanol (stock solution).
Preparation of Stock Solution of Ethanol Fraction of Methanol Extract
100 mg of dry powdered sample (ethanol fraction of methanol extract) of T. cordifolia was dissolved in 80 ml of ethanol, then sonicated for 10 min volume was made up to 100 ml with ethanol after that pass it through 0.22µm millipore filters.
Preparation of Sample Solution of Developed Tablet
Ten tablets were taken and powdered separately in pestle and mortar and per tablet weight was taken and dissolved in small quantity of ethanol then volume was made up to 100 ml. The standard and sample were filtered through 0.15 µm filter paper and the filtrate was transferred to HPLC vial and placed inside the HPLC auto sampler chamber. The system was standardized for the HPLC instrument and the analysis was accomplished.
Method Validation
Method validation was done according to ICH guideline on different parameters like specificity, range21-22.
Specificity Study
To overcome the excipient effect specificity study was done. For this chromatogram was taken by appropriate dilution and quantities of drug were determined and compared withs blank solution.
Linearity and Range
The linearity is directly proportional to the concentration of the analyte in the sample. Stock solution of berberine was suitably diluted with ethanol to get concentrations in the linear range 20 to 640μg/ml for HPLC analysis .The slope, intercept and correlation co-efficient values were determined. Dilutions were injected and chromatograms were recorded. Linearity graphs with correlation co-efficient for berberine were plotted, using concentrations on X-axis and the respective peak areas on Y-axis Table 2, Table 3 and Figure 1
Table 2 : Concentration and peak area of Berberine
|
S. No. |
Concentration (µg/mL) |
Peak area |
| 1 | 20 | 1498012 |
| 2 | 40 | 2821424 |
| 3 | 80 | 5728468 |
| 4 | 160 | 11390753 |
| 5 | 320 | 22287245 |
| 6 | 640 | 44112785 |
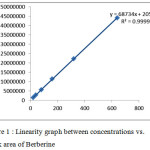 |
Figure 1 : Linearity graph between concentrations vs. peak area of Berberine Click here to View figure |
Table 3: Linearity and range
|
sample |
Range (μg/ml) | Goodness-of fit (r2 ) | Slope | Intercept |
| Berberine | 20-640 | 0.999 | 68734 |
20563 |
Limit of Detection and Limit of Quantification
Detection and quantification limit were determined by σ (standard deviation of reading of lowest concentration range) and s (the slope of the calibration curve).
Detection limit = 3.3 σ/s
Quantification limit= 10 σ/s
Precision
Precision was studied by carrying out the analysis of berberine at six concentration RP-HPLC of berberine were analyzed three times on the same day for intraday and three days over a period of one week for interday precision. For the repeatability study, the solution was analyzed for six times and %RSD was calculated.
System Suitability Studies
System suitability parameters like number of theoretical plates (N), resolution (Rs) and tailing factor were studied.
Results and Discussion
The current study revealed the presence of amount of berberine in T. cardifolia formulation. In this, the separation was carried out on C18 column and mobile phase selected was acetonitrile and water (40:60). The mobile phases were pumped into the column at a flow rate of 1ml/min. The detection wavelength used was 266nm and the method was validated. Retention time for berberin was found to be 8.35 min the result are shown in Figure-2.
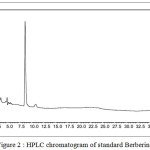 |
Figure 2 : HPLC chromatogram of standard Berberine Click here to View figure |
| Peak | Retention time | Area | Height | % Area |
| 1 | 8.35 | 1487012 | 629676 | 100 |
Quantity of berberine present in 10 mg of ethanol fraction of methanol extract of T. cordifolia was found to be 0.270 mg (Table 4 and figure 3).
Table 4 : Estimation of berberine in ethanol fraction of methanol extract of T. cordifolia
|
Replicate |
Sample area |
Berberine (µg) |
|
1 |
1899012 |
0.0273 |
|
2 |
1868978 |
0.0268 |
|
3 |
1889567 |
0.0272 |
|
Average |
645947±4329 |
0.027± 0.01 |
Mean ± SD, n=3
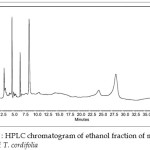 |
Figure 3 : HPLC chromatogram of ethanol fraction of methanol extract of T. cordifolia Click here to View figure |
Calibration curve for berberine was obtained for the range of 20 to 640 μg/ml. for this calibration slope and intercept value was y=68734×2054. The method showed good linearity over the range of 20-640 μg/ml with (R2) 0.999. Result was shown in the table-3 and Figure 2.
In present study the limit of detection was 0.8 and limit of quantification was found 1.7. Percentage Recovery studies of berberine found to be 99.38% intraday and interday precision were investigatedby analyzing a target concentration in six replicate preparation of formulated T. cardifolia tablet shown table-5.
The amount of berberine present in the ethanol fraction of methanol extract of T. cordifolia stem in 10 ml was found to be 0.027 µg Table 3. Accordingly 100 mg of ethanol fraction would contain 270 µg of berberine. The HPLC chromatogram of standard berberine and ethanol fraction of methanol extract are shown Figure 2 and fig.3.
Chromatographic data showed that the retention time for tablet was 8.35 at 266 nm. Quantity of berberine in 325mg of tablet was found to be 282.3 ppm as. shown in figure 4.
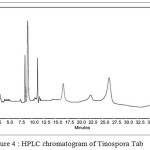 |
Figure 4 : HPLC chromatogram of Tinospora Tab
|
| Peak | RT | Area | Height |
|
1 |
8.35 |
1899012 |
629463 |
Results of validation are summarized in table 5. An analytical method is said to be specific as it can detect the analyte in the presence of expected impurities or additives in test sample.
Table 5: Summary of validation parameters
| Pricision | Result | Acceptance NMT 2% |
| Intraday(N=5) | 0.15 | RSD |
| Inter day(N=5) | 0.12 | |
| Repeatability(n=6) | 0.43 | |
| Accuracy(50%-150%)μg/ml | 99.3-101 | 98-102% |
| Detection limit | 0.8 | NMT 2% RSD |
| Quantitation limit | 1.7NMT | NMT 2% RSD |
| System Suitability | NMT 2% RSD | |
| Retention time | 8.3 | |
| Theoretical plate | 1238 | |
| Tailing factors | 1.50 | |
| Specificity | Specific |
Accurate within desired range
Conclusion
In this study a simple method was developed for estimation of berberine in ethanol fraction of methanol extract of T.cordifolia and in its Tablet form. Validation was done as per ICH guidelines. Result showed that the developed method is simple, fast, sensitive, suitable and specific for T. cardifolia 325 mg tablet.
Acknowledgements
Authors are thankful to authorities of Pacific Academy of Higher Education & Research University, College of Pharmacy,Udaipur.
References
- Mathew S, Kuttan G. Immunomodulatory and anti-tumour activities of T.cordifolia. Fitoterapia 1999; 70:35-43.
CrossRef - Bairy KL, Roopa K, Malini S, Rao CM. Protective effect of T.cordifolia on experimentally induced gastric ulcers in rats. J Nat Remedies 2002;2:49-53.
- Kumar A, Srivastava S. Study of antipyretic activity of Guduchi Sachitra. Ayurveda 1995;48:289-91.
- Prakash S, Rai NP. Role of T.cordifolia (Willd) Miers (Guduchi) in the treatment of infective hepatitis. J Res Ayurveda and Siddha 1996;17:58- 68.
- Manjrekar PN, Jolly CI, Narayanan S. Comparative studies of the immunomodulatory activity of T.cordifolia and T.sinensis. Fitoterapia 2000;71:254-7.
CrossRef - Prince PSM, Menon VP. Antioxidant action of T.cordifolia root extract in alloxan diabetic rats. Phytother Res 2001;15:213-8.
CrossRef - Prince PSM, Menon VP. Hypoglycaemic and other related action of T.cordifolia roots in alloxan diabetic rats. J Ethnopharmacol 2000;70: 9-15.
CrossRef - Sharma PC, Yelne MB, Dennis TJ, editors. Database on Medicinal Plants Used in Ayurveda. Vol.3. New Delhi: CCRAS; 2001.
- Kulkarni, S. K. and Dhir, A., Berberine: A plant alkaloid with therapeutic potential for central nervous system disorders. Phytotherapy Research, 2010,24: 317-324.
CrossRef - Ayurvedic Pharmacopoiea of India. Daruharidra stem, Government of India, Part I, 1999. 2:33-34.
- Sasikumar, J. M., Maheshu, V., and Jayadev, R.. In vitro antioxidant activity of methanolic extracts of Berberis tinctoria lesch. root and root bark. Journal of Herbal Medicine and Toxicology, 2009, 3: 53-58.
- Gilani, A. H., Janbaz, K. H.. Preventive and curative effects of Berberis aristata fruit extract on paracetamol- and CCl4-induced Hepatotoxicity. Phytotherapy Research, 1995, 9: 489-494.
CrossRef - Kanda, S. M., Yeligar, V. C., Bhim, C. M., Maity, T.. Hepato protective and antioxidant role of Berberis tinctoria Lesch leaves on paracetamol induced hepatic damage in rats. Iranian Journal of Pharmacology & Therapeutics, 2005, 4: 64-69.
- Fukuda, K., Hibiya, Y., Mutoh, M., Koshiji, M, Akao, S., Fujiwara, H.. Inhibition of activator protein 1 activity by berberine in human hepatoma cells. Planta Medica, 1999, 65: 381-383.
CrossRef - Dastur, J. F.. “Useful plants of India and Pakistan”. 5th ed. 1962 p. 37-38. Bombay.
- Liu, W. H., Hei, Z. Q., Nie, H., Tang, F. T., Huang, H. Q., Li, X. J., Deng,Y. H. Chen. S.R.Guo, F. F., Huang, W. G., Chen, F. Y., Liu, P. Q.. Berberine ameliorates renalinjury in streptozotocin-induced diabetic rats by suppression of both oxidative stress and aldose reductase. Chinese Medical Journal (English), 2008, 121: 706-712.
- Jayaprakasam, R, Ravi T.K., Development and Validation of HPTLC and RP-HPLC Methods for the Estimation of Berberine in Coscinium Fenestratum Extract and its Formulation, American Journal of Pharmtech Research 2014, 4, 3, 206-217.
- Shigwanb,H. Saklani A , HPLC Method Development and Validation for Quantification of Berberine from Berberis aristata and berberis tinctoria, International Journal of Applied Science and Engineering, 2013. 11, (2): 203-211
- Gondaliya A.V., Vikani K., Kapupara P., Development and validation of analytical method for simultaneous estimation of berberine hydrochloride and embelin in polyherbal formulation, , International Bulletin Of Drug Research, 2014, 4(6), 35-44.
- Mehra R., Naved T. , Arora M., Madan S., Standardization and Evaluation of formulation Parameters of tinospora Cordifolia Tablet, Journal of Advanced Pharmacy Education & Research, 2013, 3, 81-284.
- Validation of Analytical Procedure: Methodology, ICH Harmonized Tripartite Guidelines, Q2App. 1-8. 1996.
- Devaliya R., Jain,U.K, Orient. J. Chem., 2009, 25(4), 1053-1058
Accepted on: April 04, 2017


![]()


