Determination of Aniline Blue dye by flow Injection Analysis With Home Made Valve
Ahmed Saleh Farhood1, Luma Ahmed Mohammed Ali1 and Firas Fadhel Ali2
1Department of Chemistry, College of Science, University of Babylon, Babylon, Iraq.
2Department of Chemistry, College of Education for women, University of Anbar, Anbar, Iraq.
Corresponding Author E-mail: alnakashluma@Yahoo.com
DOI : http://dx.doi.org/10.13005/ojc/330246
Article Received on : February 08, 2017
Article Accepted on : March 28, 2017
Flow injection unit with merging zone technique was designed for aniline blue determination spectrophotometrically. This unit consists of a valve was designed for dye injection. The scope of the study is to find the optimum conditions :volume of sample, flow rate of carrier, dead volume, dispersion coefficient and reproducibility. They found 117µl, 4.3 ml/min, zero dead volume, 2.62 and high reproducibility for six times respectively. The range of aniline blue concentration by flow injection analysis was 0. 1 – 8 ppm and detection limit 0.1 with R2= 0.9952 and 0.01 – 16 ppm for spectrophotometric method with R2=0.9947 with detection limit 0.01.
KEYWORDS:merging zone; valve; aniline blue; dead volume; dispersion; reproducibility
Download this article as:| Copy the following to cite this article: Farhood A. S, Ali L. A. M, Ali F. F. Determination of Aniline Blue dye by flow Injection Analysis With Home Made Valve. Orient J Chem 2017;33(2). |
| Copy the following to cite this URL: Farhood A. S, Ali L. A. M, Ali F. F. Determination of Aniline Blue dye by flow Injection Analysis With Home Made Valve. Orient J Chem 2017;33(2). Available from: http://www.orientjchem.org/?p=31429 |
Introduction
Flow injection analysis (FIA) is one of recent techniques are established by Ruzicka an Hansen in 1975 at Denmark and Stewart in USA that is the first generation (1). The second generation of FIA is sequential injection analysis (SIA) (2) and Bead Injection (BI) is the third generation of FIA techniques. (3). The main skeletal of FIA system is: injector valve, peristaltic pump, reaction coil, tubing manifold and detector (4). FIA technique has ability to analyze very low volumes of samples , high sampling output and low detection limit (5), also has very good conditions of dead volume and dispersion(6).
FIA depends on sample injection in same volume into the carrier stream, controlling on dispersion zone to form product (7). The sample injected through the valve by carrier solution move continuously to reaction coil for mixing then a product formed moving to the detector and response recorded as physical parameter changing(8). The result signal recorded as single peak which has height , area , time of sample analyzing appearance and the width of peak (7). FIA can be modified by many ways: revers FIA(9) , merging zone(10) and stop flow (11) and can be connected with chemluminescence (12) ,fluorescence(13) and luminescence(14).
Flow injection valve is an instrument used for injection the very small equal volumes of samples by the carrier rapidly (6). The valves work electrically according to electronic program are the most development and its superior in small injected volume reproducibility and high speed injection (3) and valves in high performance liquid chromatography (HPLC) are suitable for flow injection analysis (8). There are many valves made in Iraq, one the valve extend for sample and reagent which used for determination trace concentration of acids (15,16). Different design of valve extends for the sample and reagent which it used in FIA system for determining phenol(17) and adsorbed on rice husk (18). A new design valve extends sample and three reagents injection using for determination vanadium (19). A new valve with high performance two levels valve was made to extend for eight material injection (20).
Dyes are organic compounds that absorb light in specific areas of the visible spectrum(21), Aniline blue dye is used for dying wool and cotton directly and used in dye industries that make a contribution to environmental pollution(22). Aniline Blue dye is very soluble in water and it is an acidic dye belongs to triphenyl methane class(23) which are dyes have fused benzene rings (chromophore) and the auxochromes are – NH2, NR2 and –OH(24).
In this research aniline blue dye was determined by flow injection techniques using homemade valve and study the effective conditions on this determination then compared with convenient spectrophotometry method and This leads to the possibility of using flow injection analysis technique for the study of dyes in all their interactions, for example adsorption of dye(25,26,27).
Experimental
Chemicals
Aniline blue (BDH) (50 ppm). Distilled water as carrier solution.
Equipments
Prestatic pump (ISM796 , Switzerland ), Homemade injection valve , flow injection cell (Helma), spectrophotometer (Aple PD-303UV ,Japan ) ,Spectrometer (T80 UV/VIS China ), Kompensograph (C1032 , simens ,Netherlands ) and Teflon tubes.
FIA unit and Valve Work
FIA unit was designed for determination of aniline blue dye. This designed and installed were in FIA lab, chemistry dept., college of science, university of Babylon, Iraq. The carrier distilled water flow through the pump to the valve and fill all parts of the unit outing to W2 , this case gave the base line as showed in Figure 1a. The second step is the injection of the sample from T1 to loop sample L and the waste outing from W1 as showed in Figure 1b. T1 and T2 moving to first case in figure 1a and the carrier pump the sample and the absorbance was measured at 580 nm . Recorder reads this absorbance as a peaks.
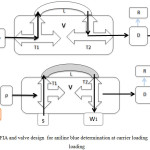 |
Figure 1a: FIA and valve design for aniline blue determination at carrier loading (b) at sample loading |
C- water carrier P- pump V- valve (T1,T2 : three way , L: sample loop) S- injected sample W1- waste of sample W2- waste after mixing D- detector R- recorder.
Results and Discussion
Effect of Flow Rate
Flow rate is one of the important factors affecting in FIA which make by change the carrier flow via pump(28) . Ruzicka and Hansen show that the occurrence of dispersion be less at low flow rate because the retention time of sample increased before moving to the detector lead to increasing interaction between sample and reagent(3). Also, peaks at low flow rate are a broad, double and distorted(29). Sometime, high flow rate reduce the response(30). At 580 nm and 117 microliter , 6 ppm from aniline blue was injected in FIA unit each time in different flow rate (2.3 , 2.9 , 3.1 , 3.4 , 3.9 and 4.3 ml per min ) and the response was recorded as showed in Figure 2.
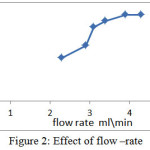 |
Figure 2: Effect of flow –rate |
When the flow rate increased ,the response increase. In low flow rate the carrier made a dilution for aniline blue dye more than in high flow rate (31) . In high flow rate 3.9 and 4.3 ml/min , the flow rate was not affected the response (32) . 4.3 ml/min was the best value with the highest response 1.4 cm.
Effect of Sample Volume (sample loop)
Sample volume is important influences affecting on dispersion process which is study by using different length loops(30). Increasing sample volume lead to increase response (peak height)(33) but the access of sample volume make incomplete dispersion that caused broad and Double peaks(34). At 580 nm, 4.3 ml/min flow rate and 6 ppm of aniline blue dye , the effect of sample volume (changing loop) was studied and response was recorded for each loop. the volume of sample under study were 3.9.25 , 78.5 , 117 and 157 microliter. The result showed in figure 3 . When the sample volume Increase the response was increased , after 117 and 157 µl the response remain constant. This effect is similar to results for FIA unit used for determination of water toxicity (35) and determination of magnesium (36). Although the response for 117 and 157 are equal , but 117 µl was dependent as the best value because the volume as small as will be more economical.
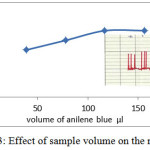 |
Figure 3: Effect of sample volume on the response
|
Repeatability
Repeatability is a successive injections for the same concentration of sample under the optimum conditions to study efficiency of FIA unit(33) . At 580 nm , 4.3 ml/min flow rate ,117 microliter and 6 ppm from aniline blue , the reproducibility was studied . Its mean the same readings can be gain it in case of inject one sample several times (6 times). Reproducibility can be seen in figure 4 it shows the repeating run with response. The unit gave a good reproducibility which agree with results for determination of adsorbed phenol on wheat husk (37) , proscopis farcta berry (38) , for alkenes determination by merging zone technique (39) and alkenes determination by sequential technique (40).
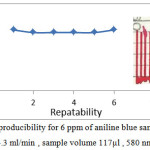 |
Figure 4: the reproducibility for 6 ppm of aniline blue sample at flow rate 4.3 ml/min , sample volume 117µl , 580 nm. Click here to View figure |
Calibration
A series concentration of aniline blue was taken to make calibration curve . The calibration was studied at 580 nm , flow rate 4.3 ml/min and sample volume 117µl Detection limit was 0.1 ppm , range was (0.1-8) ppm and R2 was 0.9952. Compare with spectrophotometry method .Detection limit , range and R2 are (0.01-16) ppm , 0.01 ppm and 0.9947 respectively as in figure 5.
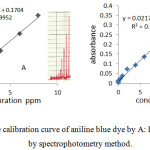 |
Figure 5: The calibration curve of aniline blue dye by A: FIA method , B : by spectrophotometry method. Click here to View figure |
Dispersion Coefficient (D)
It is the ratio of the concentration of the sample before and after the dispersion process takes place. Dispersion coefficient is defined by the equation (D = Ho / Hmax)
Where Ho = peak concentration in injection volume without dispersion , Hmax peak concentration at detector with dispersion(38). D is influenced by three interrelated and controllable variables: sample volume, tube length, and pumping rate(39) . The dispersion coefficient was studied at 495 nm , flow rate 3.4 ml\min and sample volume 275µl the absorbance was measured with dispersion Hmax and without dispersion Ho as showed in table 1.The absorbance experimentally decrease with dispersion . The dispersion coefficient (D) was calculated from following equation (41) as showed in figure 6.
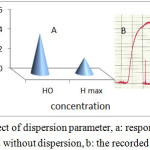 |
Figure 6: Effect of dispersion parameter, a: response according with and without dispersion, b: the recorded response Click here to View figure |
Dead Volume
It is the volume that remained in valve at loading sample or reagents and it leads to appear faulty peak :double, distorted or signal in base line , In this case the valve is imperfect but if the dead volume equal zero, the valve is perfect(30). The homemade valve which used in this work has a zero dead volume. Where all responses start from zero baseline for one response. This case is perfect in our work and this accomplished to the past work in FIA lab.: methylene blue determination by one loop valve FIA system(42) , three loop valve for determination Sn(43) and Mn(44) and four loop valve for Vdetermination(45), all these valves have zero dead volume and figure 7 shows the idea of dead volume with response.
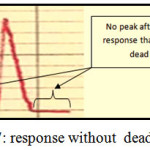 |
Figure 7: response without dead volume Click here to View figure |
Sampling Output
Sampling output was computed in hour by measuring time required for one run. The sample output is 102 samples per hours as showed in figure 8.
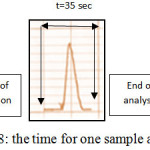 |
Figure 8: the time for one sample analysis Click here to View figure |
Conclusions
FIA unit which used in this work was Cheap and gave a good results for determining aniline blue by using a small volume of the sample and very good output sampling comparing with spectrophotometric method .
References
- Trojanowiez, M. ,Advances in Flow Analysis, 2010Wiley-VCH Verlag GmbH & Co. KGaA
- Tontrong, S.; Khonyoung, S.; Jakmunee, J. , Food Chemistry , 2012 , 624 – 629.
CrossRef - Barcelo, D. ,Comprehensive Analytical Chemistry. Advances in Flow Injection Analysis and Related Techniques , Edited by Spas D. Kolev, 1st ed, Elsevier, Australia , 2008.
- Parikh, A. ; Patel, K.; Patel, C. ; Patel, B., J. Chem. Pharm. Res. 2010, 2(2),118-125.
- Shaker, I. MA.; Hassan, Z.F., International J. of Research in Pharmacy and Chemistry , 2015 ,5(1) ,84-94.
- Ruzicka, J. ; Hansen, E. H., Flow Injection Analysis , 2nd. ed. Wiley, New York, 1988.
- Lingyun, YU.; Mengru, WU.; Wei, D.; Jing, J.; Xinshen, Z. , Soil Ɛ Water Res. ,2011, 6(4) ,198-204.
CrossRef - Leamsomrong, K.; Suttajit, M.; Chantiratikul, P., Asian Journal of Applied Sciences ,2009, 2(2) , 184 -190.
CrossRef - Kuckboyaci, N.; Guvenc, A.; Aydin, A. , Turk J. Pharm. Sci., 2012 , 9 (1), 93-100.
- Lolic, A.; Tripkovic, T.; Baosic, R.; Nikolic-Mandic, S.; Stanimirovic, B. ,J. Serb. Chem. Soc. , 2012 , 77 (11) , 1641-1647.
- Frenzel, W.; McKevie, I. D., Advances in FIA and Related Techniques , Elsevier , Amsterdam , 2008.
- Han, S. , Micro chem. Acta , 2010, 168, 169–175.
- Emara, S.; Masujima, T.; Zarad, W.; Kamal, M., Chemistry Central J. , 2012, 208 – 220.
- Payan, M.; BelloLopez, M.; Torres, R.; Mochon, M., Talanta , 2010, 82 , 2003 – 2006.
- Taha, D.N. , A new Approach for Merging Zone – Flow Injection Analysis , Ph.D. ,Thesis , Babylon University , 2002 .
- Taha, D. N.; Ali, F.F. , Patent, 3866, C.O.S.Q.C. ,2014.
- Al-Kafaji, A. S. F.; Taha, D. N. , Design of Flow Injection Analysis Unit Merging Zone Technique for the Determination of Adsorbed Phenol on Activated Carbon Surface Prepared from some Local Plants Husks , M.Sc. ,Thesis , Babylon University , 2011.
- Taha, D. N.; Farhood, A. S. , J. of Babylon university , 2012, 20(2), 618-632.
- Al-Zaydany, F. F. A.; Taha, D. N. , Determination of Cerium (IV) by Flow Injection Analysis Merging Zone Technique Via (Ce4+,I and H3O+) system, Ph.D., Thesis , Babylon University , 2013.
- Taha, D. N.; Abd –Alameer, A. A. ,Design New Valve , Patent, 3153, C.O.S.Q.C. , 2012.
- Grabowska, E.; Gryglewicz, L. , Dyes Pigm., 2007, 74 ,34‐40.
CrossRef - Wang, J.S.; Chen, P. Y.; Huang, T.T.; Lin, M. S. ,Int. J. Electrochemical Sci. , 2012 , 7 , 9113 – 9121.
- Abdel Karim, S. E.; El-Nasher, R. M.; Abadi, A. H., Int. J. Electrochemical Sci. , 2012 , 7, 9668 – 9681.
- Tahir, F. T.; Salhin, A.; Ab Gani, S., Sensors, 2012 , 12 , 14968 – 14982.
CrossRef - Velavendan, P.; Ganesh, S.; Pandey, N. K.; Mudali, U. K.; Natarajan, R. , J. of Analytical Sciences , Methods and Instrumentation , 2012 , 156 -160.
- Taha, D. N.; Samaka, I. S.; Mohammed Ali, L. A., Journal of Asian Scientific Research, 2013, 3(9) , 945-955.
- Taha, D. N.; Samaka, I. S.; Mohammed Ali L. A.; Naige, A. S., Civil and Environmental Research, 2014, 6(7)149-159.
- Naser, N.A.; Kadim, K. H.; Taha, D. N., J. Oleo Sci., 2012, 61(7) 387-392.
CrossRef - Payan, M.; Lopez, M.; Torres, R.; Navarro, M.; Moch, M. ,Talanta , 2009,79, 911–915.
CrossRef - Taha, D. N.; Obaid, Z. S., J. of Research of Pharmaceutical, Biological and Chemical Science, 2016, 7(6)2241 – 2250.
- Komaitis, E.; Vasiliou, E.; Krem, G.; Georga, D.; Georgiou, C. , Sensors , 2010,10,7089-7098.
CrossRef - Akpari, R.; Noroozifar, M.; Khorasan, M. , Turk J Chem., 2007, 31, 293-299.
- Abbas, G. J.; Mashkour, M. S.; Taha, D. N. , J. of Purity, Utility Reaction and Environment, 2016,5(4),92-105.
- Christopher, J. B.; Patrick, S. B.; Carrick, M.E.; Patricia J.C. , Sensors , 2009 , 9, 4390 – 4405.
CrossRef
- Balaram, V.M.; Rao, J.V.; Khan, M.M.A.; Sharma, J.V.C.; Anupama, K. , J. of Chem. , 2009 , 21, 5241 – 5244.
- Al-Nakash, L. A.;Taha, D. N., A new Design of Flow Injection Analysis System for Determination of Alkene , M.Sc. ,Thesis , Babylon University , 2011.
- Zaidan, F.; Freitas, P. A. M. , International J. of Engineering Research and Science , 2015 , 1, 39 – 46.
- Frenzel, W.; McKevie, I. D. , Advances in FIA and Related Techniques , Elsevier , Amsterdam , 2008.
- Trojanowicz, M. , Advances in Flow Analysis , WILEY-VCH , 2008, 16 – 22.
CrossRef - Yaqoob, M.; Nabi A.;Worsfold, P. J., J. Chem. Soc. Pak. , 2013, 35, 533 – 539.
- Taha, D. N.; Majed, A. S.,design anew valve (three way) , patent, 4390, C.O.S.Q.C., 2015.
- Claudia, R. C.; Francisco, J. C. , Food Chemistry , Elsevier , 2009 , 112 ,487 – 493.
CrossRef
- Zhang, Y.; Adeloju, S. B. , Talanta , 2008, 74 , 951 -957.
CrossRef - Taha, D. N.; Majed, A. S., design anew valve (two way) , patent, 4391, C.O.S.Q.C., 2015.
- Vidigal, S. S. M. P. ; Rangel, A. O. O. S. , Micro chemical J. , 2015, 121, 107 – 111.
CrossRef

This work is licensed under a Creative Commons Attribution 4.0 International License.
![]()
A New Edition of Web of Science
Journal Impact Factor
2022: 0.5
Five Year: 0.8
Journal is Indexed in

Cabells Whitelist
![]()


