Study on the Properties and Photoactivity of TiO2(nanorod)-SiO2 Synthesized by Sonication Technique
Sri Wahyuni1,2, Eko Sri Kunarti1, Respati Tri Swasono1 and Indriana Kartini1
1Department of Chemistry, Faculty of Mathematics and Natural Sciences, UniversitasGadjah Mada Sekip Utara Bulaksumur, Yogyakarta 55281, Indonesia.
2Department of Chemistry, Faculty of Mathematics and Natural Sciences, Universitas Negeri Semarang Jl.Taman Siswa, Sekaran, GunungPati, Semarang, 50221, Indonesia.
Corresponding Author E-mail: indriana@ugm.ac.id
DOI : http://dx.doi.org/10.13005/ojc/330129
Article Received on :
Article Accepted on :
Article Published : 16 Feb 2017
A series of TiO2(nanorod)-SiO2nanocomposite (TS) with different mole ratios was prepared by sonication technique. Nanorod TiO2 was prepared by solvothermal assisted by EDTA, while SiO2 was prepared by sol-gel method. Various amount of SiO2 powder was combined with nanorod TiO2 to form TiO2(nanorod)-SiO2nanocomposite. Based on XRD and TEM results, the TiO2 was rod-likeanatase crystalline phase with the rod length of about 20-50 nm, while spherical SiO2 was a large particle with adiameter of about 200 nm. The deposition of nanorod TiO2 on the surface of spherical SiO2resulted in composites with slightly smaller crystallite size than that of the pristine nanorod TiO2 of about 21-27 nm. The BET surface area of the TS composites was variable, of about 61.8–67.6 m2 g-1. The photoactivity of the composites was examined by measuring the zone inhibition of the composites to the growth of E. coli and B. subtillis, as a model of gram-negative and gram-positive bacteria, respectively. The composites have shown significant antimicrobial activity over both bacteria, which are slightly higher than that of pristine nanorod TiO2.
KEYWORDS:nanorod; TiO2; SiO2; nanocomposite; sonication
Download this article as:| Copy the following to cite this article: Wahyuni S, Kunarti E. S, Swasono R. T, Kartini I.Study on the Properties and Photoactivity of TiO2(nanorod)SiO2 Synthesized by Sonication Technique. Orient J Chem 2017;33(1). |
| Copy the following to cite this URL: Wahyuni S, Kunarti E. S, Swasono R. T, Kartini I. Study on the Properties and Photoactivity of TiO2(nanorod) SiO2 Synthesized by Sonication Technique. Orient J Chem 2017;33(1). Orient J Chem 2017;33(1). Available from: http://www.orientjchem.org/?p=30273 |
Introduction
TiO2has been widely used as a photocatalystin various applications from cleaning the environmental to generating electricity. These include applications in the air and water purification systems1,2, products of self-cleaning surfaces1,3,sterilization1,3, hydrogen evolution1,2, and photoelectrochemical conversion4. TiO2 is considered an ideal semiconductor for photocatalysisbecause of its high stability, low cost and safety toward bothhumans and the environment5. The development of new materials, however, isstrongly required to provide enhanced performances with respect to the photocatalytic properties andto find new uses for TiO2photocatalysis. TiO2 or titaniais also usedin many applications like in pigments, ceramics, sun lotions, etc. Titania decomposes organic material when illuminated with ultraviolet(UV) rays. This trait is utilised in the treatment of thewaste material, air pollutant, drinking water, and in the development of self-cleaningsurfaces6-8.
Recently, titania supported on silica (SiO2) have attracted much attention as advanced materials. A more uniform titania distribution was obtainedby doping TiO2 with SiO2, ZrO2, and other metal oxides9-11. Theaddition of SiO2, or other oxides intoanatase TiO2 can improve the thermal stability and specific surface area12-13. An increase inthe photocatalytic activity is an added advantage to the self-cleaning and antibacterialproperties14-15.TiO2 supported on silica was reported to exhibit a better photocatalytic performance than TiO2 itself. This improved performance was believed due to the interaction between TiO2 and SiO2, and improved adsorption of the pollutant on the silica overpure TiO216. Various type of mixed oxide TiO2-SiO2 have been synthesised and applied to reduce organic dye pollutant16. TiO2 and SiO2nanospheres were commonly used to prepare TiO2-SiO2 mixed oxide.
Recently, various types of TiO2 such as nanorods, nanotubes, nanocrystals and mesoporous materials have been synthesized17. One-dimensional (1-D) TiO2 nanostructures such as ellipsoidal nanoparticles18, nanowires19, and nanotubes20, havebeen investigated extensively due to their special properties, which are attributed to dimensional anisotropy. Nanorod TiO2 has been used to produce a superhydrophobic surface in a coating19. In 1-D nanostructured crystals of TiO2, the space charge region is wellconstructed along the longitudinal direction of TiO2nanocrystal,meaning that photogenerated electrons can flow in the directionof the crystal length. Increased delocalization of electrons at1-D nanostructured crystals can lead to a remarkable decreaseine−/h+recombination probability21.
In this study, the nanorod titania decorated on silica were synthesised by mixing silica sol and titania sol through sonication technique16, 23. Titaniananorod was prepared by solvothermal techniques23. On the other hand, SiO2 nanoparticle was prepared by sol-gel methods24. If the surface of a larger particle is covered by a layer of fine particles, a core–shell system might be resulted22. The properties of nanorod TiO2decorated on SiO2at several compositions will be studied, including the surface area, crystallinity, crystallite size, and the effect of the composition of the mixed oxide on the photocatalytic activity. The photocatalytic performance of these materials was investigated by testing their ability to inhibit the growth of bacteria. E. coliwas used to represent gram-negative bacteria and B. subtillisto representgram-positive bacteria.
Material And Methods
All chemicals used in this experiment were of high purity and used as received. Titanium tetra-isopropoxide (TTIP, Sigma-Aldrich), anhydrous toluene (Mallinckrodt), ethylene diaminetetra-acetic acid disodium salt (Na2EDTA, Sigma-Aldrich), tetraethylorthosilicate (TEOS, Merck Germany) and ethanol (Merck Germany) were used as starting materials.
Synthesis of spherical SiO
The SiO2 nanoparticles were synthesised using modified Stober process. The starting materials used for SiO2 synthesis were TEOS, NH3, ethanol, and H2O with 9:7:7: 27 (v/v). TEOS and ethanol were mixed and stirred for 15 min. Then, NH3 and H2O were added dropwise slowly and carefully while sonication was performed for 2 h. All concentrations of the reactant were calculated based on final volume in the reaction mixture24. Sonication process took place in an Ultrasonic Homogenizer (Krisbow model 5510, 40 kHz).
Synthesis of nanorod TiO2
Initially, 5 mmol of diethylene tetraacetic acid disodium salt (EDTA) complexing agent was added to 25 mL of millipore water and stirred until the dissolutions complete. The pH was maintained at around 8 by adding ammonia solution, and then 50 mL of toluene was slowly added and stirred for about 30 min. To this mixture, 5 ml of TTIP was added ata constant rate during the course of the reaction. The toluene to water ratio was set to 2:1, and the water to TTIP ratio was kept as 5:1. The solution turned into the slurry as a result of slow hydrolysis of TTIP in water. The final mixture was transferred into an autoclave (80% filling) sealed properly and heated at a constant temperature of 180ºC for 3 h. The product was collected after centrifuge and washed repeatedly with millipore water and dried at 120ºC for 6 h23.
Synthesis of TiO2(nanorod)-SiO2
Onegram of TiO2 resulted from solvothermal method were dissolved in 50 mL ultrapure water, 1 mL HNO3 0.1 M and 10 mL acetic acidswere added in order to get the pH of 2 of the sol while sonicated for 10 min. The as-synthesized SiO2 powder in the various mole percentages was dispersed in TiO2 sol carefully. The mixture was dispersed in an ultrasonic bath for 30 min and kept for 24 h to form TiO2deposited on SiO2 sphere16. The suspension mixture then was filtered, dried, and calcined in air at 450°C for 3 h. The product was TiO2-SiO2 composite with 10%, 20%, and 30% mole content of SiO2and named as TS-10, TS-20, and TS-30, respectively.
Characterization
The crystal structure of powder was analysed by X-ray diffraction (XRD) using a Rigaku Miniflex 600, X-ray powder diffraction (Rigaku Corporation, Tokyo, Japan) with Ni-filtered CuKa (0.15418 nm) radiation at 45 kV and 20 mA. The crystallite size was calculated using the Scherer formula.
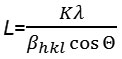
where L is the average crystallite size in nm, K is a constant usually taken as 0.9, l is the wavelength of the X-ray radiation (using CuKa = 0.15418 nm), bhkl is the line width at half-maximum height in radians, and θ is the diffracting angle18,23. The functional group of the compound was identified by Shimadzu FTIR-820 IPC. The Brunauer-Emmett-Teller (BET) surface area of TiO2 and TiO2-SiO2 powders were determined using Surface Area Analyzer (Nova 3200e Quantachrome). The transmissions electron microscope (TEM) images were obtained using a JEOL JEM-1400 electron microscope to identify the morphology of TiO2. ScanningElectron Microscopy (SEM) observations were carried out using a JEOL JSM-6510LA electron microscope.
Antimicrobial activity study
The antimicrobial activity of the synthesised nanocomposites was investigated by well diffusion method against two bacterial strains, Escherichia coli (FN CC0051) as gram-negative bacteria, and Bacillus subtilis (ATCC 6633) as gram-positive bacteria. The obtained bacterial cultures were maintained on nutrient agar slants. The test bacterial suspensions (50 µL) containing 104 cells/mL were spread on nutrient agar plates. 50 µL nanomaterial (TiO2) suspension or 50 mL nanocomposite (TiO2-SiO2) suspension (10 mg/mL) was added in the tested wells. The samples were initially incubated for 15 min at 4°C to allow diffusion and later illuminated with UV lamp (365 nm) for 40 min and then were incubated at 37°C for 12-18 h for the bacterial cultures25.
Results and Discussion
X-ray Diffraction
The powder XRD pattern of TiO2synthesized via Ti-EDTA chelated complex was presented in Fig. 1. The diffraction peaks are analogous to anatasecrystal structure. For eachsample, allpeaks correspond to anatase phase at 2θ = 25.088, 37.6400, 47.7900, 53.7000, 54.8300, and 62.5570 (# 01-071-1168). It is found that the higher the percentage of SiO2 the lower the intensity of the peaks. The peak associated with SiO2confirms an amorphous nature of silica. The increasing of SiO2 particle in the formation of TiO2-SiO2 composites means the increasing of the amorphous particle into the composites, consequently the crystallinity will reduce as confirmed by less intense XRD peaks of the composites. From the data in Table 1, it appears that increasing the amount of SiO2 in the composite also affect the crystallite size and surface area. This effectmay be due to the SiO2 limiting the agglomeration of nanorodTiO2. Commonly, all crystallite size of the TS nanocomposite was not significantly different. Sirimahachaiet al.16 obtained a similar tendency about the influence of the amount of SiO2 against the crystallinity and crystallite size of the composites.
Fig. 2 is proposed to explain the arrested growth of nanorod TiO2 by spherical SiO2. It is assumed that the nanorod attachment on the spherical surface of silica is irregular (Fig. 2d). Thus, the crystallite sizes of the composites are variable.
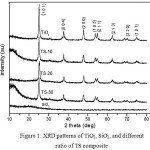 |
Figure 1: XRD patterns of TiO2, SiO2, and different ratio of TS composite |
Fig. 2a and 2b demonstrate the attachment model of the spherical TiO2 on the surface of spherical SiO2. These can affect the crystallite size of the resulted composites, resulting in small crystallites of TiO216. Spherical morphology of TiO2 allows its deposition evenly over the surface of SiO2. In another way, TiO2 can be deposited in several layers, such as forming an aggregation as suggested by Fig. 2b. The ideal model of nanorod TiO2 attachment on the surface of silica is presented in Fig. 2(c), the rod-shaped TiO2are aligned vertically on the surface of SiO2. Fig. 2d and 2e displayed other possible alignments of nanorod deposition on spherical surface. The nanorod may also attach vertically and horizontallyon the surface of SiO2.
Table 1: The crystallite size and surface properties of TiO2 and TS composite
|
composite |
Crystallite size(nm)* |
BET surface area (m2/g) |
Pore volume (cm3/g) |
Pore diameter(nm) |
|
SiO2 |
– |
12.159 |
0.038 |
11.85 |
|
TiO2 |
30.60 |
63.988 |
0.344 |
21.52 |
|
TS-10 |
27.22 |
61.794 |
0.457 |
29.76 |
|
TS-20 |
20.95 |
67.561 |
0.410 |
24.24 |
|
TS-30 |
25.32 |
60.569 |
0.418 |
27.65 |
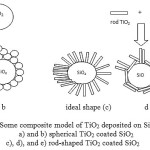 |
Figure 2: Some composite model of TiO2 deposited on SiO2: a) and b) spherical TiO2 coated SiO2 c), d), and e) rod-shaped TiO2 coated SiO2 |
TEM image
The TEM images ofTiO2nanopowder(Fig. 3), shows the morphology of nanorods with the length size of about 50 nm. The TEM image endorsesthe formation of TiO2nanorods and their presence is quite consistent. Toconfirm the degree of orientation, the texture coefficient (TC) for (004) and (200) peaks of theoriented nanocomposite powder were determined and compared with the TC value of the standard TiO2powder26. TC of the synthesised TiO2 was calculated from the relative intensity data in the XRD pattern (Fig. 1) and the PDF data file (# 01-071-1168). Deviation of TC values from unity implies preferred growth. A higher value ofTC denotes preferred orientation of grains26. The calculated TC (004) and (200) values of as-synthesizednanocomposite powder were 1.17 and 1.02 respectively.This oriented crystal growth obtained because of the act of EDTA as an orienting agent in the synthesis23. Christy et al.has been succeeding to synthesisenanorodsTiO2with a simple EDTA modifier23.
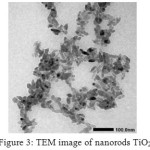 |
Figure 3: TEM image of nanorods TiO2 |
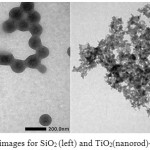 |
Figure 4: TEM images for SiO2(left) and TiO2(nanorod)-SiO2(TS) (right) |
The TEM images of SiO2 and nanorod TiO2deposited on SiO2 sphere were presented in Fig 4. From Fig. 4(left) the particle size of SiO2 is about 100 nm. The spheres of silica are quite homogenous. Sirimahachai et al.16 obtained spherical SiO2with average size of about 350 nm. Wilhelm et al.22synthesised SiO2 through Stober method at the various different size, from 150 nm until 590 nm. In this study, the particle size of SiO2 was smaller than that of the SiO2 reported by Sirimahachai et al.16. The spherical SiO2was then combined with nanorod TiO2 with the length of about 50 nm. It is assumed that different size and morphology of the source of the composite produces rather a different shape and character of the composite.
BET Surface Area
The BET specific surface area (SBET) was calculated by using the standard BET method on the basis of the adsorption data28. The nitrogen adsorption-desorption isotherms of TiO2, SiO2, and TiO2-SiO2 (TS) material are shown in Fig. 5. Their different appearances suggest the modifications of the porosity characteristics when the mixed oxides form a new network. The isotherm curve forSiO2, shows a type IV isotherm with a broad type H4 hysteresis loop, in the middle range of relatively pressure. This could be associated with the presence of narrow slit pores29.For TiO2 and TS material, type IV isotherms with type H1 hysteresis loop in relatively high pressure are observed. It can be associated with a porous material consisting of well-defined cylindrical-like pore channels29.This supports the synthesis design that the nanorod TiO2covering the surface of the spherical SiO2.
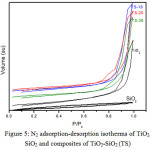 |
Figure 5: N2 adsorption-desorption isotherms of TiO2, SiO2 and composites of TiO2-SiO2(TS) |
Sirimahachai et al.16 reported the relatively significant change of surface area against the increasing of SiO2, due to the sphere morphology of both SiO2 and TiO2. In this research, the TiO2 deposited on SiO2 was rod-shaped. The surface areas of the composites are just slightly changed against the SiO2 content. It is predicted that nanorod morphology of TiO2 will provide steric hindrance to covering the SiO2 particle completely as depicted in Fig. 2d-e.Therefore, the surface areas of the composites are almost the same.
FT-IR spectra
The FT-IR spectra of nanorod TiO2 and TS composite with avariousmole ratio of SiO2 are presented in Figure 6. IR spectra of pure silica were also taken for comparison. The absorption bands at around 3426 and 1635 cm-1 observed in all spectra are attributed to the stretching mode of water and hydroxyl group14. The peak around 802 cm-1 and 1103 cm-1 are ascribed to the symmetric vibration of Si–O–Si and the asymmetric stretching vibration of Si–O–Si, respectively16. The peak at 950 cm-1 corresponding to the vibration of Si–O–Ti confirmed the formation of Si–O–Ti inorganic network between SiO2 and TiO2in TS-20 and TS-30 samples30. In TS-10, the amount of silica is too lowfor the formation of Si–O–Ti network, hence a peakfor Si–O–Ti could not be observed. It is also clear that composites spectra are a combination of the pure SiO2 spectra and pure TiO2 spectra14.
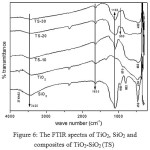 |
Figure 6: The FTIR spectra of TiO2, SiO2 and composites of TiO2-SiO2(TS) |
SEM image
For further characterization of the nanorod TiO2 deposited on SiO2, SEM studies were done. Figure 7 shows SEM images of the SiO2, and TiO2 deposited on SiO2 (TS) particles. The image of SiO2 illustrates that the particles are spherical and have a smooth surface. After the deposition process, SEM image shows that the coated silica is still spherical, but the surface of the particles is not smooth anymore. This can be ascribed to the presence of nanorod titania deposited on the surface of spherical silica. Similar result was carried out by heterogenic coagulation method to depositing spherical TiO2 on the surface of SiO223, 31. It can be concluded that the nanorod attachment may follow Fig. 2e.
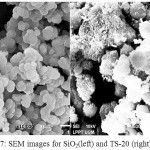 |
Figure 7: SEM images for SiO2(left) and TS-20 (right) |
Antimicrobial activity
Antimicrobial activity of nanorodTiO2and TiO2 (nanorod)-SiO2(TS) composites were investigated by well diffusion method against E. coli and B. subtillis. All tests and inoculation on each plate were run induplicates.The results then were inspected visually (Fig. 8) and zone inhibition values were recorded (Table 2). Figure 8 (I) and (II) shows inhibition zone for B. subtillisand E. coli respectively. TS-20 composite gives the largest inhibition zone for both B. subtillis and E. coli. This result may have a relationship with the BET surface area, which shows the largest area for this composite. Sirimahachai et al.32 investigated the performance of various TiO2to inhibit bacterial growth and obtained the best result for the TiO2 nanoparticles with the largest surface area (320.1 m2 g–1). In this study, TS-20 composite inhibits the growth of the bacteria at the same concentration (50 mg/mL) but with the smaller surface area (67.561 m2 g–1). The same result was also obtained by Piskinet al.25 which investigated the TiO2sol synthesised by sonication technique.
All samples also demonstrate higher inhibition toward gram-negative bacteria compare to the gram-positive bacteria. The gram-positive bacteria, B. subtillis, have a relatively thick wall composed of many layers of peptidoglycan polymer and only one layer of membrane. The gram-negative bacteria (E. coli) have only a thin layer of peptidoglycan and a more complex cell wall with two cell membranes, an outer membrane, and a plasma membrane.
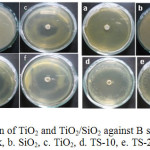 |
Figure 8: Zone inhibition of TiO2 and TiO2/SiO2 against B subtilis (I) and E coli (II) a. Blank, b. SiO2, c. TiO2, d. TS-10, e. TS-20, f. TS-30 |
Table 2: Mean Diameter of Inhibitory Zone (mm) of TiO2 and TiO2–SiO2 Against Bacterial Strains Bacilus subtillis and Escherichia coli
|
composite |
B subtillis |
E coli |
|
SiO2 |
– |
– |
|
TiO2 |
12.0 |
17 |
|
TS-10 |
17.0 |
19 |
|
TS-20 |
19.0 |
23 |
|
TS-30 |
17.0 |
18 |
Conclusion
It is concluded that the major phase of the nanorod TiO2 particle and TiO2-SiO2 composites are the anatase crystalline phase. The presence of silica has retarded the grain growth of nanorod titania so considerably, that the particle size of the composite is slightly smaller than that of pristine TiO2.The SEM image of the composite structure confirms the attachment of nanorod titania on the surface of spherical silica. The sonication technique provides a facile technique to produce a composite of titania–silica with a good crystallinity and surface area from TiO2 and SiO2sols as the precursors. TiO2(nanorod)-SiO2composites have also shown good antimicrobial performance at a small surface area, that might be contributed by the nanorod structure. Study on hydrophobicity properties induced by the nanorod TiO2over the SiO2is underway.
Acknowledgements
We are thankful to the Laboratory of Microbiology, Department of Biology UNNES and LPPT UGM for providing all facilities to direct this work. SW is grateful to the Directorate General of Higher Education for providing adoctoral scholarship.
References
- Nakata, K. and Fujishima, A. J. Photochem. Photobiol., C,2012; 13, 169–189.
- Arora, A. K., Jaswal, V. S., Singh, K. and Singh, R.,Orient. J. Chem., 2016;32(4),2035-2042.
CrossRef - Kartini, I., Santosa, S. J.,Febriyanti, E.,Nugroho, O. R., Yu, H. and Wang, L., J.Nanopart. Res., 2014;16, 2514.
CrossRef - Kartini, I., Menzies, D., Blake, D., da Costa, J. C. D, Meredith, P., Riches, J. D. and Lu, G. Q.,J. Mater. Chem., 2004; 14, 2917–29212.
CrossRef - Gupta, S. M. and Tripathi, M. Chin. Sci. Bull., 2011; 56(16), 1639–1657.
CrossRef - Dalton, J.S., Janes, P.A., Jones, N.G., Nicholson, J.A. Hallam, K.R. and Allen, G.C., Environ. Pollut.,2002; 120, 415-422.
CrossRef - Liu,Y., Wang, X., Yang,F. and Yang, X., Micropor. Mesopor.Mater.,2008; 114, 431–439.
CrossRef - Aprilita, N. H., Kartini,I. and Ratnaningtyas, S. H., Indones. J. Chem,.2008, 8, 200-206.
- Uchiyama, H., Suzuki, K.,Oaki, Y.,and Imai, H., Mater. Sci. Eng. B, 2005; 123, 248–251.
CrossRef - Reddy, B. M., Reddy, G. K., Rao, K. N., Ganesh, I., and Ferreira, J. M. F., J. Mater. Sci.,2009; 44, 4874–4882.
CrossRef - Fujishima, A., Rao, T. N., and Tryk, D. A., J. Photochem. Photobiol., C, 2000; 1, 1-21.
- Rahmani, E., Ahmadpour, A., and Zebarjad, M., Chem. Eng. J.,2011; 174, 709-713.
CrossRef - Castillo, R., Koch, B., Ruiz, P., and Delmon, B., J. Mater. Chem.,1994; 4, 903-908.
CrossRef - Smitha, V. S., Manjumol, K. A., Baiju, K. V., Ghosh, S., Perumal,P. andWarrier, K. G. K.J. Sol-Gel Sci. Technol.,2010;54, 203-211.
CrossRef - Allen, N. S., Edge,M., Verran,J., Stratton,J., Maltby, J., and Bygott, C., Polym. Degrad. Stab., 2008; 93,1632-1646.
CrossRef - Sirimahachai, U.,Ndiege, N., Chandrasekharan, R.,Wongnawa, S., and Shannon, M. A., J. Sol-Gel Sci. Technol.,2010; 56, 53-60.
CrossRef - Yeung, K.L., Leung, W.K., Yao, N. and Cao, S., Catal. Today, 2009; 143, 218-224.
CrossRef - Kang, S.H., Choi, S.H., Kang, M.S., Kim, J.Y., Kim, H.S., Hyeon, T., and Sung, Y.E., Adv. Mater., 2008; 20, 54-58.
CrossRef - Zhang, X., Guo, Y., Zhang, Z., and Zhang, P., Appl. Surf. Sci., 2013; 284, 319–323.
CrossRef - Joo, J., Kwon, S.G., Yu, T., Cho,M., Lee, J., and Yoon, J., J. Phys. Chem. B, 2005; 109, 15297-15302.
CrossRef - Yun, H.J., Lee, H., Joo, J.B., Kim, W., Yi, J., and Yun, J., J. Phys. Chem. C., 2009; 113, 3050-3055.
CrossRef - Wilhelm, P. and Stephan, D., J. Coll. Inter. Sci.,2006; 293, 88-92.
CrossRef - Christy,P.D., Melikechi, N., NirmalaJothi, N.S., Baby Suganthi, A.R. and Sagayaraj, P. J. Nanopart. Res., 2010; 12, 2875-2882.
CrossRef - Rahman, I.A.,Vejayakumaran, P., Sipaut, C.S., Ismail,J.,Bakar, M.A., Adnan, R., and Chee, C.K., Colloids Surf. A., 2007; 94, 102-110.
CrossRef - Pişkin,S., Palantöken,A., and Yılmaz, M.S., Proceedings of International Conference on Emerging Trends in Engineering and Technology (ICETET), Patong Beach, Phuket, Thailand,2013; 91-94.
- Sadhu, S, and Poddar, P., J. Phys. Chem. C, 2014; 118, 19363–19373.
CrossRef - Polleux, J., Pinna, N., Antonietti, M., and Niederberger, M. Adv. Mater.,2004;16(5), 436–439.
CrossRef - Brunauer, S. Emmett, P.H. and Teller,E.J. Am. Chem. Soc.,1938; 60, 309-319.30. Cheng, P., Zheng, M., Jin, Y., Huang, Q., and Gu, M., Mater.Lett.,2003; 57(20), 2989– 2994.
- Carja,G., Nakamura, R.,Aida,T. and Niiyama,H., Micropor. Mesopor.Mater., 2001; 47, 275-284.
CrossRef - Wilhelm, P. and Stephan, D. J. Photochem. Photobiol., A, 2006; 185, 19–25.
CrossRef - Sirimahachai, U., Phongpaichit,S., and Wongnawa, S.Songklanakarin J. Sci. Technol., 2009; 31, 517-525.

This work is licensed under a Creative Commons Attribution 4.0 International License.
![]()
A New Edition of Web of Science
Journal Impact Factor
2022: 0.5
Five Year: 0.8
Journal is Indexed in

Cabells Whitelist
![]()


