Spectrophotometric Determination Studies of Cefotaxime (CFX) and their CFX- Cd (II) and CFX- Cu (II) Complexes
S. Kondaiah1 ,P. Govinda Chowdary1, G. Naga Raja Reddy 2and V. Suryanarayana Rao2
1Department of Chemistry. Vignan Institute of Technology and Science, Deshmukhi, Pochampally,Nalgonda,Telangana State, 508284 India.
2Department of Chemistry. Srikrishan Devarya University, Venkateswrapuram,Anantapur ,A.P, 515001.
DOI : http://dx.doi.org/10.13005/ojc/330130
In this work Cefotoxime (CFX) and its Cd (II) and Cu (II) metal complexes determination were carried out by spectrophotometric method. The following experimental procedures like effect of pH, effect of metal ion concentration, effect of drug concentration, effect of time, effect of organic solvents and the composition of the complex by mole ratio and job’s continuous variation method and interference studies were carried out for the determination of metal ions and drug. In this research work, it is clear that Cd forms a stable 1:1 colored complex with CFX in basic medium and Cu forms stable 1:1 colored complex with CFX in acidic medium. Effect of pH was studied for CFX- Cd (II) and CFX- Cu (II) complexes; it is noticed from that at pH 11 CFX- Cd (II) and at pH 5.5 CFX- Cu (II) colored complexes were formed. In these reactions can be found the metal ions in the range 1.12 to 6.74 and 3.812 to 8.895 µg/ml and the drug in the range 0.02 to 0.14 mg/ml respectively for CFX- Cu (II) and CFX- Cu (II) complexes. Effect of time clearly suggest , that the maximum absorbance is obtained only after heating the mixture to 40° & 60°C respectively for CFX- Cd (II) and CFX- Cu (II) complexes. It has been observed that the absorbance values remain constant thereafter; it indicates the formation of 1:1 stable metal complexes.
KEYWORDS:Spectrophotometric Determination; Cefotaxime; Cadmium; Copper.
Download this article as:| Copy the following to cite this article: Kondaiah S, Chowdary P. G, Reddy G. N. R, Rao V. S. Spectrophotometric Determination Studies of Cefotaxime (CFX) and their CFX- Cd (II) and CFX- Cu (II) Complexes. Orient J Chem 2017;33(1). |
| Copy the following to cite this URL: Kondaiah S, Chowdary P. G, Reddy G. N. R, Rao V. S.Spectrophotometric Determination Studies of Cefotaxime (CFX) and their CFX- Cd (II) and CFX- Cu (II) Complexes. Orient J Chem 2017;33(1). Available from: http://www.orientjchem.org/?p=29810 |
Introduction
The cephalosporins are β-lactam antibiotics isolated from cephalosporium species and/or prepared semi-synthetically. This comes under the class of 7-amino cephalosporonic acid (7-ACA) derivatives and are much more acid-stable than the corresponding 6-APA compounds. The cephalosporins have a mechanism of action similar to that of penicillin, mainly; they inhibit the cross-linking of the peptidoglycan units in the bacterial cell wall by inhibiting the transpeptidase enzyme. Cefotaxime is a third generation cephalosporin, it was the first to become available and made a landmark in cephalosporin history as it proved to be the answer to the microbes resistant to 1st and 2nd generation agents. It is less active than first generation drugs against gram-positive but have a much expanded spectrum of activity [1] against gram – negative organisms. Cefotaxime chemically Sodium (6R, 7R)-3-[(acet-yloxy) methyl]-7-{[(Z)-2-(2-aminothiazol-4-yl)-2-(methoxyimino) acetyl]-8-oxo-5-thia-1-azabicyclo [4.2.0] oct-2-ene-2-carboxylate. It is less active than first generation drugs against gram-positive but have a much expanded spectrum of activity against gram – negative organisms. The structure of the cefotaxime (Fig.1) is shown below.
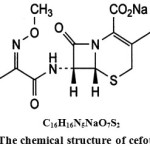 |
Figure 1: The chemical structure of cefotaxime |
It inhibits bacterial wall synthesis of actively dividing cells by binding to one or more penicillin binding proteins. These proteins serve as enzymes that catalyse the final stages of bacterial cell wall synthesis. As a result a defective cell wall is formed that is osmotically unstable. It has good activity against [2-3] S. Aurens, S. Fecails, Bacteroids and many enterobacteriaceae. Cefotaxime has wide clinical applications including treatment of infection in the respiratory tract, skin, bone and joint gynecologic, septicemia, urinary tract, and documented or suspected meningitis.
Most of the analytical chemists having greater attention these compounds (cephalosporins) for their determination in pharmaceutical formulations [4] by using metal ions. Cephalosporins very important today because serious ailments are controlled by these drugs. Many researchers have also dedicated their efforts to develop a simple, rapid and sensitive analytical method for the determination [5-6] of cephalosporins in pure, dosage form and biological samples. Generally, the assay of cephalosporins previously been achieved by several analytical techniques such [7-8] as, HPLC voltametry, ionometry, flow injection analysis, fluorimetry [9-10] etc.
In this research article carried out a spectrophotometric method for determination of Cefotaxime sodium in pure and pharmaceutical formulation dosage form by using cadmium and copper. In this method reaction of drug with cadmium (II) in basic and with copper (II) in acidic condition respectively to form stoichiometrically a yellow CFX- Cd (II) and light yellow color CFX-Cu(II) complexes at optimum conditions. This method is convenient, simple, rapid, economically viable and selective method for the determination of drug as well as metal ions in pharmaceutical formulations.
Experimental
Materials and Methods
All the molecular absorption measurements were made using UV-Vis spectrophotometer type Shimadzu model UV-160 equipped with 10mm matched quartz cell. For pH measurement it is used a pH Meter (Elico) with combined electrode. Well calibrated glassware was used to carry out experiments. Hydrochloric acid, sodium acetate, acetic acid, ammonia, methanol, ammonium chloride, cadmium chloride and copper chloride were purchased from Merck.
Cefotaxime tablets were purchased from Ranbaxy laboratories Ltd.
All the used chemicals were of analytical reagent grade; deionized water was used for diluting the reagents and samples.
Preparation o Buffer Solution
The buffer solutions are prepared by mixing appropriate quantities of the following solutions. Exact pHof the solutions was measured using pH meter.
| Buffer components of the solution |
pH |
| 0.1M Hydrochloric acid | 1.0 |
|
0.2M sodium acetate solution + 0.1M Hydrochloric acid |
2.0 – 3.0 |
| 0.2M Acetic acid + 0.2M sodium acetate | 4.0 – 7.0 |
| Ammonia + Ammonium chloride solution | 8.0 – 11. 0 |
Preparation of Cefotaxime Solution
20 tablets of cefotaxime is ground into a fine powder and 100 mg of the powder is weighed into a 100ml standard flask. Solution of 5M HCL is added and the solution is heated on boiling water bath for 30 minutes. The solution is heated on boiling water bath for 30 minutes. The solution is cooled; 5ml of DMF is added and made up to the mark with double distilled water. 10ml of this solution is neutralized with 10ml of 2.5M NaOH and the solution is made to 100ml to obtain a final concentration of 0.1 mg/ml. This solution is used for further studies after appropriate dilutions.
Preparation of Cu (II) and Cd (II) Metal Solutions
Fresh stock solutions of 1 x 10⁻⁴M of metal salts (Cu (II), 2.5mg /100 ml and Cd (II), 3.5 mg /100 ml) ,were prepared by dissolving accurately weighed amounts of the metal salts in appropriate volumes of de-ionized water.
Preparation of CFX-Cd (II) Complex
CFX-Cd (II) solution was prepared, 1 ml of 1 x 10⁻³M copper sulphate solution, 8 ml of pH 5.5 buffer,, 1ml of drug solution of 0.1mg/ml concentration are taken in a 10ml volumetric flask. The contents are mixed well to get a solution of uniform concentration. Similarly, a blank solution without the drug is prepared.
Preparation of CFX- Cu (II) Complex
CFX-Cu (II) solution was prepared, 1 ml of 1 x 10⁻³M copper sulphate solution, 8 ml of pH 5.5 buffer, 1ml of drug solution of 0.1mg/ml concentration are taken in a 10ml volumetric flask. The contents are mixed well to get a solution of uniform concentration. Similarly, a blank solution without the drug is prepared.
Results and Discussion
The Absorbance Spectral Data of Cefotaxime (CFX) and their CFX-Cd (II) and CFX- Cu (II) Complexes
The spectrum of the CFX, CFX- Cd (II) and CFX- Cu (II) solutions were recorded in the wavelength range 300 to 400 nm against a blank solution. The spectrums of reaction mixtures are recorded against their respective blank solutions were shown in (Fig.2) Table.1.
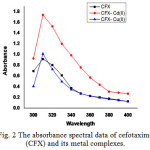 |
Figure 2: The absorbance spectral data of cefotaxime (CFX) and its metal complexes. |
Table 1: Spectral data of CFX, CFX-Cd (II) and CFX- Cu (II) complexes.
|
[Cd(II)] = 1 x 10– 4M [CFX] = 0.1 mg/ml pH = 11 Absorbance at 350nm |
[Cu(II)] = 1 x 10– 4M[CFX] = 0.1 mg/mlpH = 5.5Absorbance at 350nm |
| S. No. | λ | Absorbance of CFX | Absorbance of CFX – Cd(II) | Absorbance of CFX – Cu(II) |
| 1 | 300 | 0.690 | 0.925 | 0.406 |
| 2 | 310 | 0.915 | 1.738 | 1.012 |
| 3 | 320 | 0.801 | 1.523 | 0.721 |
| 4 | 330 | 0.610 | 1.199 | 0.494 |
| 5 | 340 | 0.370 | 0.984 | 0.346 |
| 4 | 350 | 0.270 | 0.757 | 0.270 |
| 7 | 360 | 0.225 | 0.568 | 0.223 |
| 8 | 370 | 0.200 | 0.434 | 0.191 |
| 9 | 380 | 0.177 | 0.305 | 0.166 |
| 10 | 390 | 0.149 | 0.286 | 0.143 |
| 11 | 400 | 0.123 | 0.268 | 0.121 |
Effect of pH
The author has carried out the effect of pH for the development of color between cadmium, copper and CFX. The data revealed that cadmium forms a complex in the basic and copper forms the complex [11-12] in acidic medium. Hence, effect of pH is studied in the range 9.5 to 11.5 for CFX- Cd (II) and 5.0 to 8.0 for CFX- Cu (II) complexes. Absorbance of metal complexes increased compared with the drug solution; it indicates the formation of metal complexes. It is noticed from the graph that pH of 11 and 5.5 were suitable for carrying out further studies. The absorbance was maximized and the solutions were remains clear for quite a long time after the development of color. Graph is plotted (Figures 3 & 4) between pH and absorbance values are given in Table.2. The intensity of the color increases with time, but the maximum color develop is possible [13] only after heating the system for half an hour at 50 to 60°C. In explaining the results on CFX- Cd (II) and CFX- Cu (II) complexes [14 -15], the author has proved that hydrolysis of the drug are not required for complex formation. The unhydrolysed drug is sufficient and responsible for the color development. Only to achieve completion of the reaction, the system is to be heated to 50 to 60°C.
![Figure 3: Effect of pH on absorbance in CFX- Cd (II) [CFX = 0.1 mg/ml; Cd (II)] = 1 x 10⁻⁴M; Cu (II) = 1 x 10⁻⁴M; λ range =300 – 400 nm.]](http://www.orientjchem.org/wp-content/uploads/2017/02/Vol33No1_Spec_Kond_fig3-150x150.jpg) |
Figure 3: Effect of pH on absorbance in CFX- Cd (II) [CFX = 0.1 mg/ml; Cd (II)] = 1 x 10⁻⁴M; Cu (II) = 1 x 10⁻⁴M; λ range =300 – 400 nm.] |
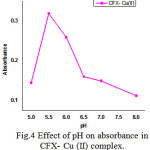 |
Figure 4: Effect of pH on absorbance in CFX- Cu (II) complex. |
Table 2: Effect of pH on absorbance in CFX- Cd (II) and CFX- Cu (II) complexes.
[Cd (II)] =1 x 10⁻⁴M; CFX = 0.1 mg/ml; Cu (II)] =1 x 10⁻⁴M CFX= 0.1 mg/ml; Absorbance at 350nm).
|
S.No |
CFX-Cd(II) complex |
CFX-Cu (II) complex |
||
|
pH |
Absorbance |
pH |
Absorbance |
|
|
1 |
9.5 |
0.187 |
5.0 |
0.145 |
|
2 |
10.0 |
0.349 |
5.5 |
0.318 |
|
3 |
10.5 |
0.502 |
6.0 |
0.259 |
|
4 |
11.0 |
0.654 |
6.5 |
0.160 |
|
5 |
11.5 |
0.513 |
7.0 |
0.149 |
|
6 |
12.0 |
0.470 |
8.0 |
0.112 |
Effect of Metal Ion Concentration
The effect of cadmium and copper concentrations on the absorbance the concentration of the metal ions vary in the range 1.1 to 6 x 10⁻⁵M and 6 to 14 x 10-5M respectively, for CFX-Cd (II) and CFX- Cu (II) keeping the CFX concentration is constant. The absorbance values are measured at 350nm against a blank solution containing no reagent. The absorbance values increase progressively and a linear graph is obtained between cadmium concentration [16] and absorbance and copper concentration and absorbance. The data are shown in Table 3 and Fig 5. These were fitted into the equations A350 = 0.0405x + 0.4141 and A350 = 0.0073x –0.0012 respecively for CFX-Cd (II) and CFX- Cu (II).
Table 3: Effect of Metal Ions Concentrations (Beer’s law) in CFX-Cd (II) and CFX –Cu (II) complexes.
|
[Cd(II)] = 1 x 10⁻⁴M [CFX] = 0.1 mg/ml pH = 11 Absorbance at 350nm |
[Cu(II)] = 1 x 10⁻⁴M [CFX] = 0.1 mg/ml pH = 5.5 Absorbance at 350nm |
|
S.No |
Effect of Metal ion concentration in CFX- Cd (II) complex | Effect of Metal ion Concentration in CFX-Cu (II) complex. | ||
| [Cd(II)] x 105M | Absorbance | [Cu(II)] x 105M | Absorbance | |
| 1. |
2 |
0.019 |
2 |
0.216 |
| 2 |
4 |
0.032 |
4 |
0.311 |
| 3 |
6 |
0.052 |
6 |
0.441 |
| 4 |
8 |
0.075 |
8 |
0.552 |
| 5 |
10 |
0.082 |
10 |
0.598 |
| 6 |
12 |
0.089 |
12 |
0.570 |
| 7 |
14 |
0.115 |
14 |
0.569 |
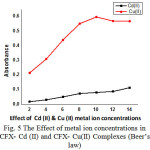 |
Figure 5: The Effect of metal ion concentrations in CFX- Cd (II) and CFX- Cu(II) Complexes (Beer’s law) |
Effect of Drug Concentration
The concentration of the drug is varied from 0.02 mg/ml to 0.14mg/ml keeping the metal ion concentration constant. The values of absorbance are measured at 350nm against the blank solution containing no reagent. The results are tabulated and shown in Table 4 (Fig.6) is also drawn between the concentration of the drug and absorbance values. It is clearly seen [17 -18] from the graph that a linear relationship exists between the drug concentration and absorbance.
Table 4: Effect of drug Concentration
|
[Cd(II)] = 1 x 10⁻⁴M [CFX] = 0.1 mg/ml pH = 11 Absorbance at 350nm |
[Cu(II)] = 1 x 10⁻⁴M [CFX] = 0.1 mg/ml pH = 5.5 Absorbance at 350nm |
|
S.No |
Effect of Drug concentration in CFX- Cd (II) complex | Effect of Drug concentration in CFX-Cu(II) complex. | ||
| [CFX)] mg/ml | Absorbance | [CFX)] mg/ml | Absorbance | |
|
1. |
0.02 |
0.039 |
0.02 |
0.016 |
|
2 |
0.04 |
0.169 |
0.04 |
0.047 |
|
3 |
0.06 |
0.325 |
0.06 |
0.097 |
|
4 |
0.08 |
0.450 |
0.08 |
0.137 |
|
5 |
0.1 |
0.580 |
0.10 |
0.169 |
|
6 |
0.12 |
0.672 |
0.12 |
0.218 |
|
7 |
0.14 |
0.743 |
0.14 |
0.256 |
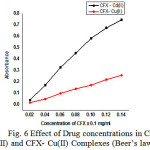 |
Figure 6: Effect of Drug concentrations in CFX- Cd(II) and CFX- Cu(II) Complexes (Beer’s law) |
Effect of Time
To best the reproducibility of the results and stability of the complex formed, the author measured the absorbance values for the same solutions [ 19–20 ] containing CFX- Cd (II) and CFX- Cu (II) complexes for one hour at an interval of 10 minutes. These values are shown in Table 5. From the data, it is clear that the absorbance values increase with time but maximum color intensity is obtained only after heating the system for 40 minutes. In CFX- Cd (II) complex the absorbance values [21] were started from 0.065 to 0.751, where as in CFX- Cu (II) complex absorbance values noticed at 0.035 to 0.261. Based on these observations, the absorbance values are measured in each case only after heating the system and achieving maximum color development. From the table, it is clear that the maximum absorbance is obtained only after heating the mixture to 40° & 60°C respectively for CFX- Cd (II) and CFX- Cu (II) complexes. It has been observed that the absorbance values remain constant thereafter.
Table 5: Effect of Time
|
[Cd(II)] = 1 x 10⁻⁴M [CFX] = 0.1 mg/ml pH = 11 Absorbance at 350nm |
[Cu(II)] = 1 x 10⁻⁴M [CFX] = 0.1 mg/ml pH = 5.5 Absorbance at 350nm
|
|
S.No |
Effect of Time in CFX- Cd (II) complex | Effect of time in CFX-Cu (II) complex. | ||
|
Time in minutes |
Absorbance |
Time in minutes |
Absorbance |
|
|
1. |
2 |
0.065 |
2 |
0.035 |
|
2 |
10 |
0.126 |
10 |
0.062 |
|
3 |
20 |
0.169 |
20 |
0.080 |
|
4 |
30 |
0.224 |
30 |
0.097 |
|
5 |
40 |
0.264 |
40 |
0.102 |
|
6 |
50 |
0.302 |
After heating (60°C) |
0.261 |
|
7 |
60 |
0.302 |
||
|
8 |
After heating (40°C) |
0.751 |
||
Effect of Organic Solvents
In these experiments relating to the effect of solvents. Therefore, carried out the effect of acetone, dioxane, DMF and methanol. In these studies, the solvent is kept at 50% by volume. The absorbance values were measured in each case at 350nm. The data are presented in Table 6. It is seen from the table that all the solvents chosen for the study affect the color [22- 23] formation. This is attributed to changes in the dielectric constant of the medium as well as non aqueous conditions.
Table 6: Effect of organic solvents on absorbance
|
[Cd(II)] = 1 x 10⁻⁴M [CFX] = 0.1 mg/ml pH = 11 Absorbance at 350nm |
[Cu(II)] = 1 x 10⁻⁴M [CFX] = 0.1 mg/ml pH = 5.5 Absorbance at 350nm |
|
S.No |
Effect of organic solvents on absorbance in CFX- Cd (II) complex | Effect of organic solvents on absorbance in CFX-Cu (II) complex. | ||
| Solvent (50% V/V) | Absorbance | Solvent (50% V/V) | Absorbance | |
| 1. |
None |
0.487 |
None |
0.109 |
| 2 |
Acetone |
0.729 |
Acetone |
0.429 |
| 3 |
Dioxane |
0.107 |
Dioxane |
0.113 |
| 4 |
DMF |
0.409 |
DMF |
0.221 |
| 5 |
Methanol |
0.450 |
Methanol |
0.194 |
Composition of the Complex
The following methods were chosen for the determination of the composition and stability constants of these complexes.
Job’s Continuous Variation Method
While keeping the total volume constant, the volumes of equimolar solutions of metal ion and drug are continuously varied. The absorbance values of each mixture are measured at 350nm against the respective reagent blank. The values are presented in Table 7.When volume of the reagent is plotted against the absorbance values an ‘inverted U–shaped curves’ were obtained as shown in the Figure 7. It can be deduced from the graphs that Cd and Cu forms a stable 1: 1 complex [24 -25] with CFX under these experimental conditions. The stability constant values of these complexes are 6.7 x 10⁶ and 17.6 x 10⁶ respectively for CFX- Cd (II) and CFX- Cu (II).
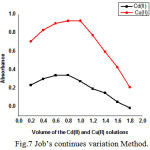 |
Figure 7: Job’s continues variation Method. Click here to View Figure |
Mole Ratio Method
In this method, the volume of the metal ions was maintained constant and that of CFX is continuously varied. The absorbance was measured at 350nm against the reagent blank. A graph is drawn between the volume of CFX and absorbance [26]. The data are shown in Table 8 and Fig 8. The point of the intersections in graph gives the composition of these complexes [27-28]. It is seen from the figure that Cd and Cu forms 1:1 complex with CFX under these experimental conditions.
Table 8: Mole – Ratio Method for the Determination of CFX- Cd (II) and CFX- Cu (II) Complexes.
|
[Cd(II)] = 1 x 10⁻⁴M [CFX] = 0.1 mg/ml pH = 11 Absorbance at 350nm |
[Cu(II)] = 1 x 10⁻⁴M [CFX] = 0.1 mg/ml pH = 5.5 Absorbance at 350nm |
|
S.No |
Mole – Ratio Method of CFX- Cd (II) complex |
Mole – Ratio Method of CFX-Cu (II) complex. |
||
|
Volume of CFX in ml |
Absorbance |
Volume of CFX in ml |
Absorbance |
|
| 1. |
1 |
0.346 |
1 |
0.091 |
| 2 |
2 |
0.705 |
2 |
0.210 |
| 3 |
3 |
1.186 |
3 |
0.316 |
| 4 |
4 |
1.451 |
4 |
0.402 |
| 5 |
5 |
1.670 |
5 |
0.540 |
| 6 |
6 |
1.804 |
6 |
0.489 |
| 7 |
7 |
1.802 |
7 |
0.557 |
| 8 |
8 |
1.802 |
8 |
0.652 |
| 9 |
9 |
1.893 |
9 |
0.620 |
| 10 |
10 |
1.890 |
10 |
0.570 |
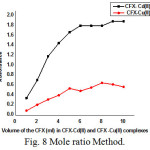 |
Figure 8: Mole ratio Method.
|
Interference Studies
In a complexation reaction between the metal ion and the ligand, there is a possibility of other metal ions to interfere. Anions might influence the color formation reaction. Hence, the author has chosen certain bivalent cations and some common anions carry out the interference studies [28-29] on CFX- Cd (II) and CFX – Cu (II) complexes. To know the effect of various cations and anions on the determination of Cd and Cu, We have studied the effect of various metal ions which are usually associated with Cd and Cu. The data are presented in Table 9. From the data, it is seen in the CFX- Cd (II) complex, most of the anions can be tolerated [30 -33] where as cations studied seriously interfere with the determination of cadmium. Where as in CFX- Cu (II) complex the absorbance values are revealed that neither the cations nor the anions seriously interfere with this color formation reaction.
Table 9: Interference by Cations and Anions In CFX- Cd (II) and Cu (II) Complexes.
|
[Cd(II)] = 1 x 10⁻⁴M [CFX] = 0.1 mg/ml pH = 11 Absorbance at 350nm |
[Cu(II)] = 1 x 10⁻⁴M [CFX] = 0.1 mg/ml pH = 5.5 Absorbance at 350nm |
|
S.No |
Interference by Cations and Anions in CFX- Cd (II) complex |
Interference by Cations and Anions in CFX- Cu (II) complex |
||||||
|
Added Cations (1 x 10⁻³M) |
Absorbance |
Added Cations (1 x 10⁻³M) |
Absorbance |
Added Cations (1 x 10⁻³M) |
Absorbance |
Added Cations (1 x 10⁻³M) |
Absorbance | |
|
1 |
None |
0.852 |
None |
0.846 |
None |
0.128 |
None |
0.167 |
|
2 |
Nickel |
0.504 |
Chloride |
0.755 |
Nickel |
0.115 |
Chloride |
0.163 |
|
3 |
Cobalt |
0.742 |
Nitrate |
0.769 |
Cobalt |
0.116 |
Nitrate |
0.176 |
|
4 |
Copper |
0.404 |
Sulphate |
0.796 |
Cadmium |
0.120 |
Sulphate |
0.176 |
|
5 |
Molybdenum |
0.774 |
Oxalate |
0.819 |
Molybdenum |
0.100 |
Oxalate |
0.191 |
|
6 |
Manganese |
0.882 |
Phosphate |
0.769 |
Manganese |
0.117 |
Phosphate |
0.173 |
|
7 |
—- |
—- |
Tartrate |
0.780 |
—- |
—- |
Tartrate |
0.133 |
Conclusion
Thus, in this research work, it is clear that Cd form a stable 1:1 colored complex with CFX in basic medium and Cu forms stable 1:1 colored complex with CFX in acidic medium. Effect of pH is studied for CFX- Cd (II) and CFX- Cu (II) complexes; it is noticed from that at pH 11 CFX- Cd (II) and 5.5 CFX- Cu (II) colored complexes were formed. From mole ratio method and Jobs continuous variation methods ,it clearly showed that Cd and Cu forms a stable 1: 1 complexes with CFX and the stability constant values of these complexes were 6.7 x 10⁶ and 17.6 x 10⁶ respectively for CFX- Cd (II) and CFX- Cu (II). In these reactions can be spectrophotometric determination of metal ions in the range 1.12 to 6.74, 3.812 to 8.895 µg/ml, and the drug in the range 0.02 to 0.14 mg/ml respectively for CFX- Cu(II) and CFX- Cu(II) complexes. Effect of time clearly suggest , that the maximum absorbance is obtained only after heating the mixture to 40° & 60°C respectively for CFX- Cd (II) and CFX- Cu (II) complexes. It has been observed that the absorbance values remain constant thereafter. This color reaction can be used advantageously for the determination of metal ion as well as the drug. As this method is based on the measurement of absorbance at 350nm, this can be readily adopted by any pharmaceutical laboratory involved in the preparation of cephalosporins. This method is can be used for the determination of metal ions as well as drug in pharmaceutical formulations because it is a simple, convenient and rapid technique.
References
- Okawa, S.; Yamazaki, K.; Ishikawa, T., Bunsekikagaku,1998, 47: 861-866.
CrossRef - Staden, J. F.; Matoetoe, M. C., Anal. Chim. Acta, 2000, 411: 201 -207.
CrossRef - Cundeva, K.; Stafilov, T., Anal. Lett, 1997, 30: 833- 845.
CrossRef - Necemer, M.; Kump, P., Spectrochim. Acta Part B, 1999, 54: 621 -625.
CrossRef - Ivanova, E.; Benkheda, K.; Adams, F., JAAS,1998, 13: 527- 530.
- Gaspar, A.; Posta., J. Anal. Chim. Acta, 1997., 354: 151 – 158.
CrossRef - Baird, C., Environmental Chemistry; W. H. Freeman and Company. 1999, 386-395.
- K.Deepa, Y.Lingappa., J.Biomolecular Spectroscopy, 2014, 124:102-107.
CrossRef - Krishnamury, K. V.; Reddy, M. M., Anal. Chem. 1977,.49.,222 – 226.
CrossRef - Seung Kwon Lee and Hee-Seon Choi*., Bull. Korean Chem. So, 2001, 22(5): 463-466.
- Lee, J.; Choi, J.; Choi, H.; Kim, Y., Anal. Sci. & Tech,1995, 8:321-329.
- Nigam P, Mohan S, Kundu S, and Prakash R., Talanta , 2009.,.77:1426-1431.
CrossRef - El-Maali N A, Osman A H, Aly A A M and Al-Hazmi G A A., J. of Bioelectrochemistry, 2005, 65: 95-104.
CrossRef - Samanidou V F, Tsochatzis E D, and Papadoyannis I N., J. of Microchim Acta,2008 160: 471-475.
CrossRef - Bafeltowskaa J J, Buszmana E, Mandatb K, and Hawranekb J., J. of Chromatography A, 2002, 976:249-254.
CrossRef - Zendelovska1 D, Stafilov T, and Miloševski P., J. of Bulletin of the Chemists and Technologists of Macedonia, 2003, 22(1): 39-45.
- Sharma P, Chawla H P S and Panchagnula R., J. of Pharmaceutical and Biomedical Analysis,2002, 27(1-2): 39-50.
CrossRef - Samanidou V F, Hapeshi E A and Papadoyannis I N., J. of chromatography . B 2003,788(1): 147-158.
CrossRef - Ling S S N, Yuen K H and Barker S A., J. of chromatography B, 2003,783(1) : 297-301.
CrossRef - Aleksi M M, Kapetanovi V, Atanackovi J, Joci B and Zeˇcevic M., Talanta, 2008 77:131-137.
CrossRef - Aleksic M M and Kapetanovic V., J. of Electroanalytical Chemistry, 2006, 593: 258-266.
CrossRef - Kulapina O I, Baraguzina V V and Skoblikova N V., Pharmaceutical Chemistry Journal, 2008, 42 (3): 48-50.
CrossRef - Ayad M M, Shalaby A A, Abdellatef H E and Elsaid HM., J. of Pharmaceutical and Biomedical Analysis, 1999 18(6): 975-983.
CrossRef - Amin A S and Ragab G H., Spectrochimica Acta Part A, 2004, 60(12): 2831-2835.
CrossRef - Rao G D, Kumar K G and Chowdary K P R., Indian Journal of Pharmaceutical Sciences, 2000, 60(2): 161-163.
- El-Maali N A, Osman A H, Aly A A M and Al-Hazmi G A A., Bioelectrochemistry, , 2005,65(2): 95-104.
CrossRef - Aleksić M. M. and Kapetanović V., J. of Electroanalytical Chemistry, 2006, 593(1-2): 258-266.
CrossRef - Morelli B., J. of Pharmaceutical and Biomedical Analysis, 2003, 32(2): 257-267.
CrossRef - Albert S Meyer Jr., and Gilbert H Ayres., J Am Chem Soc, 1957, 79: 49-53.
CrossRef - Anacona J R and Da Silva G., J. of the Chilean Chemical Society, 2005, 50(2): 447-450.
CrossRef - S.Kondaiah1*, M.S. Surendra Babu2*, V. Surya NarayanaRao., Asian j. Research Chem, 2011,4 (10): 1587- 1590.
- Vinnakota Srilalitha, Aluru Raghavendra Guru Prasad, Kakarla Raman Kumar, Vahi Seshagiri, Lakshmana Rao and Krishna Rao., FACTA UNIVERSITATIS Physics, Chemistry and Technology, 2010,8: 15-24.
- V. Veeranna , A. Raghavendra Guru Prasad and V. Suryanarayana Rao., Analele UniversităŃii din Bucuresti – Chimie (serie nouă), 2010, 9: 69-76.

This work is licensed under a Creative Commons Attribution 4.0 International License.
![]()
A New Edition of Web of Science
Journal Impact Factor
2022: 0.5
Five Year: 0.8
Journal is Indexed in

Cabells Whitelist
![]()


