Preparation, Characterization and Photocatalytic Activities of TiO2 towards Methyl Red Degradation
Aware Dinkar Vishwanath1, Jadhav Shridhar Shankar2 Navgire Madhukar Eknath3, Athare Anil Eknath2 and Kolhe Nitin Haribhau2
1Department of Chemistry, Arts, Commerce and Science College Sonai, Tal. Newasa, Dist. Ahmednagar-414603, Affiliated to S.P. Pune University, India.
2P.G. Department of Chemistry, New Arts, Commerce and Science College, Ahmednagar, 414001, Affiliated to S.P. Pune University, India.
3Jijamata College of Science and Arts, Bhende, Ahmednagar 414 605, Affiliated to S.P. Pune University, India.
Corresponding Author E-mail: ssjadhav1957@gmail.com
DOI : http://dx.doi.org/10.13005/ojc/330111
Article Received on :
Article Accepted on :
Article Published : 09 Feb 2017
Highly efficient, photoactive, nanocrystalline TiO2 powder was prepared with the help of modified sol-gel method. The prepared nanomaterials were characterized by modern techniques such as, TG-DTA, XRD, FE-SEM, EDX, TEM, BET surface area and FT-IR analysis for the identification of phase structure, phase composition and morphology. Formation of thermally stable, nanocrystalline, highley photocatalytic active, tetragonal anatase Titania was confirmed by TGA-DTA, XRD and HR-TEM. Similarly, FE-SEM confirms spherical, cauliflower like morphology for all Titania samples prepared with different cationic surfactants. The presence of mesoporous Titania was also confirmed by N2 adsorption-desorption. The effect of addition of various surfactants significantly improves the photocatalytic activity. Prepared nanomaterials were successfully tested under UV-Vis light region for photodegradation of Methyl Red (MR) dye material which is act as water pollutant. The C16TAB assisted Titania exhibits enhance photocatalytic efficiency as compared to industrially applied photocatalyst, Titania (Degussa P25) and zinc oxide under similar experimental condition.
KEYWORDS:TiO2 nanoparticles; cationic surfactants; sol-gel synthesis; photocatalysis; methyl red
Download this article as:| Copy the following to cite this article: Vishwanath A. D, Shankar J. S, Eknath N. M, Eknath A. A, Haribhau K. N. Preparation, Characterization and Photocatalytic Activities of TiO2 towards Methyl Red Degradation. Orient J Chem 2017;33(1). |
| Copy the following to cite this URL: Vishwanath A. D, Shankar J. S, Eknath N. M, Eknath A. A, Haribhau K. N. Preparation, Characterization and Photocatalytic Activities of TiO2 towards Methyl Red Degradation. Orient J Chem 2017;33(1). Available from: http://www.orientjchem.org/?p=29928 |
Introduction
Removal of toxic and harmful organic effluents from environment using advanced oxidation process (AOP) has been attracted extensive attention in today’s scientific world [1]. Semiconducting metal oxides like TiO2, ZnO are most widely used for environmental remediation in heterogeneous photocatalysis [2, 3]. The Titania is important heterogeneous catalysts used for water splitting reported by Honda and Fujishima [4]. Titania is most studied and used semiconducting photocatalyst in the field of heterogeneous photocatalysis due to its easily availability, nontoxicity, reusability and recyclability [5, 6]. Also its high chemical stability towards the photocorrosion and strong oxidizing property of holes produced by photons during photolysis are the most important advantages over commercially zinc oxide photocatalyst. The photocatalytic activity of Titania is mainly depends on its polymorphic form, crystallinity, particle size, surface area, surface adsorption-desorption and use of synthetic methodology [7, 8]. Out of three polymorphs, anatase is more photocatalytically active than rutile, but it is susceptible to thermal treatment and hence, get radially converted to most thermally stable photoinactive rutile polymorphs when calcined at higher temperature. The anatase Titania has wide band gap energy and therefore its photocatalytic applications are limited to 3-5% of visible light. Various synthetic methodology including hydrothermal, sol-gel, co-precipitation, combustion, sol-gel- auto-combustion, ultrasonic modified by sol-gel, microwave assisted sol-gel [9-12] are used for the preparation of nanocrystalline mesoporous anatase Titania nanomaterials. In most of the synthetic methods mineral acids, bases and costly hazardous organic reagents are used for the preparation of nanocrystalline, mesoporous, anatase Titania. The surfactant templates are mostly used to control the particle size, phase transformation and for improvement in the surface morphology like crystallinity and mesoporous properties of Titania. The cationic surfactant, cetyl trimethyl ammonium bromide (CTAB) is most widely used hydrothermal [13, 14] and sol-gel [8, 15] preparation of mesoporous Titania nanoparticles. CTAB is mostly used in the reduction of grain size and for stability of anatase polymorphic phase upon high temperature thermal treatment [16].
In this study we report the preparation of highly efficient, photoactive, nanocrystalline TiO2 powder with the help of ultrasonic Sonicator. It was modified by using various surfactants and sol-gel method. After calcination at 500°C for 4 hours, were characterized using modern analytical techniques and tested for the photocatalytic degradation of Azo dye, methyl Red (MR). The photocatalytic application of prepared Titania nanoparticles were also simultaneously compared with commercial material like TiO2 (Degussa, P-25) and ZnO using same parameters.
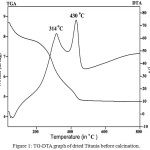 |
Figure 1: TG-DTA graph of dried Titania before calcination |
Experimental
Materials
A.R. grade chemicals were used for preparation without further purification. Titanium(IV) Butoxide [Ti(C4H9O)4], cationic surfactants: i.e., Cetyl Ttrimethyl Ammonium Bromide (C16TAB), Octadecyl Trimethyl Ammonium Bromide (C18TAB), Cetyl Trimethyl Ammonium Chloride (CTACl) and Benzalkonium Chloride (BAC) were obtained from Sigma-Aldrich. TiO2 (Degussa, P-25), Zinc oxide (ZnO), Isopropyl Alcohol [(CH3)2CHOH] and Methyl Red (MR) were received from SD Fine Chemicals Ltd, India, while Ethyl Alcohol is obtained from local alcohol distillery plant. All the experiments were done using double distilled deionized water as a solvent.
Preparation of TiO2 nanoparticles
The preparation of Titania (TiO2) was carried out by sol-gel method using water-alcohol mixture as a solvent. The procedure includes slow addition of Ethyl Alcohol (160 mL) and Isopropyl Alcohol (20 mL) with Titanium (IV) Butoxide (20 g) of under sonication at the temperature 40°C for 30 minutes. To this solution C16TAB (2 g) surfactants in alcoholic condition was added. The resultant solution was mixed with double distilled water (100 mL) under constant magnetic stirring (800 rpm) at 60°C for 4 hours and finally dried in oven for 12 hours at 110°C. Finally, the resultant dry powder was calcined at 500°C for 4 hours in muffle furnace under static air atmosphere. Similarly, all other TiO2 nanomaterials were prepared only by changing the surfactant.
Characterization
The all prepared nanomaterials were characterized by sophisticated modified modern techniques such as, TG-DTA, XRD, FE-SEM and EDX, TEM, BET surface area and FT-IR analysis for the identification of phase structure, phase composition and morphology.
Photocatalytic Activity results of the Methyl Red (MR) Dyes
The photocatalytic degradation of MR dye was carried out in 250 ml double-jacket cylindrical reactor. The temperature of the reactor was controlled by circulating water around it. The photoreactor was set 30 cm away from the lamp. The irradiation was supplied by using metal halide bulb (Halonix, 400W). A catalyst (50 mg/L) is added in the MR dye solution (30 mg/L). Firstly, the dye solution with catalyst was dispersed by using ultrasonic sonicator and then stirred magnetically in in absence of light (dark) for 30 minutes to attain adsorption-desorption equilibrium. Immediately, light source was switch on, absorption of solution was measured at λmax = 429 nm after the intervals of 15 min.
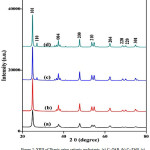 |
Figure. 2: XRD of Titania using cationic surfactants, (a) C16TAB, (b) C18TAB, (c) CTACl, and (d) BAC Click here to View Figure |
Results and Discussion
TG-DTA Analysis
Figure 1 gives the TG–DTA graph of Titania. The DTA curve distinctly shows two exothermic peaks, the first peak at 314°C, is due to the decomposition of residual organic compounds and added surfactants during synthetic process. While the second sharp peak at 430°C is due to the crystallization of Titania [17, 18]. The TGA curve gives total weight loss upto 44.83 wt % and it was ended at 497.8°C. Thus the prepared dry material was calcined at the temperature 500°C for 4 hours.
XRD Analysis study
The XRD peaks prepared Titania samples were shown in Figure 2. All XRD confirms the formation of nanocrystalline, tetragonal anatase Titania as a major polymorph for all cationic surfactants. The diffraction pattern of Titania prepared using C16TAB and C18TAB shows diffraction peaks at 2q° = 25.3, 37.8, 48.0, 54.1, 67.7, 70.3 and 76.0 mainly for the crystal planes of (101), (004), (200), (210) (204), (220), and (301) and matching to the Anatase TiO2 (JCPDS file 21-1272). In addition to tetragonal phase, XRD pattern for Titania with BAC and CTACl surfactant shows the presence of small fraction of Rutile phase (JCPDS No. 01-073-1765) may be due to the synthetic methodology used during the preparation of nanomaterials [15, 19].
The presence of pure anatase phase in case of both C16TAB and C18TAB samples can be explained by the fact that only anatase was already nucleated before calcination [20]. In other cases rutile phase was nucleated after the sol–gel process. The differences in phase of Titania, mainly due to the change in chemical structure and presence of counter ion on the surfactant used. The types of counter ion present in the surfactants controls the structure of the ionic micellar solution and the size of colloidal aggregates. The chloride ions gives more hydrated colloidal surface than the bromide ions [15]. Thus, the effect of the large bromide counter ion results in a delayed phase transition from anatase to rutile and in the stabilization of the anatase phase during preparation of Titania.
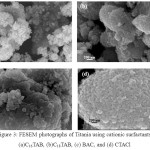 |
Figure 3: FESEM photographs of Titania using cationic surfactants, (a)C16TAB, (b)C18TAB, (c) BAC, and (d) CTACl Click here to View Figure |
Using Debye–Scherrer equation, the crystal size was calculated from the most intense peak (101),
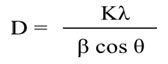
Where, D= Average Crystallite Size, K= 0.89, λ= 0.15406 nm (Cu Kα), β=FWHM, and θ= Diffraction Angle. The calculated values of crystal size were found in the range of 18.1-31.5 nm listed in the Table 1. The percent of Rutile fraction present in Titania was also calculated by following equation [22]
% Rutile = [1+ 0.8 IA/IR]-1 × 100
Where, IA=Integrated Intensity of Anatase (101) phase, IR=Integrated Intensity of Rutile (110) phase. The calculated values of Anatase and Rutile percentages are also shown in Table 1. The results show that negligible proportion of Rutile is observed for Benzalkonium chloride (BAC) and hexadecyl trimethyl ammonium chloride (CTACl) surfactants.
FESEM and EDS Analysis
The FESM analysis shown in Figure 3 gives spherical nanoparticles with cauliflower-like aggregates. The aggregation is usually observed due the agglomeration of nanoparticles with average grain size below 50 nm [15].
The elemental composition of the prepared Titania nanoparticles using C16TAB surfactant was given in the Figure 4. EDX spectrum represents the presence of proper proportion of Ti and O elements in prepared nanomaterials (Inset Fig. 4)
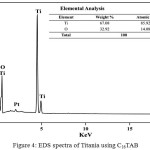 |
Figure 4: EDS spectra of Titania using C16TAB: Click here to View figure |
TEM and HRTEM study
Figure 5 (a, b) gives the TEM photographs of Titania prepared using C16TAB at different resolutions. TEM images show regular spherical likes morphology with average particle diameter in the range of 18-20 nm which gives similar in size already discussed in XRD study shows crystallite size with 18.1 nm. HRTEM image shown in Figure 5 (c) gives the existence of clear lattice fringes which (lattice spacing of 0.356 nm) confirms the formation of highly crystalline mesoporous anatase Titania nanoparticles. The SAED pattern of pure Anatase phase for Titania shown in Figure 5(d). The indexed SAED pattern confirms the formation of Anatase Titania, also there is no any evidence of rutile phase (JCPDS card no. 21-1272).
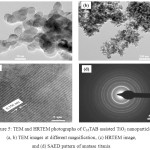 |
Figure 5: TEM and HRTEM photographs of C16TAB assisted TiO2 nanoparticles (a, b) TEM images at different magnification, (c) HRTEM image,and (d) SAED pattern of anatase titania |
BET Surface Area study
Figure 6 shows the nitrogen adsorption-desorption isotherm of representative sample, C16TAB-TiO2. It shows a type IV isotherm, which is typical for mesoporous materials. The BET specific surface area was found to be 43.4 m2/g, which is higher than non-porous TiO2 materials (2-30 m2/g). Average pore diameter was obtained from BJH analysis and was found to be 2.1 nm.
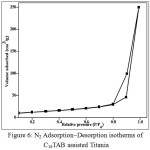 |
Figure 6: N2 Adsorption–Desorption isotherms of C16TAB assisted Titania Click here to View figure |
FT-IR Analysis
Figure 7 shows FTIR spectrums of Titania nanoparticles prepared using different cationic surfactants. FTIR spectrum for O-H stretching vibrations shows a broad spectrum in the range of 3299-3415 cm-1. Amount of O-H groups adsorbed on the surface of catalyst are responsible for enhancing the photocatalytic efficiency. The C16TAB assisted Titania exhibits highest peak intensity and it goes on decreasing from C16TAB to BAC. A sharp peak observed at 1636–1656 cm-1 corresponds to the H2O adsorbed on surface gives bending vibrations of H-O-H group [23]. A very weak band in the range 1324-1390 cm-1 is also seen in the FTIR spectra, which is due to the C-H vibrations of surfactants, existence of these peaks shows proper capping of Titania with different surfactants during preparation process [24]. A broad peak seen in the range between 581–918 cm-1 were due to the vibrations of six co-ordinated TiO6 octahedron and four coordinated Ti-O starching of anatase titania.
Table 1: Crystallite size calculated by using Debye- Sheerer equation
| No | Surfactant | Crystallite size (nm) | % Anatase | % Rutile | |
| Anatase | Rutile | ||||
|
C16TAB |
18.1 | – | 100 | – | |
|
C18TAB |
22.6 | – | 100 | – | |
|
CTACl |
22.9 | 31.5 | 92 | 08 | |
|
BAC |
31.3 |
31.3 |
88 |
12 | |
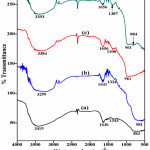 |
Figure 7: FT-IR spectrum of TiO2 using different surfactants, (a) C16TAB, (b) C18TAB, (c) CTACl, and (d) BAC Click here to View figure |
Photocatalytic Activity Result
Photocatalytic efficiency of nanocrystalline titania was examined for photodegradation of methyl red (MR) at λmax = 429 nm under UV-visible using spectrophotometer. Figure 8 shows absorption spectra of TiO2 with different cationic surfactants. Interestingly, it was observed that concentration of dye goes on decreasing on exposure of time and most efficient catalytic performance (95.0 %) was recorded for Titania nanoparticles prepared using C16TAB and order of photodegradation efficiency was found to be, C16TAB > C18TAB > CTACl > BAC upon 120 minutes light exposure time. Small grain size, nanocrystalline nature of pure anatase Titania prepared using C16TAB, results high photocatalytic activity and further decrease in the photocatalytic efficiency is due to the increase in grain size with partial phase transformation (anatase to rutile). Efficient photocatalytic activity is also confirmed from results of powder XRD, HRTEM and BET analytical results. The small grain size with nanocrystalline nature and mesoporous property of pure anatase Titania, lowers the recombination of e-/h+ and favors the formation of •OH radicals for better photocatalytic activity.
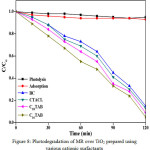 |
Figure 8: Photodegradation of MR over TiO2 prepared using various cationic surfactants Click here to View figure |
Under similar experimental condition prepared TiO2 (C16TAB) nanomaterials gives better activity as compare with commercially available photocatalyst TiO2 (Degussa, P-25) and ZnO shown in Figure 9.
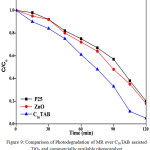 |
Figure 9: Comparison of Photodegradation of MR over C16TAB assisted TiO2 and commercially available photocatalyst Click here to View figure |
The probable reaction mechanism and kinetics of photodegradation of MR
TiO2 + hv → h+ + e–
OH − + h+ → HO•
O2+ H+ → HO2•
HO2• + e– → HO2–
HO2– + H+ → H2O2
H2O2 + e– → HO–+ HO•
MR + HO• → CO2 + H2O
Reaction kinetics of photodegradation of MR shows first order kinetics Langmuir Hinshelwood model,
Ln (Co/Ct) = k×t
Co – Concentration at zero time and Ct – Concentration at t time
Order of reaction was found to be 0.029 min-1, confirms the pseudo- first order kinetics mechanism.
Conclusion
With the use of modified sol-gel synthetic methodology, nanocrystalline Titania powder has been successfully prepared with help of different cationic surfactants considering their chain length and counter ions (chloride/bromide). The results of XRD and HRTEM confirm the formation of nanocrystalline, mesoporous anatase Titania polymorphs for C16TAB and C18TAB surfactants. While in case of CTACl and BAC, presence of highly reactive chloride counter ion facilitates quick hydrolysis of Titania precursor which results the increase in the grain size and anatase to rutile phase transformation. Titania nanoparticles prepared using C16TAB shows best photocatalytic performance (95%) for MR dye degradation due to its smallest chin length and presence of bulkier bromide counter ion in its structure which slows the rate of hydrolysis of titania precursor. It can be concluded that Titania nanoparticles prepared using C16TAB can be used for treatment of toxic environmental pollutants and industrial wastewater.
Acknowledgements
One of the authors (D.V.A.) is thankful to the University Grants Commission, New Delhi, India, for providing the Teacher Fellowship under Faculty Improvement. Similarly we are grateful to the Principal, Arts Commerce and Science College Sonai for giving permission and also thankful to the Principal, New Arts, Commerce and Science College, Ahmednagar for providing the all required laboratory facilities to carry out the work.
References
- Chan, S. H. S. ; Wu, T. Y., Juan , J. C. ; The, C. Y. J. Chem. Technol. Biotechnol. 2011, 86, 1130–1158.
CrossRef - Pelaez, M.; Nolan N. T.; Pillai, S. C.; Seery, M. K.; Falaras, P. A. ; Kontos G., Dunlop, P. S. M. ; Hamilton, J. W. J. ; Byrne J. A.; Shea, K. O. Entezari, M. H.; Dionysiou, D. D. Appl. Catal. B Environ. 2012 , 125, 331–349.
CrossRef - Udom, I.; Ram, M. K.;Stefanakos, E. K.;Hepp, A. F.; Goswami, D. Y. Mater. Sci. Semicond. Process. 2013, 16, 1–14.
CrossRef - Fujishima, K. A.; Honda, A. Nature. 1972, 238, 37-39.
CrossRef - Han, F.; Kambala, V. S. R.; Srinivasan, M. ; Rajarathnam, D. ;. Naidu, R “Appl. Catal. A Gen. 2009, 359, 25–40.
CrossRef - Malato, S.;Fernández-Ibáñez, P. ; Maldonado M. I.; Blanco, J.; Gernjak, W. Catal. Today, 2009, 147, 1–59.
CrossRef - Hanaor , D. A. H.; Sorrell, C. C. J. Mater. Sci., 2011, 46, 855–874.
CrossRef - Shibata, H. T.; Ogura, T. ; Mukai, T.; Ohkubo, H.; Sakai; Abe, M. J Am Chem Soc. 2005, 1127, 6396–16397.
- Rashad, M. M.; Shalan, A. E. J. Mater. Sci. Mater. Electron. 2013 , 24, 3189–3194.
CrossRef - Han, C.; Lee, H.; Han, S. Bull. Korean Chem. Soc. 2008, 29, 1495–1498.
CrossRef - Awati P. S.; Awate, S. V.; Shah, P. P.; Ramaswamy, V. Catal. Commun.2003, 4, 393–400.
CrossRef - Joo, J.; Kwon, S. G.; Cho, T.; Lee, Yu, M. J.; Yoon, J. . Phys. Chem. B. 2005, 109 (32), 15297–15302.
- CrossRef
- Li, R.; Dong, G.; Chen. G. New J. Chem. 2015, 39(9), 6854–6863.
- Tian, G.; Fu, H.; Jing, L.; Xin, B. K.; Pan, L. S. Phys. Chem. C. 2088 , 112, 3083–3089.
- Casino, S.; Lupo F. Di,; Francia, C. A.; Tuel,; Bodoardo, S.; Gerbaldi, C. J. Alloys Compd. 2014, 594, 114–121.
CrossRef - Tian, G.; Fu, H.; Jing, L.; Tian, C. J. Hazard. Mater. 2009.161(2-3),1122–1130.
- Sreethawong, T. ; Suzuki, Y.; Yoshikawa, S. J. Solid State Chem.2005,178, 329–338.
CrossRef - Mayo, M. J. J. Am. Ceram. Soc. 1957, 77, 1957–1960.
- Yang, Z.; Choi, D.; Kerisit, S.; Rosso K. M.; Wang D.; Zhang, J.; Graff, G.; Liu, J. J. Power Sources. 2009, 192, 588–598.
CrossRef - Ovenstone J.; Yanagisawa, K. Chem. Mater. 1999, 11, 2770–2774.
CrossRef - Aswal V. K.; Goyal, P. S. Chem. Phys. Lett. 2003, 368, 59–65.
CrossRef - Spurr , R. A. ; Myers, H. ACS Publ. 1957, 29, 760–762.
- Xiong, L.; Chen, C.; Chen, Q.; Ni, J. J. Hazard. Mater. 2011, 189(3), 741–748.
CrossRef - Manorama, S. V.; Reddy, K. M.;Reddy, C. V.; G., Narayanan, S.;Raja, P. R.; Chatterji, P. R. J. Phys. and Chem. of solids, 2002, 63, 135–143.
CrossRef

This work is licensed under a Creative Commons Attribution 4.0 International License.
![]()
A New Edition of Web of Science
Journal Impact Factor
2022: 0.5
Five Year: 0.8
Journal is Indexed in

Cabells Whitelist
![]()


