Preparation and Characterization of Nano Titanium Dioxide Photocatalysts Via Sol Gel Method over Narrow Ranges of Varying Parameters
1Physical Chemistry Department, National Research Centre, NRC, 33 EL Bohouth st.- Dokki-Giza- Egypt, P. O. 12622.
2Inorganic Chemistry Department, National Research Centre, 33 Elbohouth st.- Dokki-Giza- Egypt. P. O. 12622.
Corresponding Author E-mail: doaa egypt@yahoo.com
DOI : http://dx.doi.org/10.13005/ojc/330105
Download this article as:
![]()
The present study addresses a tailored preparation method of different structures of TiO2 nanoparticles over narrow ranges of varying parameters. In this work, titanium-n-butoxide was used to prepare TiO2 nanoparticles via sol gel method. The influence of the experimental preparation conditions: pH, drying and calcination temperatures were studied at ranges 5-9, 70-110oC, and 450-650oC, respectively. Slight changes through these mentioned ranges lead to drastically change in the phase transformation, degrees of crystallinity and crystal systems of the prepared TiO2. Pure anatase and rutile forms as well as different ratios of mixed phases were obtained. X-ray diffraction and transmitting electron microscope TEM techniques were used for the characterization of the prepared samples. The photocatalytic performance of TiO2 samples were evaluated according to their abilities toward the generation of the highly active hydroxyl radicals. Results indicate that the photocatalytic activities of TiO2 samples are dependent on their preparation experimental conditions. The maximal photocatalytic activities were noticed at high pH and drying temperature values.
KEYWORDS:TiO2 preparation; sol gel; TiO2 characterization; photocatalytic activities; fluorescent probe method
Introduction
Titanium dioxide is exceedingly considered as one of the most promising semiconductors. Its application areas cover a wide variety of different disciplines including both industrial and academic sectors [1-12].
Preparation of the photocatalytically active crystalline phases; anatase and rutile of TiO2 has been previously interpreted through different techniques. These techniques include the sol-gel [13-14], hydrothermal method [15], thermal hydrolysis [16], solvothermal [17], direct oxidation [18], electrodeposition [19], micelle and inverse micelle usage [20], emulsion or hydrolysis precipitation [21], chemical/physical vapor deposition [22], microemulsion processes [23,24], microwave approaches and ultrasonic [25,26]. These numerous studies addressed huge number of varieties including materials, experimental tools, instrumentations and experimental conditions. Accordingly, researchers have to go through various preparation methods to get TiO2 samples of certain desired characteristics. This may consequently add some difficulties especially in case of the lack of resources.
Among the numerous preparation techniques, sol gel is considered as one of the simple methods for synthesizing nanoparticles at ambient conditions. Besides, it does not require complicated set-up and the experimental conditions can easily be controlled [27].
In our previous work, evaluation of the photocatalytic activities of TiO2 in the efficient removal of different organic pollutants was conducted under identical conditions [28,29]. It was found that the performance of TiO2 was significantly affected by their capabilities of the surface hydroxyl radicals’ generation. Accordingly, TiO2 were divided into two categories: HRT and LRT; representing the photocatalysts that possess high and low rates of the hydroxyl radical formation, respectively. It was found that efficient removal of pollutants was achieved by using HRT photocatalysts whenever there is no surface interaction hindrance. However, some of TiO2 samples that belong to LRT group showed remarkable selectivity to certain pollutants. The amount of surface hydroxyl radicals’ generated by TiO2 particles is consistently influenced by their physico-chemical characteristics. These characteristics include crystal structure, morphology, crystallite size, phase composition, particle aggregation, calcination degrees and surface hydroxyl group content [30-33].
In the present work, preparation of different structures of TiO2 nanoparticles over narrow ranges of varying parameters is investigated. In this study, TiO2 was prepared from titanium tetra-n-butoxide via sol-gel method. Preparation of TiO2 via sol-gel method occurs through hydrolysis of titanium alkoxide followed by polycondensation process [34]. Previously, it was found that the anatase phase began to appear upon the calcination of the hydrolyzed species of titanium alkoxides at 450°C for 3 hours [35]. However, slight change in parameters such as pH, drying temperature, ionic species, calcination temperature and time significantly affect the TiO2 characteristics. Therefore, different crystallinities and structures of TiO2 can be achieved by controlling such parameters. The main target of this study is to prepare different possible ratios of rutile and anatase as photocatalytically active phases with different crystal properties. The photocatalytic activities of the prepared TiO2 nanoparticles were then evaluated with respect to their abilities to generate surface active hydroxyl radicals.
Materials and methods
All the chemicals were of analytical grade and were used without further purification. Titanium tetra- n-butoxide was obtained from Aldrich. Water used in this investigation was de-ionized water. Acetic acid, ammonia and propanol were purchased from Merck company.
Preparation of Nano Titanium Dioxide
Titanium dioxide nanoparticles were synthesized by sol- gel technique using titanium alkoxide as precursor [35-39]. 20 ml of titanium tetra- butoxide was mixed with 40 ml of 2-propanol in dry atmosphere. The mixture was added dropwise into another cold mixture of 20 ml deionized water and 20 ml of 2-propanol. The pH of the reaction media was adjusted by adding acetic acid or ammonia into the solutions. The addition time varied from 10 sec to 45 min with stirring at 400 RPM. The pH values were adjusted to 2, 7 and 9 and the corresponding samples are Ac, Nu, and Ak, respectively. The gel was dried in an air circulating oven at different temperatures overnight. (Ac1, Nu1, Ak1), (Ac2, Nu2, Ak3) and (Ac3, Nu3, Ak3) represent the dehydrated groups at 70°C, 90°C and 110°C, respectively. Finally, the dry gels were calcined in preheated muffle furnace at 450, 550 and 650°C for 3 hours.
Characterization of Tio2 Samples
The crystallinity of titanium dioxide powder was determined by X-ray diffraction using Ni-filled Cu Kα radiation using Bruker D8 Advanced Instrument (Germany D8 ADVANCE Cu target 1.54 Å, 40 kV, 40 mA). The reference data for the interpretation of the X-ray diffraction patterns were obtained from the International Centre for Diffraction Data – Joint Committee on Powder Diffraction Standards ICDD-JCPDS card files. The crystallite size (D) determined by the Scherrer’s formula (D = Kλ/(bcosθ). λ is the wavelength of X- ray radiation (CuKα = 0.15406 nm), K is a constant taken as 0.89, b is the line width at half maximum height (FWHM) of the peak, and d is the diffracting angle [40].
The samples examined in the transmission electron microscope (TEM) were prepared by dispersing these samples in distilled water followed by ultrasonic vibration for half an hour. A drop of the dispersed sample was placed onto a copper grid coated with a layer of amorphous carbon. A JEOL transmission electron microscope, Philips CM-120 was used to study the shape and particle size of TiO2 samples.
Photocatalytic Activity Evaluation of Tio2 Samples
The photocatalytic activities of TiO2 samples with respect to their abilities to generate surface active hydroxyl radicals were evaluated via the fluorescent probe method [41]. Illumination of the TiO2 nanoparticles were carried out using the UVA light bulbs (15 W). The light intensity was measured by YK-35UV radiometer, Taiwan, and it was 2.60 mW/cm2. The UV photoreactor lamps emitted the photons in the range from 320 to 410 nm. The photoluminescence spectra were measured using JASCO spectrophotometer ( v-570, Rel-00, Japan). The apparent rate constant (kf) was calculated using the slope of the fluorescence intensity–illumination time curves.
Results and Discussion
The nano titanium dioxide samples were prepared from titanium tetra- n-butoxide in three different pH’s, 2, 7 and 9. Acetic acid and ammonium solutions were used as hydrolyzing agents in pH’s, 2 and 9, respectively. The samples were left to stir at 400 rpm. The washed precipitates were dried in oven at different temperature 70, 90 and 110°C overnight. The samples were then calcined at three temperatures 450, 550 and 650°C for three hours. The calcined samples were directly investigated by using XRD, TEM, and fluorescence spectroscopy.
XRD Measurements
The XRD difractograms of the titanium dioxide indicate the formation of anatase and rutile phases with different degrees of crystallinity. As shown in figures 1, 2 and 3, the anatase phase consists of five characteristic peaks at 2θ = 25.28, 36.00, 36.96, 37.60, 48.00, 53.92, 55.04, 62.40 and 62.72 degrees. Meanwhile, in case of rutile form, the main characteristic peaks appear at 2θ = 27.36, 36.16 39.04, 41.28, 54.40, 56.64, 62.72 and 64.16 degrees. The experimental XRD data agree with the JCPDS card No. 84-1286 (anatase TiO2) and 87-0920 (rutile TiO2) [42, 43]. The characteristic peaks were analyzed for all TiO2 samples. Calculated degrees of crystallinity and crystal sizes as well as the type of the formed phases of each prepared sample are summarized in table 1.
Table 1: Crystal characterization of TiO2 samples estimated from the XRD analyses
| Temperature | Acidic (Ac) pH2 | Neutral (Nu) pH7 | Alkaline (Ak) pH9 | |||||||
| Ac1 | Ac2 | Ac3 | Nu1 | Nu2 | Nu3 | Ak1 | Ak2 | Ak3 | ||
| 450°C | Degree of crystallinity % | 50 | 50 | 50 | 50 | 50 | 51.8 | 50 | 50 | 50 |
| Anatase, % | 100 | 100 | 100 | 100 | 100 | 100 | 100 | 100 | 100 | |
| Rutile, % | — | — | — | — | — | — | — | — | — | |
| Anatase crystal size,nm | 18.25 | 15.40 | 15.60 | 13.00 | 13.50 | 14.8 | 57.56 | 29.48 | 18.08 | |
| 550°C | Degree of crystallinity % | 50 | 50 | 100 | 100 | 100 | 100 | 50 | 50 | 50 |
| Anatase, % | 100 | 100 | 91.8 | 66.8 | 91.9 | 94.5 | 100 | 100 | 100 | |
| Rutile, % | — | — | 8.2 | 33.2 | 8.1 | 5.5 | — | — | — | |
| Anatasecrystal size,nm | 33.18 | 37.02 | 41.7 | 58.53 | 44.00 | 40.74 | 47.60 | 44.00 | 26.80 | |
| Rutile crystal size,nm | — | — | 42.16 | 78.9 | 74.32 | 66.40 | — | — | — | |
| 650°C | Degree of crystallinity % | 100 | 100 | 100 | 100 | 100 | 100 | 100 | 100 | 100 |
| Anatase, % | 100 | 68 | 37 | — | 26.9 | 49.00 | 61.9 | 48.8 | 15 | |
| Rutile, % | — | 32 | 63 | 100 | 73.1 | 51.00 | 38.1 | 51.2 | 85 | |
| Anatase crystal size,nm | 68.35 | 87.4 | 89.6 | — | 63.48 | 71.87 | 65.9 | 70.52 | 80.53 | |
| Rutile crystal size,nm | — | 114.2 | 98.8 | 90.97 | 71.88 | 67.75 | 134.46 | 115.28 | 108.14 | |
Dried at: 1=70°C; 2=90°C; 3=110°C;
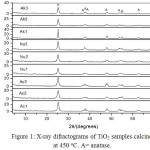 |
Figure 1: X-ray difractograms of TiO2 samples calcined at 450°C. A= anatase. |
Fig 1 illustrates the XRD diffractograms of the prepared TiO2 samples calcined at 450°C. As indicated in table 1 and fig 1, only anatase phases were obtained at all of the given experimental conditions. At this low calcination temperature, the formation of anatase as a kinetically stable phase is expected rather than rutile phase [44]. The calculated percentages of degrees of crystallinity were low and having the same values (= 50%), see table 1. No significant variations were observed in the calculated crystal sizes in both acidic and neutral media at drying temperatures from 70 to 110°C. However, slight increase in the crystal sizes was obtained in the alkaline media which is more significant at lower drying temperatures. This is probably due to the presence of the large amount of hydroxyl ions. The high concentrations of the hydroxyl ions result in rapid precipitation of the hydrolyzed titania species leading to their agglomeration. At high drying temperature, crystallization was probably initiated forming agglomerates consisting of several crystals upon drying. Contrary, samples dried at low temperature remained amorphous agglomerates. These amorphous agglomerates tend to form relatively large single crystals upon the calcination at 45°C [45].
Generally, the formation mechanism of TiO2 from titanium alkoxides involves two main steps. The first step is the hydrolysis of the 4-coordinated [Ti(OR)4] in water. In this step, titanium ion accepts oxygen lone pairs through the vacant d-orbitals yielding [Ti(H2O)6]4+ and consequently increases its coordination. The formed hydrolyzed species then undergo partial deprotonations and for simplicity is written as (TiO62-) octahedra. The second step is condensation. In this step, both anatase and rutile grow from TiO62- octahedra. Rutile consists of linear chains, formed by sharing two opposite edges of adjacent TiO6 octahedra, which are linked to other chains through shared corners. Anatase shares two sets of two adjacent edges to form zigzag chains linked to one another [34]. Therefore, the experimental conditions at which the arrangements of TiO6 octahedra occur should be precisely controlled so the desired TiO2 phase(s) could be obtained.
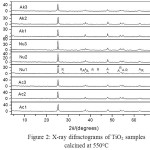 |
Figure 2: X-ray difractograms of TiO2 samples calcined at 550°C |
As shown in table 1, growth in the crystallite sizes was observed for TiO2 calcined at 550°C. The calculated percentages of degrees of crystallinity remain low in basic and also in acidic medium at low drying temperatures. However, they increased to 100% for all TiO2 samples prepared at neutral and also for samples prepared in acidic medium at high drying temperature; 110°C. Characteristic peaks of rutile phase began to appear in some samples (see fig 2 and table 1). Only anatase phases were obtained for those samples prepared at low degrees of crystallinity (i.e. Ac1, Ac2, Ak1, Ak2 and Ak3). Meanwhile, rutile phases appear in the samples with 100% degrees of crystallinity (i.e. Ac3, Nu1, Nu2 and Nu3). The percentage of rutile is 8.2 in sample prepared in acidic medium at high drying temperature (Ac3). The percentages of rutile are 33.2, 8 and 5.5 in samples prepared in neutral media dried at 70, 90 and 110°C, respectively. The existence of anions in the reaction media plays an important role in the mobility and rearrangement of TiO6 species [44,46]. The hydroxyl and acetate anions in the basic and acidic solutions, respectively, have strong affinities toward titanium. The adsorption of these anions decreases the mobility of titanium oxyhydroxide moieties and also retards their arrangement into the rutile shape. These consequently result in low crystallinity of the prepared samples and hinder the formation of the thermodynamically stable rutile phase. These were obviously noticed in sampled prepared in basic and also in acidic medium at low drying temperatures. Contrary, the high drying temperature at pH 2, results in vaporization of acetic acid. This in turn facilitates the mobility and arrangement of TiO6 moieties and consequently enhances both crystallinity and rutile formation. On the other hand, at pH 7, the absence of anions results in facile arrangement of TiO6 moieties to form the rutile shape. The water to titanium oxyhydroxide ratios also play a significant role in the shape samples prepared in neutral media. As water ratios decrease upon raising the drying temperatures, the mobility of titanium oxyhydroxide precursors decreases. The low mobility results in low interaction between the reaction precursors and consequently results in the formation of TiO2 with low rutile ratios. Here again at high drying temperatures, crystallization was assumed to be initiated forming several crystals upon drying causing the overall decrease in the crystal sizes.
Further increase in the crystallite sizes was observed in samples calcined at 650°C. The degrees of crystallinity of the prepared samples also increased to 100%. Rutile phase appeared in most samples. Pure rutile phase was obtained at low drying temperature in neutral medium. However the rutile ratios decrease upon increasing the drying temperatures. The absence of anions and the water to titanium oxyhydroxide ratios significantly affect the rutile ratios as discussed above. However, the rutile ratios increase upon increasing the drying temperatures on both acidic and basic media. This is due to the vaporization of undesired anions as mentioned before. Contrary to that obtained at calcination temperatures, 450 and 550°C, the crystal sizes of anatase phases increase upon increasing the drying temperatures. The small anatase crystals formed at high drying temperatures collapsed upon calcination at 650°C forming TiO2 crystals with larger dimensions. Findings are different with respect to the crystal sizes of rutile phases. The crystal sizes decrease upon increasing the drying temperatures. We suppose that the small crystals initiated at high drying temperatures undergo rearrangements to form rutile phase rather than growing into larger crystals.
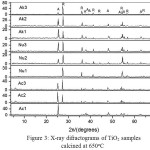 |
Figure 3: X-ray difractograms of TiO2 samples calcined at 650°C |
Transmission electron Microscopy (TEM) analyses
The morphology and the particle size distribution of prepared titanium dioxide samples were characterized by TEM, Fig. 4. TEM measurements of all of the prepared samples were carried out (not all are given). Overall, the measured TEM micrographs are in accordance with data obtained from the XRD analyses. TEM images represent different shapes, sizes and crystallinities of the prepared TiO2 samples according to their experimental conditions. Four of TEM images have been selected and shown in Fig. 4. The four images represent anatase, rutile and mixed phases of TiO2 with different particle sizes. The anatase face appeared in its characteristic (001) cube face. The rutile shape appeared in its characteristic (011) hexagonal face [47]. For example, fig 4a represents the TEM image of Nu1 prepared at 450°C. In Fig. 4a, anatase phase appears with particle sizes ranging from 5 to 25 nm. As shown in Fig 4a, the anatase particles are dispersed over amorphous matrix. This amorphous matrix may be the unreacted titanium butoxide or amorphous titanium oxyhydroxide species, etc. These findings are in consistent with the XRD data of Nu1 where the detected phase was anatase of 50% degree of crystallinity. Fig 4b represents the TEM image of Nu3 prepared at 550°C. In Fig 4b, well organized shapes of TiO2 mixed phases appear with the predominance of the anatase phase (cube shapes). The measured particle sizes obtained from TEM are ranging from 35 to 60 nm for anatase and from 55 to 70 nm for rutile. XRD data previously revealed that Nu3 prepared at 550°C consists of anatase and rutile mixture of percentages 94.5 and 5.5 %, respectively. Fig 4c represents the TEM image of Ac2 at 650°C. TEM indicates that in Ac2 is a mixture of rutile and anatase phases. The particle sizes are ranging from 45 to 80 nm for anatase and from 40 to 120 nm for rutile. This is also in accordance with data obtained from XRD. XRD indicated the existence of anatase and rutile phases with percentages 68 and 32 %, respectively. Finally, TEM analyses also confirmed the XRD Nu1 prepared at 650°C (fig. 4d). Only pure well-crystalline rutile phase appears in Nu1 (i.e. hexagonal shape). The measured particle sizes derived from TEM measurements ranges from 45 to 85 nm.
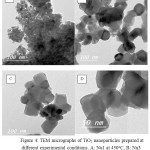 |
Figure 4: TEM micrographs of TiO2 nanoparticles prepared at different experimental conditions. A: Nu1 at 450°C, B: Nu3 at 550°C, C: Ac2 at 650°C, and D: Nu1 at 650°C. Click here to View Figure |
Photocatalytic Activity Evaluation of Tio2 Samples
Fluorescent probe method has been used for initial evaluation of the photocatalytic activity of the TiO2 samples calcined at 550°C. TiO2 samples calcined at 550°C have been selected as they show different shapes and crystallinities. The (•OH) produced at TiO2 surfaces upon UV light irradiation results in the conversion of non-fluorescent coumarin to 7-hydroxycoumarin fluorescent species [41,48,49]. The rates by which the coumarin molecules are converted to hydroxycoumarin (kf) measure the photocatalytic activities of TiO2 samples. The high rates of hydroxycoumarin formation indicate the high abilities of TiO2 to produce surface hydroxyl radicals and consequently refer to their high photocatalytic performances.
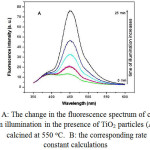 |
Figure 5: (A) The change in the fluorescence spectrum of coumarin upon illumination in the presence of TiO2 particles (Ak3) calcined at 550°C. B: the corresponding rate constant calculations
|
Figure 5a shows the change in the fluorescence spectrum of coumarin by UV light at different illumination time intervals. As shown in Fig 5a, peaks with maximum fluorescence intensities at 452 nm appeared upon UV light illumination. These new peaks refer to the formation of 7-hydroxycoumarin fluorescent species. The fluorescence intensities at 452 nm were plotted against the time of illumination for the different TiO2 samples (e.g. see fig 5b). The fluorescent intensities linearly increase with time indicating the existence of pseudo first order kinetic reaction. The rate constants of the hydroxylation reactions were estimated from the line’s slope of fluorescence intensities against time plots. The calculated rate constant values are illustrated in Fig 6.
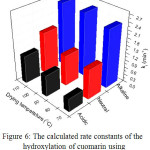 |
Figure 6: The calculated rate constants of the hydroxylation of cuomarin using different TiO2 samples. Click here to View Figure |
As shown in Fig 6, hydroxylation of coumarin significantly depends on the preparation experimental conditions of TiO2 samples. Overall, the rate of 7-hydroxycoumarin formation apparently increases as the pH of the preparation media increases. As shown in fig. 6, samples prepared in basic media show comparable rates of formation. The rates of hydroxycoumarin formation; kf are 2.35, 2.57 and 2.58 min-1 for Ak1, Ak2 and Ak3, respectively. This is due to the existence high amount of hydroxyl groups attached to TiO2 surfaces. The high density of surface hydroxyl groups effectively enhances the hydroxylation reaction regardless of the phase or crystallinities of TiO2 samples. In addition, the hydroxylation reaction rates slightly increase as the drying temperatures increase. As given in table 1, the increase in the drying temperatures in basic media results in the formation of smaller crystal sizes of TiO2. The exposed surfaces of small TiO2 crystals are higher and consequently the reaction rates increase. On the other side, findings were different for samples prepared in both neutral and acidic media. In both neutral and acidic media, the hydroxyl radicals’ formation is significantly influenced by the drying temperatures. At pH 2, the rates of hydroxycoumarin formation are 0.52, 0.86 and 1.12 min-1 for Ac1, Ac2 and Ac3, respectively. At pH 2, only anatase phase with 50% degrees of crystallinity was obtained for Ac1 and Ac2 (i. e. samples dried at 70 and 90°C). Samples prepared at these low drying temperatures showed low rates of hydroxylation probably due to their low crystallinities. Meanwhile, the rate of hydroxylation using sample dried at 110°C (Ac3) is the highest compared to those samples prepared at lower drying temperatures. TiO2 sample dried at 110°C shows high degree of crystallinity (100%). This consequently results in a relatively high efficiency of hydroxyl radicals’ formation. Finally, at pH 7, the order of the rates of hydroxylation were 110°C > 90°C > 70°C. The rates of hydroxycoumarin formation are 1.20, 1.23 and 1.70 min-1 for Nu1, Nu2 and Nu3, respectively. This finding could be interpreted in terms of the crystal sizes and ratios of rutile to anatase. It has been reported previously that rutile is less photoactive phase than anatase [50]. The prepared TiO2 samples have the same high degrees of crystallinity (100%) with different sizes and ratios of rutile to anatase phases. Both crystal sizes and rutile phase ratios decrease by increasing the drying temperature. This consequently results in reducing the efficiency of hydroxyl radicals’ generation.
Conclusion
In this study, preparation of different structures of TiO2 nanoparticles over narrow ranges of varying parameters was achieved. Titanium-n-butoxide was used to prepare TiO2 nanoparticles via sol gel method. The influence of the experimental preparation conditions: pH, drying and calcination temperatures were studied at ranges 5-9, 70-110°C, and 450-650°C, respectively. XRD and TEM measurement of the prepared TiO2 indicated the formation of pure anatase, rutile and mixed phases with different ratios. Calcination of samples at 450°C results in the formation of only anatase phase with low crystallinity. However, upon calcination at 550°C, mixed anatase and rutile phases were observed in some samples. Degrees of crystallinity, crystal sizes and phase ratios were significantly influenced by the titanium oxyhydroxid species to water ratios and anions in the reaction media. In addition, increase in the crystallite sizes was observed in samples calcined at 650°C. The degrees of crystallinity of the prepared samples also increased to 100%. Rutile phase appeared in most samples. Pure rutile phase was obtained at low drying temperature in neutral medium. Finally, fluorescent probe method has been used for initial assessment of the photocatalytic activities of the prepared TiO2 samples. The rate of the hydroxyl radicals’ formation on TiO2 surfaces apparently increases as the pH of the preparation media increases. The hydroxyl radicals’ formation is also significantly influenced by the drying temperatures.
Conflict of Interest
Authors declare no conflict of interest.
Acknowledgements
The science and technology fund (STDF), Egypt, Grant number 4746 supports this work financially.
References
- Macedo, E. R.; Oliveira, P. S.; de Oliveira, H. P. J. Photochem. Photobiol. A Chem. 2015, 307–308, 108-114.
CrossRef - Hazarika, D.; Karak, N.; Appl. Surf. Sci. 2016, 376, 276-285.
CrossRef - Wang, W.-Y.; Irawan, A.; Ku, Y. Water Res. 2008, 42, 4725-4732.
CrossRef - Mardare, D.; Cornei, N.; Mita, C.; Florea, D.; Stancu, A.; Tiron, V.; Manole, A.; Adomnitei C. Ceram. Int. 2016, 42, 7353-7359.
CrossRef - Blank, T.A.; Eksperiandova, L.P.; Belikov K.N. Sens Actuators B Chem. 2016, 228, 416-442.
CrossRef - Yahui, L.; Fancheng, M.; Fuqiang, F.; Weijing, W.; Jinglong, C.; Tao, Q. Dyes Pigm. 2016, 125, 384-391.
CrossRef - Jarosz, M.; Pawlik, A.; Szuwarzyński, M.; Jaskuła, M.; Sulka, G. D. Colloids Surf. B. 2016, 143, 447-454.
CrossRef - Szymańska, R.; Kołodziej, K.; Ślesak, I.; Zimak-Piekarczyk, P.; Orzechowska, A.; Gabruk, M.; Żądło, A.; Habina, I.; Knap, W.; Burda, K.; Kruk, J. Environmental Pollution. 2016, 213, 957-965.
CrossRef - Wang, Y.; Han, W.; Zhao, B.; Chen, L.; Teng, F.; Li, X.; Gao, C.; Zhou, J.; Xie, E. Sol. Energ. Mat. Sol. Cells. 2015, 140, 376-381.
CrossRef - Zeynalov, E. B.; Allen, N. S.; Calvet, N. L.; Stratton, J. Dyes Pigm. 2007, 75, 315-327.
CrossRef - Nejad, S. M.; Takahashi, H.; Hosseini, H.; Watanabe, A.; Endo, H.; Narihira, K.; Kikuta, T.; Tachibana, K. Ultrason. Sonochem. 2016, 32, 95-101.
CrossRef - Kumar, R.; Kushwaha, A. S.; Srivastava, S. K. Optik. 2015, 126, 1324-1330.
CrossRef - Pinjari, D.V.; Prasad, K.; Gogate, P. R.; Mhaske, S. T.; Pandit, A. B. Ultrason. Sonochem. 2015, 23, 185-191.
CrossRef - Kumar, A.; Mondal, S.; Girish Kumar, S.; Rao, K. S. R. K. Mater. Sci. Semicond. Process. 2015, 40, 77-83.
CrossRef - Kumar, N.; Hazarika, S. N.; Limbu, S.; Boruah, R.; Deb, P.; Namsa, N. D.; Das, S. K. Micropor. Mesopor. Mat. 2015, 213, 181-187.
CrossRef - Na, S. H.; Shon, H. K.; Kim, J. B.; Park, H. J.; Cho, D. L.; El Saliby, I.; Kim, J.-H. J. Ind. Eng. Chem. 2010, 16, 96-100.
CrossRef - Valencia, S.; Vargas, X.; Rios, L.; Restrepo, G.; Marín, J. M. J. Photochem. Photobiol. A Chem. 2013, 251, 175-181.
CrossRef - Zangeneh, H.; Zinatizadeh, A. A. L.; Habibi, M.; Akia, M.; Hasnain Isa, M. J. Ind. Eng. Chem.2015, 26, 1-36.
CrossRef - Hachisu, T.; Shi, K.; Yokoshima, T.; Sugiyama, A.; Kuroiwa, S.; Osaka, T.; Nakajima, N.; Yoshino, M. Electrochem commun. 2016, 65, 5-8.
CrossRef - Du, X.; Wang, X.; You, S.; Wang, Q.; Gong, X. J. Environ. Sci. 2015, 36, 84-92.
CrossRef - Dejene, F. B.; Onani, M. O.; Tarus, P. K. Physica B: Condensed Matter. 2016, 480, 213-218.
CrossRef - Karaman, M.; Sarıipek, F.; Köysüren, Ö.; Yıldız, H. B. Appl. Surf. Sci. 2013, 283, 993-998.
CrossRef - Keswani, R. K.; Ghodke, H.; Sarkar, D.; Khilar, K. C.; Srinivasa, R. S. Colloids Surf. A Physicochem. Eng. Asp. 2010, 69, 75-81.
CrossRef - Liu, Z.; Xu, X.; Fang, J.; Zhu, X.; Chu, J.; Li, B. Appl. Surf. Sci. 2012, 258, 3771-3778.
CrossRef - Shen, P.-S.; Tseng, C.-M.; Kuo, T.-C.; Shih, C.-K.; Li, M.-H.; Chen, P. Solar Energy. 2015, 120, 345-356.
CrossRef - Wang, J.; Pan, Z.; Zhang, Z.; Zhang, X.; Wen, F.; Ma, T.; Jiang, Y.; Wang, L.; Xu, L.; Kang P. Ultrason. Sonochem. 2006, 13, 493-500.
CrossRef - Venkatachalam, N.; Palanichamy, M.; Murugesan V. Mater. Chem. Phys. 2007, 104, 454–459.
CrossRef - EL-Mekkawi, D. M.; Galal, H.R.; Abd EL Wahab, R. M.; W. A. A. Mohamed, Int. J. Environ. Sci. Te. 2016, 13, 1077-1088.
CrossRef - Hanna, A. A.; Mohamed, W. A. A.; Ibrahim, I. A. Egypt J. Chem. 2014, 57, 315-326.
- Wang, F.; Feng, L.; Zhang, D.; Tang, Q.; Feng D. J. Alloys Compd. 2014, 611, 125-129.
CrossRef - Li, W.; Du, D.; Yan, T.; Kong, D.; You, J.; Li, D.; J. Colloid Interface Sci. 2015, 444, 42-48.
CrossRef - Du, J.; Wu, Q.; Zhong, S.; Gu, X.; Liu, J.; Guo, H.; Zhang, W.; Peng, H.; Zou, J. J.Rare Earth. 2015, 33, 148-153.
CrossRef - Wang, X.; Sø, L.; Su, R.; Wendt, S.; Hald, P.; Mamakhel, A.; Yang, C.; Huang, Y.; Iversen, B. B.; Besenbacher F. J. Catal. 2014, 310, 100-108.
CrossRef - Kanna, M.; Wongnawa, S. Mater. Chem. Phys.2008, 110, 166–175.
CrossRef - Prasad, K.; Pinjari, D.V.; Pandit, A.B.; Mhaske, S.T. Ultrason. Sonochem. 2010, 17, 409–415.
CrossRef - Gandhi, V.G.; Mishra, M.K.; Rao, M.S.; Kumar, A.; Joshi, P.A.; Shah, D.O. J. Ind. Eng. Chem.2011, 17, 331–339.
CrossRef - Behnajady, M. A.; Eskandarloo, H.; Modirshahla, N.; Shokri, M. Photochem. Photobiol. 2011, 87, 1002–1008.
CrossRef - Karami, A. J. Iran. Chem. Soc. 2010, 7, S154-S160.
CrossRef - Rajabzadeh, G.; Salehi, S.; Jalalian, A. Synth. React. Inorg. Met.-Org. Chem. 2010, 40, 922–929.
- Patterson, A. L. Phys. Rev. 1939, 56, 978-979.
CrossRef - Saif, M.; El-Molla S. A., Aboul-Fotouh, S.M.K.; Hafez, H.; Ibrahim, M.M.; Abdel-Mottaleb, M.S.A, Ismail, L.F.M. Spectrochim. Acta. Mol. Biomol. 2013, 112, 46–51.
CrossRef - Burdett, J.K.; Hughbanks, T.; Miller, G.J.; Richardson, J.W.; Smith, J.V. J. Am. Chem. Soc. 1987, 109, 3639 – 3646.
CrossRef - Grey, I. E.; Li, C.; MacRae, C. M.; Bursill, L. A. J. solid. State. Chem. 1996, 127, 240-247.
CrossRef - Reddy, M. A.; Kishore, M. S.; Pralong, V.; Caignaert, V.; Varadaraju, U.V.; Raveau, B. Electrochem. Commun.2006, 8, 1299–1303.
CrossRef - Hart, J. N.; Bourgeois, L.; Cervini, R.; Cheng, Yi-B. .; Simon, G. P.; Spiccia, L. J. Sol-Gel Sci. Technol.2007, 42, 107–117.
CrossRef - Wu, M.; Lin, G.; Chen, D.; Wang, G.; He, D.; Feng, S.; Xu, R. Chem. Mater. 2002, 14, 1974-1980.
CrossRef - Ohno, T.; Sarukawa K.; Matsumura, M. New J. Chem. 2002, 26, 1167–1170
CrossRef - Ishibashi, K.; Fujishima. A.; Watanabe, T.; Hashimoto, K. Electrochem. Commun. 2000, 2, 207–210
CrossRef - Xiang, Q.; Yu, J.; Wong, P.K. J. Colloid. Interface. Sci. 2011, 357, 163–167.
CrossRef - Torimoto, T.; Nakamura, N.; Ikeda, S.; Ohtani, B. Phys. Chem. Chem. Phys. 2002, 4, 5910–5914.
CrossRef


![]()


