Predicting ESR Peaks in the 4d and 5d Transition Metal Ion Complexes by NMR, ESR and NQR Parameters: A DFT Study
M.L. Sehgal1, Amit Aggarwal2, K.N. Kaul3 and Md. Irshad Ahmad4
1Department of Chemistry, D.A.V. College, Jalandhar-144008, India.
2Department of Natural Sciences, LaGuardia Community College of The City University of the New York, 31-10 Thomson Avenue, Long island City, 11101, New York, USA.
3Department of Chemistry,D .A.V. University,Jalandhar-144012, India.
4Department of Biochemistry, Faculty of Life Sciences, Aligarh Muslim University, Aligarh, 202002, Uttar Pradesh, India.
Corresponding Author E-mail: irshadahmad.bio@gmail.com
DOI : http://dx.doi.org/10.13005/ojc/330103
Article Received on :
Article Accepted on :
Article Published : 08 Feb 2017
Computational chemistry was used to predict the number of ESR peaks in the 2nd and 3rd transition metal ion complexes by applying DFT implemented in ADF 2012.01.Only a limited experimental ESR research had been carried out in this field because high values of spin orbit coupling constants of these metal ions which provide an important energy transfer mechanism would adversely affect the values of ESR and NMR parameters (especially Aten) of their complexes. Therefore, theoretical predictions were useful. ESR (Aten) and NQR (NQCC,η) parameters of transition metal ions and the coordinating atoms of ligands were obtained from the ESR/EPR program while their shielding constants (σ) and chemical shifts (δ) were obtained from the NMR/EPR program after optimization of the complexes. Ligands whose coordinating atoms (CA) possessed the same values of the five parameters (Aten, NQCC, δ,η, σ) were expected to be spatially equivalent and would undergo the same hyperfine interaction with the central metal ion. 34 complexes of 10 metal ions consisting of five congeners: Zr (III), Hf (III); Nb (IV) ,Ta(IV) ; Tc (II), Re (II); Ru (III) ,Os(III) ;Rh (IV), Ir (IV) were selected to predict the number of ESR peaks.
KEYWORDS:Chemical Shift; Total NMR Shielding Tensor; Nuclear Quadrupole Coupling Constant; Effective Spin Hamiltonian, Asymmetric Coefficient
Download this article as:| Copy the following to cite this article: Sehgal M. L, Aggarwal A, Kaul K. N, Ahmad M. I. Predicting ESR Peaks in the 4d and 5d Transition Metal Ion Complexes by NMR, ESR and NQR Parameters: A DFT Study . Orient J Chem 2017;33(1). |
| Copy the following to cite this URL: Sehgal M.L, Aggarwal A, Kaul K.N, Ahmad M. I. Predicting ESR Peaks in the 4d and 5d Transition Metal Ion Complexes by NMR, ESR and NQR Parameters: A DFT Study. Orient J Chem 2017;33(1). Available from: http://www.orientjchem.org/?p=29890 |
Introduction
Only a limited research work had been done in the experimental determination of number of ESR peaks in complexes of 4d and 5d metal ions [1-5] like Zr (III) [6-8],Hf (III) [7-9]; Nb (IV) [10-12], Ta (IV) [9]; Tc (II) [9, 13, 14], Re (II) [15-17]; Ru (III) [18–24],Os (III) [18-20,24]; Rh (IV) [25-27 ],Ir (IV) [26,27]which formed five congeners of 2nd and 3rd transition series.
As DFT had, hardly, been applied to determine number of ESR peaks in these metal ion complexes, we tried DFT implemented in ADF 2010.01 to 34 complexes such as [ZrX6]3-(X= F, Cl , Br), [HfX6]3- (X=F, Cl, Br), [Hf (NH3)6]3+, [NbX6]2- (X=F, Cl, I, NCS ), [Nb (NH3)6]4+, [TaX6]2-(X=Cl, Br), [TcBr6]4-, [Tc (NH3)6]2+, [ReX6]4-(X=Cl, Br), [Re(NH3)6]2+,[RuX6]3-(X=F, Cl , Br), [OsX6]3- (X=F, Cl ,Br), [Os (NH3)6]3+, [RhX6]2- (X=F, Cl, Br), [Rh (NH3)6]4+, [IrX6]2- (X=F, Cl ,Br), [Ir (NH3)6]4+ belonging to 10 metal ions of the 2nd and 3rd transition series. All these six coordinate complexes containing either weak halo or comparatively stronger (ammine and thiocyanato -N) ligands belonged to five congeners of the 2nd and 3rd transition series. They, invariably, possessed one unpaired electron because their large Crystal Field Stabilization Energies (CFSE) would cause pairing of electrons even with the week ligands.
Need of the Study
There were two main reasons which tempted us to take up the present study:
Only a limited research work had been done in the experimental determination of number of ESR peaks in 4d and 5d metal ion complexes because their authentic 10 Dq values were difficult to determine experimentally due to their high values of spin orbit coupling constants (λM n+ ) which, in turn, would adversely affect ESR parameters (especially Aten).
ESR transitions energies falling in microwave region, generally, needed cryogenic conditions which were difficult to obtain and cumbersome to maintain.
Methodology
ADF (Amsterdam Density Functional) software was installed on Windows XP platform as “ADF jobs”. A new directory was created using “File menu” of ADF jobs. After optimization of the complexes, different commands were filled into the software to obtain ESR, NQR [28-30] and NMR[31-33] parameters which were discussed in detail in our previous publications[28-33].
With to the specific set of commands, the ADF software would give one ESR {Hyperfine Coupling Constants (Aten)}, two NQR {Nuclear Quadrupole Coupling Constant (NQCC), Asymmetric Coefficient (η)} [28-30] and two NMR parameters {Shielding Constant (σ) , Chemical Shift(δ) }[31-33].These five parameters (Aten, NQCC,η, σ, δ) together were, then, used to predict the number of ESR peaks in the 2nd and 3rd transition series metal ion complexes.
Results
Results for 34 complexes of 10 metal ions were tabulated in Tables: 1-2.
Table: 1 contained values of IM, IC A, g M and g CA as well as μM and μCA (in terms of bn to βn) and ratios of μM and μCA to predict the possibility of hyperfine interaction between metal ions and ligands.
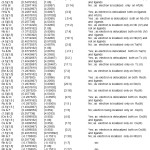 |
Table: 1. Prediction of Hyperfine Interaction between Metals and Ligands Click here to View table |
Table: 2 contained Aten, σ, δ values of metal ions and Aten, NQCC,η, σ, δ and CA of ligands, number of spatially different ligands along with the theoretically predicted number of ESR peaks in these complexes.
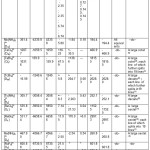 |
Table: 2. Prediction of Number of ESR peaks in Complexes Click here to View table |
Discussion
It was taken up under the following headings
Basis for prediction of number of ESR peaks
Five parameters (Aten, NQCC,η, σ, δ ) of metal ions and coordinating atoms (CA) of ligands were obtained from the software by giving it certain commands. A metal ion possessed only one value of each one of these 5 parameters while the values of the parameters might differ in case of the coordinating atoms (CA) of ligands. When, the ligands possessed the same or nearly the same values of these 5 parameters, itindicated that all the ligands were spatially equivalent. The relative magnitudes of the values of the parameters of metal ion and CA would also be taken into account while predicting ESR peaks of the complexes.
Relation to Calculate of nuclear magnetic moment ((mM) in terms of bn:
After knowing the values of nuclear spin quantum numbers and g factors of metals (IM, g M) and of coordinating atoms (CA) of ligands (ICA , g CA) from the literature, we could calculate nuclear magnetic moments of both the metal (μM) and coordinating atoms (μCA) of ligands in terms of βn by the following relation:
μM=g M [IM (IM+1)] 1/2
and (a)
μCA =g CA [ICA (ICA+1)] 1/2
Knowing whether hyperfine interaction was possible or not:
From [μM/μCA] ratio called μn ratio, we could draw the following conclusions
A comparable μn ratio for isotopes with I >0 having appreciable % natural abundance would mean that the unpaired electron was delocalized both on the metal and the ligands. So the hyperfine interaction between the metal ion and the ligands was most probable.
The peaks would arise both from the ligands and the metal ion
Very small or very large ratios implied that μn of ligands and metal differ largely. In such a case, no hyperfine interaction between the metal and the ligands was possible. Electron would remain localized on the metal irrespective of the values of I and the % abundance.
The peaks would arise only from the metal ion
Analogous to an electronic spin: μe=ge [s (s+1)] 1/2
Predicting the number of ESR peaks
Assuming IM andICA the nuclear spinsof themetal and [CA] respectively:
Number of ESR peaks given by a metal ion was
2IM +1 (b)
Number of ESR peaks arising from ligands was predicted from their spatial
arrangement as follows:
When all the n ligands were spatially equivalent, then each ESR line of metal ion would be split up into the lines:
(2 n ICA+1) (c)
If n1 ligands were spatially of one type; n2 are of the other type and so on, then the total number of lines into which one line of the metal ion would be split:
(2 n1 ICA+1)(2n2 ICA+1)(2 n3 ICA+1) (d)
If all the ligands were nonequivalent, one line of metal ion would split into:
(2 ICA+1)n (e)
If metal ion possessed higher Aten than the coordination atoms (CA) of ligands, we should first calculate number of lines obtained from metal ion. Each line of the metal ion might ,further, split into more number of lines depending upon whether the ligands could undergo hyperfine with the metal ion or not. Conversely, if the coordinating atoms of ligands had higher Aten values, then first calculate number of lines from ligands. Each line of ligands should, then, split by metal ion if the hyperfine interaction was possible.
There might occur overlapping of ESR lines from different factors. So experimentally observed number of lines might be less than the theoretically predicted lines. Also, when the predicted number of lines was large and Aten value/s of species undergoing hyperfine interaction was/were very small, the lines would merge to give a continuum.
The ESR peaks of the following 34 complexes were theoretically predicted.
The metal wise discussion was subdivided into ten headings (5.2-5.11).
Prediction of number of ESR peaks in Zr (III) Complexes
ESR spectra of [ZrX6]3- (X=F, Cl, Br) were discussed in two parts
[ZrX6]3- (X=F, Br)
They showed the following features
The six F or Br possessed same values of A ten, NQCC, η, σ, δ respectively so that all the ligands were spatially equivalent.
Aten value of Zr (III) was more than F but lesser than Br.
With small μn ratios, the unpaired electron was localized only on Zr(III).
Their ESR spectra gave only a large sextet (b) from Z r (III) [2*5/2+1].
[ZrCl6]3-
It showed the following features
As the six Cl had the same Aten, NQCC,η, σ, δ values respectively, they should be spatially equivalent.
Unpaired electron was delocalized both on Zr (III) and Cl as their μn ratio was comparable [3]. Aten value of Zr (III)was more than those of the six Cl.
Its ESR spectrum would give a large sextet (b) from Zr (III) [2*5/2+1] with each line further splitting into19 lines(c) by the hyperfine interaction of Zr (III)and six equivalents Cl [2*6*3/2+1].
Prediction of number of ESR peaks in Hf (III) Complexes
Complexes like [HfX6]3- (X=F, Cl, Br) and [Hf (NH3)6]3+ were studied as follows:
[HfX6] 3- (X=F, Br)
They showed the following common features:
The six F or Br were spatially equivalent as they showed the same Aten, NQCC, η, σ, δ values respectively.
As their μn ratios were small, the unpaired electron would remain localized only on Hf (III) with no hyperfine interaction.
Aten value of Hf (III)was more than those of the F and the Br.
Their ESR spectra should give only an octet (b) from Hf (III) [2*7/2+1].
[HfCl6]3- and [Hf (NH3)6]3+
Both showed the following features
The six Cl or NH3 ligands were spatially equivalent with same Aten, NQCC, η, σ, δ values respectively.
Unpaired electron was delocalized both on Hf (III)and Cl or NH3 as their μn ratios were comparable.
Aten of Hf (III) was more than Cl or N of NH3.
Their spectra showed a large octet(b) from Hf (III) [2*7/2+1] with each line further splitting into 19 (c) or13 lines(c) by the hyperfine interaction of Hf (III) and the six equivalents Cl [ 2*6*3/2+1] or six N of six NH3 ligands [2*6*1+1] respectively.
Prediction of number of ESR peaks in Nb (IV) Complexes
The study included 5 complexes such as: [NbX6]2- (X=F, Cl, I, N CS) and [Nb (NH3)6]4+. Their ESR discussion was divided into four parts:
[NbF6]2-
It showed the following features:
With the same Aten, NQCC,η, σ, δ values respectively,all the ligands were equivalent.
With comparable μn ratio, the unpaired electron was delocalized both on Nb (IV)and the F.
Aten of Nb (IV) was more than those of the F ligands.
Its spectrum gave a large decane (b) from Nb (IV) [2*9/2+1]with each line splitting into a smaller septet(c) by the hyperfine interaction of Nb (IV) and the six F [2*6*1/2+1].
[NbCl6]2- and [Nb (NH3)6]4+
Both showed the following features:
Six Cl or NH3 had same values of Aten, NQCC, η, σ, δ respectively. So, all the ligands were spatially equivalent respectively.
Unpaired electron was localized on Nb (IV) but not on ligands.
A ten value of Nb (IV) was more than those of Cl or NH3.
ESR spectra would give only a large decane (b) from Nb (IV) [2*9/2+1] with no hyperfine interaction between Nb (IV) and Cl or NH3 as their μn ratios were large.
[Nb I6]2-
It showed the following features:
There were three sets of Aten, NQCC,η, σ, δ values respectively for the iodo ligands; each set having two values. So there were three types of stereo chemically different ligands respectively.
Unpaired electron was delocalized both on Nb (IV) and ligands as μn ratio of Nb and I was comparable respectively.
Aten value of Nb (IV) was more than those of the iodo ligands respectively.
Its spectrum showed a large decane (b) from Nb (IV) [2*9/2+1] with each line splitting into 1331 lines [2*2*5/2+1]3 from hyperfine interaction between Nb (IV) and the six iodo ligands. In fact, its ESR spectrum would exhibit a continuum.
[Nb (NCS) 6]2-
It showed thefollowing features
There were three sets of Aten, NQCC,η, σ, δ values respectively for the isothiocyanato ligands; each set having two values. So there were three types of stereo chemically different ligands.
Unpaired electron was localized on Nb (IV) as μn ratio of Nb and N of NCS1-was small.
Aten value of Nb (IV) was more than N of ligands.
Its spectrum should give only a large decane (b) from Nb (IV) [2*9/2+1] with no
hyperfine interaction between Nb (IV) and the six isothiocyanato ligands.
Prediction of number of ESR peaks in Ta (IV) Complexes
Two complexes such as [Ta X6]2- (X= Cl, Br) were studied
[Ta Cl6]2-
It showed the following features
Six chloro ligands were equivalent as they possessed the same Aten, NQCC, σ, δ values respectively.
As their μn ratio was small, the unpaired electron remained localized only on Ta (IV) with no hyperfine interaction.
Aten of Ta (IV) was more than those of six equivalent chloro ligands.
So its ESR spectrum would give a large octet (b) from Ta (IV) [2*7/2+1] only.
[TaBr6]2-
It showed the following features
Six bromo ligands were equivalent with same A ten, NQCC, σ, δ values respectively.
With comparable μn ratio, the unpaired electron was delocalized both on ligands and Ta (IV).
A ten of Ta (IV) was more than the bromo ligands.
Thus its spectrum would give a large octet (b) from Ta (IV) [2*7/2+1] whose each line split into 19 lines(c) by the hyperfine interaction between Ta(IV) and six equivalents Br [2*6(3/2+1].
Prediction of number of ESR peaks in Tc (II) Complexes
The complexes like [Tc Br6]4-and [Tc (NH3)6]2+ were studied.
[TcBr6]4-
It showed the following features:
With same A ten, NQCC,η, σ, δ values respectively, the six bromo ligands were equivalent.
With comparable μn ratio, unpaired electron was delocalized both on Tc (II)and Br ligands.
Aten of Tc (II) was more than the Br ligands.
Its spectrum showed a large decane (b) from Tc (II) [2*9/2+1].Each line of this decane would, further, split into smaller 19lines(c) due to hyperfine interaction between Tc (II) and six stereo chemically equivalent bromo ligands [2*6*3/2+1].
[Tc (NH3)6]2+
It showed the following features:
With the same Aten, NQCC, η, σ, δ values respectively, six NH3 ligands were equivalent.
As their mn ratio was large, the unpaired electron was localized on Tc (II)only.
Aten value of Tc (II) was less than those of N of NH3 ligands.
Its ESR spectrum would give only a large decane (b) from Tc (II) [2*9/2+1] with no hyperfine splitting between Tc (II) and NH3 ligands as their μn ratio was large.
Prediction of number of ESR peaks in Re (II) Complexes
It included three complexes such as: [Re X6]4- (X=Cl, Br) and [Re (NH3)6]2+.
[Re Cl6]4- and [Re (NH3)6]2+
Both showed the following features:
With the same Aten, NQCC,η, σ, δ values respectively, the six Cl and the NH3 ligands were equivalent.
Unpaired electron was localized only on Re (II) as there was no hyperfine interaction between Re (II) and ligands due to large ηn ratios respectively.
A ten of Re (II) was more than those of Cl or N of NH3.
Their ESR spectra showed only a large sextet (b) from Re (II) [2*5/2+1].
[Re Br6]4-
It showed the following features:
With the same Aten, NQCC, η, σ, δ values respectively, the six bromo ligands were equivalent.
Unpaired electron was delocalized both on Re (II) and stereo chemically equivalent bromo ligands as their μn ratio was comparable.
A ten of Re (II) was more than those of bromo ligands.
Its ESR spectrum would show a large sextet (b) from Re (II) [2*5/2+1]. Each line of this sextet, further, split up into a smaller 19 line(c) pattern due to hyperfine interaction between Re (II) and six equivalents Br [2*6*3/2+1].
Prediction of number of ESR peaks in Ru (III) Complexes
Three complexes such as [RuX6]3- (X= F, Cl, Br) were included.
[RuF6]3-(X=F, Br)
They showed the following features:
With the same A ten, NQCC, η, σ, δ values respectively, all the ligands were equivalent.
The unpaired electron was present only on Ru (III) because with small μn ratios, there was no hyperfine interaction between Ru (III) and F or Br.
Aten of Ru (III)was more than the F or the Br.
Their ESR spectra gave only large sextet (b) from Ru (III) [2*5/2+1].
[RuCl6]3-
It showed the following features:
With the same Aten, NQCC,η, σ, δ values respectively, the six Cl were equivalent.
With comparable μn ratio, the unpaired electron was delocalized both on Ru (III) and six Cl.
Aten of Ru (III)was more than those of the ligands.
Its ESR spectrum showed a large sextet (b) from Ru (III) [2*5/2+1] with each line of which would, further, split into smaller 19 lines (c) by the hyperfine interaction of six Cl [2*6*3/2+1] and Ru (III).
Prediction of number of ESR peaks in Os (III) Complexes
It included four complexes such as [Os X6]3- (X= F, Cl, Br) and [Os (NH3)6]3+
[OsX6]3- (X=F, Br)
Both the complexes showed the following common features:
With same Aten, NQCC,η, σ, δ values, all the ligands were equivalent.
Unpaired electron was localized on Os (III).
Aten of Os (III) was more than the F or the Br.
Their ESR spectra gave a large quartet (b) from Os (III) [2*3/2+1] as there was no hyperfine interaction between Os (III) and the F or the Br due to small μn ratio.
[OsCl6]3-
It showed the following features:
With same Aten, NQCC,η, σ, δ values respectively, the six Cl were equivalent.
The unpaired electron was delocalized on both Os (III) and the six equivalents Cl.
The A ten value of Os (III) was more than those of the six Cl.
Its ESR spectrum showed a large quartet (b) from Os (III) [2*3/2+1].Each line of this quartet further split up into 19 lines(c) from six spatially equivalents Cl [2*6*3/2+1] due to hyperfine interaction as their mn ratio was comparable.
[Os (NH3)6]3+
It showed the following features
There were three sets of Aten, NQCC,η, σ, δ values respectively for the six N of the six NH3 ; each set having two values. So there were present three types of stereo chemically different ligands respectively.
Unpaired electron was delocalized both on Os (III) and the six NH3 as μn ratio of Os and Nwas comparable.
A ten value of Os (III) was more than those of the ligands
Its spectrum would give a large quartet (b) from Os (III) [2*3/2+1] whose each line would, further, split into 125(d) lines[2*2*1+1]3 from 3 types of stereochemically different NH3 by the hyperfine interaction between Os(III) and the ligands. In fact, its ESR spectrum would exhibit a continuum.
Prediction of number of ESR peaks in Rh (IV) Complexes
It included four complexes: [RhX6]2- (X= F, Cl, Br) and [Rh (NH3)6]4+ which showed the following features:
With the same Aten, NQCC, η, σ, δ values respectively, the ligands like F, Cl, Br, NH3 were equivalent.
The unpaired electron was present only on Rh (IV).
Aten of Rh (IV) was more than the F, Cl or Br or N of NH3.
Their ESR spectra should give only a large doublet (b) from Rh (IV)[2*1/2+1] with no hyperfine interaction between Rh (IV)and any one of the four different types of ligands due to small μn ratios between Rh (IV) and the ligands respectively.
Prediction of number of ESR peaks in Ir (IV) Complexes
It included four complexes: [IrX6]2- (X= F, Cl, Br) and [Ir (NH3)6]4+ which showed the following features:
With the same Aten, NQCC, η, σ, δ values respectively, the ligands like F, Cl, Br, NH3 were equivalent.
The unpaired electron was present only on Ir (IV) (3) A ten of Ir (IV) was more than the F, Cl or Br or N of NH3.
Their ESR spectra would give only a large quartet (b) from Ir (IV) [2*3/2+1] because no hyperfine interaction between Ir (IV)and any one of four different types of ligands due to small μn ratios between Ir(IV) and ligands respectively.
Conclusion
Simply by knowing I and gn of metals and coordinating atoms (CA) of the ligands from the literature; calculating their nuclear magnetic moments and thus their relative μn ratios, we could predict the number or ESR lines in a vast number of complexes of 10 metal ions of 2nd and 3rd transition series which, hitherto, seemed tenacious experimentally.. In addition, there lies a future use of this study in predicting the number of ESR peaks in complexes containing a very large variety of spatially different NMR and ESR active both quadrupolar and nonquadrupolar coordinating nuclei because the software allows us to select or ignore the interacting nuclei at our choice. This clearly makes the DFT a very powerful diagnostic tool at the hands of the theoretical Chemists to deduce the future applications of transition metal complexes.
Acknowledgements
Authors gratefully acknowledge the kind and willing cooperation of Mr. Sunil Chawla [sunil@seascapelearning.com] of ADF (http://www.scm.com).They feel indebted to Mr. S.R. Heer, Chief Engineer (Retd.), North Zone, Doordarshan, New Delhi (India) for his invaluable cooperation in the installation and smooth working of the ADF software.
References
- Orio, M.; Pentazis, M. D.; Neese, A. F. Photosynthesis Res. 2009, 102, 443-53.
CrossRef - Autschbach, J., Zheng, S.; Schurko, R. W. Concepts in Magnetic Resonance, Part A. 2010, 36 A, 84–126
- Saladino, A. C.; Larsen, S. C. Catalysis Today. 2005, 105, 122–33.
CrossRef - Pantazis, D. A.; Chen, X. Y.; Landis, C. F.; Neese, F. J. Chem. Theory Comput. 2008, 4, 908–19.
CrossRef - Fritscher, J.; Hrobárik, P.; Kaupp, M. J. Phys. Chem. B. 2007, 111, 4616-29.
CrossRef - Yang, S. Y.; Ziegler, T. Organometallics. 2006, 25, 887-900.
CrossRef - Fischer, H. Inorganic Radicals, Metal Complexes and Nonconjugated Carbon Centered Radicals. Part 2.26 A, 2006, 1-6.
- Kaim, W.; Schwederski, B. Landolt-Borstein- GroupII Molecules and Radicals pp 1-63 Radicals in metal complexes. Ch- 3.5: Vol. 26A2.
- Irikura, K. K.; Goddard, W. A. J. Amer. Chem. Soc. 1994, 116, 8733–40.
CrossRef - Oltmanns, P.; Rehder, D. J. Org. Chem. 1988, 345, 87-96.
CrossRef - Wong, E. W.; Walsby, C. J.; Storr. T.; Leznoff, D. B. Inorg. Chem. 2010, 49, 3343-50.
CrossRef - Patchkovskii, S.; Ziegler, T. J. Am. Chem. Soc. 2000, 122, 3506–16.
CrossRef - Yoshimura, T.; Ikai, T.; Takayama, T.; Sekine, T.; Kino, Y.; Shinohara, A. Inorg. Chem. 2010, 49, 5876-88.
CrossRef - Kudo, T.; Tsuchihashi, N.; Ogata, T. Radioanalytical and Nuc. Chem. 1987, 118, 169-75.
CrossRef - Kozlova, S. G.; Gabuda, S. P.; Brylev, K. A.; Mironov,Y. V.; Fedorov, V. E. J. Phys. Chem. 2004, 108, 10565 –67.
CrossRef - Gancheff, J. S.; Denis, P. A. Phys. Chem. A. 2011, 115, 211-18.
CrossRef - Pacheco, M.; Cuevas, A.; González-Platas, J.; Faccio, R.; Lloret, F.; Julve, M.; Kremer, C. Dalton Trans. 2013, 42, 15361-71.
CrossRef - Esteves, M. C.; Vugman, N. V.; Leitão, A. A.; Bielschowsky, C. E. J. Phys. Chem. A. 2007, 111, 7218–22.
CrossRef - Liao, M. S.; Scheiner, S. Chem. Phys., 2002, 285, 195-206.
CrossRef - Baraldo, L. D.; Olabe, L. M. Inorg. Chem., 2001, 40, 5704 –07.
CrossRef - Vrieze, K.; Koten. G. V. Inorg. Chim. Acta. 1985, 100, 79-96.
CrossRef - Gancheff, J. S.; Denis, P. A.; Drescher, M.; Rainer, W. F.; Rigaut, S. Organometallics, 2010, 29, 5912-18.
CrossRef - Kowalski, K.; Rainer, M. L.; Winter, F.; Zabel, M.; Zalis, S.; Kelm, H.; Kroger, H. J.; Sarkar, B; Kaim, W. Organometallics, 2009, 14, 4196-4209.
CrossRef - Sakaki, S.; Yanase, Y.; Hagiwara, N.; Takeshita, T.; Naganuma, H.; Ohyoshi, A.; Ohkubo, K. J. Phys. Chem., 1982, 86, 1038–43.
CrossRef - Seuret, P.; Cicoira, F.; Ohta, T.; Doppelt, P.; Hoffmann, P.; Weber, J.; Wesolowski, T. A. Phys. Chem., 2003, 5, 268–74.
- Tsung, W.Thesis,:Thesis,“Tris(guanidinato)complexes of iridium and rhodium in the oxidation states +III and +IV: synthesis, characterization, and reactivity,” University of Iowa . 2011.
- Adams, C. J.; Anderson, K. M.; Charmant, J. P.; Connelly, N. G.; Field, B. A.;
- Hallett, A. J.; Horne, M. Dalton Trans. 2008, 28, 2680-92.
- Singh, H.; Bhardwaj, A. K.; Sehgal, M. L.; Mittal, S. K. Int. J. Current Res. Rev. 2012, 4, 12-28.
- Singh, H.; Bhardwaj, A. K.; Sehgal, M. L.; Mittal, S. K. Int. J. Current Res. Rev. 2013, 5, 13-31.
- Singh, H.; Bhardwaj, A. K.; Sehgal, M. L.; Mittal, S. K. Int. J. Current Res. Rev 2013, 5, 71- 88.
- Sharma, S.; Chander, S.; Sehgal, M. L.; Ahmad, I. Oriental J.Chem. 2015, 31, 1417-27.
CrossRef - Singh, H.; Bhardwaj, A. K.; Sehgal, M. L.; Ahmad, I. Oriental J.Chem.2015, 31, 671-79.
CrossRef - Singh, H.; Bhardwaj, A. K.; Sehgal, M. L.; Javed, M.; Ahmad, I. Oriental J.Chem. 2015, 31, 1461-68.
CrossRef

This work is licensed under a Creative Commons Attribution 4.0 International License.
![]()
A New Edition of Web of Science
Journal Impact Factor
2022: 0.5
Five Year: 0.8
Journal is Indexed in

Cabells Whitelist
![]()


