Novel Salt of Tinidazole with Improved Solubility and Antibacterial Activity
1Neuland Laboratories Limited, Sanali Info Park, Road No. 2, Banjara Hills, Hyderabad-500 034, Telangana State, India.
2Centre for Chemical Sciences and Technology, Institute of Science and Technology, Jawaharlal Nehru Technological University Hyderabad, Kukatpally, Hyderabad-500 085, Telangana State, India.
3Green Evolution Laboratories, Wangapally Village, Nalgonda-500 085, Telangana State, India.
4Anurag Group of Institutions (Formerly Lalitha College of Pharmacy),Venkatapur (V), Ghatkesar(M), Ranga Reddy district, Telangana State, India.
Corresponding Author E-mail: psrcmurthy2016@gmail.com
DOI : http://dx.doi.org/10.13005/ojc/330158
Download this article as:
![]()
The present study describes the preparation of novel salt of Tinidazole (TN) with p-Toluenesulfonic acid (PTSA) that display enhanced solubility and antibacterial activity in Bacillus. The salt was prepared by solvent-drop grinding and characterised by powdered X-Ray diffraction, thermal analysis, Fourier transformation infrared spectroscopy (FT-IR) and polarized microscopy. FT-IR data confirms Tinidazole salt with p-Toluenesulfonic acid (TN-PTSA). Powdered X-ray diffraction and thermal analysis data reveals that both TN and TN-PTSA are crystalline nature. From microscopic photographs of polarized microscopy, crystals of TN-PTSA are rod shape whereas crystals of TN are plate shape. Solubility measurement of TN-PTSA on UV spectrophotometer showed solubility improvement compared with TN by 49.7 times in water. Antibacterial test showed higher activity in TN-PTSA to the Gram-positive bacillus bacteria as compared to the TN. This study demonstrates that TN-PTSA can be a potential substitute to the TN in the treatment of infection with Gram-positive bacillus bacteria.
KEYWORDS:Salts; Tinidazole; p-Toluenesulfonic acid; Antibacterial activity; FT-IR; Solubility
Introduction
In recent times, enormous dedication and investigations in the field of pharmaceutical technology are being focussed in the direction of the prefabrication of the active drug molecules in order to increase the biological activity by sorting out the issues pertaining to bioavailability, dissolution and poor water solubility. Techniques like new salts preparation or co-crystals are used for this purpose1,2,3.
Aqueous solubility is the most important parameter for any drug. In general, when the aqueous solubility of drug is less, high dosage of drug is required for the treatment of disease. Increasing the aqueous solubility of a drug some times reduces the dosage required for the treatment of disease. This indirectly reduces the manufacturing cost and toxic side effects caused by the drug.4,5
Tinidazole [1-(2-ethylsulfonylethyl)-2-methyl-5-nitro-imidazole] is an antiparasitic drug used against Protozoan infections6. The molecular formula is C8H13N3O4S (Figure I). It was developed in 1972, and it is a prominent
member of the nitro imidazole antibiotics. Tinidizole has low solubility and high permeability and is categorised into biopharmaceutics classification system (II), these physical properties prompts the researcher to investigate in finding out the new salts with improved solubility. p-Toluenebenzenesulfonic acid is a strong organic acid with the molecular formula CH3C6H4SO2 (Figure II).
For designing new salts, the difference between the pKa values of API and a co-former component [ΔpKa [ΔpKa = pKa(base) – pKa(acid)] is often used to predict whether a salt or co-crystal can be expected for the two components. ΔpKa < 0 is generally considered to be associated with systems that form co-crystals and pKa > 2 results in salts 7,8,9.
Thermal analysis is frequently utilized to swot up variation in properties of material with temperature. To confirm new crystal form or solid forms of pharmaceuticals, techniques viz., (i) powder X-ray diffraction experiment is performed in order to understand the measurement and structural characterization10 and (ii) FT-IR, is used for the identification of salt or co-crystal11.
To the best of our knowledge, no salts have been reported with respect to Tinidazole in the literature. The present paper describes the formation of a novel salt of TN with PTSA (TN-PTSA), with improved solubility, and antibacterial activity in contrast to TN. The structural formula of TN and TN-PTSA is depicted in Figure-I and Figure-II respectively.
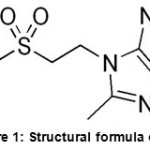 |
Figure 1: Structural formula of TN |
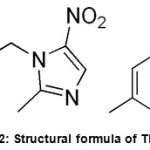 |
Figure 2: Structural formula of TN-PTSA |
Results and Discussion
Δpka Calculation
The pKa value of neutral form of Tinidizole and p-Toluenebenzenesulfonicacid is 2.3 and 0.43. The difference of two neutral forms of base and acid is >2 pKa . Since, the ΔpKa value is >2, TN is expected to form a salt with TN-PTSA .
Powder X-Ray Diffraction Analysis
The TN and TN-PTSA compounds were recorded for powder X-Ray diffraction analysis and the respective patterns are shown in Figure III and IV. The TN-PTSA solid form exhibited a change in X-ray powder diffraction pattern that is different from the XRD pattern of TN. TN shows characteristic peaks at 8.19, 10.20, 10.36, 14.47, 14.63, 16.34, 16.71, 16.88, 17.28, 17.79, 18.02, 19.04, 20.89, 21.56, 21.80, 21.97, 23.07, 23.29, 25.38, 27.23, 28.15, 28.34, 30.06, 31.74, 32.30, 33.31, 43.81, 49.56 (2θ ± 0.2o 2θ) while TN-PTSA shows characteristic at peaks 8.08, 8.44, 8.82, 9.73, 12.31, 12.91, 14.30, 15.89, 17.21, 18.94, 19.58, 19.86, 20.79, 21.76, 22.32, 22.87, 23.70, 24.02, 26.18, 26.38, 26.69, 29.30, 30.90, 32.81, 33.61, 44.03, 45.94, 49.31 (2θ ± 0.2o 2θ). The above variation patterns in powder X-Ray diffraction indicates that they have different crystal structures.
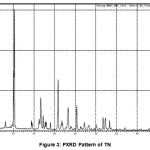 |
Figure 3: PXRD Pattern of TN |
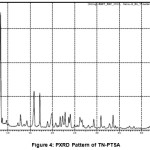 |
Figure 4: PXRD Pattern of TN-PTSA |
Thermal Analysis
The DSC curves of TN and TN-PTSA are shown in the figures V and VI. The sharp exothermic peak of TN and TN-PTSA indicates both the compounds are in crystalline nature. For TN, single sharp exothermic peak at 127.44oC and heat of process of 160.7 J g-1. The DSC curve of TN-PTSA presents a sharp single exothermic peak at 184.20oC and heat process of 100.0 J g-1 In general, higher melting point compounds are more stable compounds. Therefore, TN-PTSA is more suitable compound than TN for doing further research.
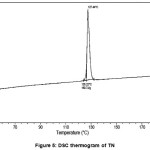 |
Figure 5: DSC thermogram of TN |
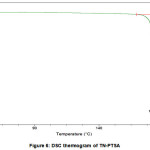 |
Figure 6: DSC thermogram of TN-PTSA |
The TG curve is shown in figures VIIA and VIIB. TG curve of TN and TN-PTSA did not present any weight lossthus suggesting these solid forms i.e TN and TN-PTSA are neither solvated nor hydrated.
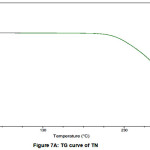 |
Figure 7A: TG curve of TN |
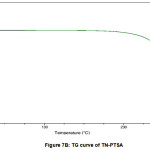 |
Figure 7B: TG curve of TN-PTSA |
In Karl Fisher titration, no water content was found in TN and TN-PTSA.This data is in accord with the results observed in both TGA and DSC.
Spectroscopic Analysis
Figure VIII and IX represents the FT-IR absorption spectra TN and TN-PTSA. The stretching frequencies in the region 2999-2911 cm-1, 1761 cm-1, 1522 cm-1, 1479 cm-1 1479 and 1454 cm-1 represents to the following groups such as -C-H,-C=C (imidazole ring), C=N (imidazole ring), N=O (NO2), CH2 bending and C-C stretching respectively. In addition to the above, the peaks at 1367, 1301, 1264, 1191-1123 and 1037 cm-1 corresponds to N=O symmetric stretching, S=O asymmetric stretching and C-O, S=O symmetric stretching and C-N stretching respectively. In TN-PTSA absorption band at 1163 cm-1 (SO3 stretching) and 1028 cm-1 (O=S=O stretching in SO3H) in the FT-IR spectrum indicates the presence of SO3H groups. The other adsorption peaks are observed in the expected region belongs to CH3 group at 1375 cm-1.
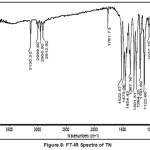 |
Figure 8: FT-IR Spectra of TN |
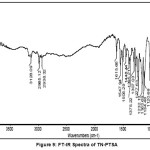 |
Figure 9: FT-IR Spectra of TN-PTSA |
Microscopy
Figures X and XI corresponds the morphology pictures of TN and TN-PTSA representing the crystalline nature. Crystals of TN-PTSA appeared as rod shape with average particle size of 110 mm to 120 mm and crystals of TN appeared as plate shape with average particle size of 80 mm to 90 mm. In general, crystals in rod shape are more preferable than plate shape crystals for formulations.
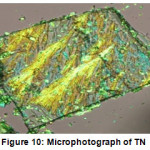 |
Figure 10: Microphotograph of TN |
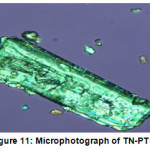 |
Figure 11: Microphotograph of TN-PTSA Click here to View Figure |
Solubility
Aqueous solubility profiles of TN and TN-PTSA are shown in the figures XII and XIII. In our experiments, the solubility of TN is 3.7 µg /mL and TN-PTSA is 184.2 µg /mL. From the aqueous solubility results it is evident that thers is an increase in solubility of TN-PTSA in comaparision to solubility of TN by 49.7 times
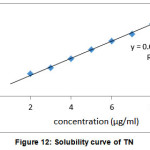 |
Figure 12: Solubility curve of TN |
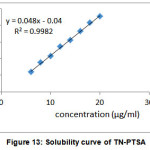 |
Figure 13: Solubility curve of TN-PTSA |
Antibacterial Evaluation
The antibacterial evaluation results TN, TN-PTSA and PTSA is presented in Table-1. The zone of inhibition was measured in mm, on three different concentrations 10, 20, 30 μg/mL. Maximum inhibitory activity was observed for 30 μg/mL and compounds showed their effect in a dose dependant manner.
The zone of inhibition increased as the concentration of the sample increased. From Table-1, it is observed that in case of Bacillus subtilus (MTCC 441): TN-PTSA displayed good activity (diameter of zone of inhibition:28-35 mm) and TN was moderately active (diameter of zone of inhibition:22-30 mm) when compared to standard antibiotic drug Streptomycin (zone of inhibition: 28-40 mm). In case of Escherichia coli (MTCC 2692) and Staphylococcus aureus (MTCC 902), compound TN exhibited good antibacterial (zone of inhibition: 15-30 mm) when compared to TN-PTSA, but displayed moderate antibacterial activity than Streptomycin. In case of Pseudomonas aeruginosa (MTCC 2453), TN-PTSA exhibited good antibacterial activity (zone of inhibition: 15-19 mm) when compared to TN, but displayed moderate antibacterial activity than Streptomycin.
Table 1:Results of Antibacterial Bioassay of Compounds TN-PTSA, TN, PTSA(concentration in DMSO).
|
Compound |
Concentration of the compound μg/mL |
GNBa |
GPBb |
||
|
Pa |
Ec |
Sa |
Bs |
||
|
TN-PTSA |
10 |
15 |
11 |
14 |
28 |
|
20 |
17 |
18 |
20 |
32 |
|
|
30 |
19 |
19 |
24 |
35 |
|
|
TN |
10 |
12 |
15 |
28 |
22 |
|
20 |
13 |
17 |
29 |
26 |
|
|
30 |
15 |
20 |
30 |
30 |
|
|
PTSA |
10 |
2.6 |
2.5 |
3.2 |
2.8 |
|
20 |
3.8 |
3.5 |
4.0 |
3.2 |
|
|
30 |
5 |
5 |
5.2 |
5.4 |
|
|
Streptomycin |
10 |
14 |
16 |
25 |
28 |
|
20 |
20 |
21 |
31 |
30 |
|
|
30 |
25 |
31 |
38 |
40 |
|
aGNB: Gram negative bacteria; bGPB: Gram positive bacteria; Pa: Pseudomonas aeruginosa; Ec: Staphylococcus aureus; Sa: Staphylococcus aureus; Bs: Bacillus subtilus
Experimental Section
Materials and Methods
Materials
Tinidazole and analytical grade solvents utilized for the study was purschased from Sigma Aldrich (India, purity:> 99.5%).
Preparation of TN-PTSA
An equimolar mixture of 200 mg (1 mmol) of TN, 142 mg (1mmol) of PTSA and few drops of water was taken in agate mortar and grinded for 15-20 minutes to obtain TN-PTSA (until a dried powder).
Powder X-ray diffractometry (PXRD)
Utilising X-ray diffractometer (Model RINT Ultima, Rigaku Denki, 200 mg of TN-PTSA was loaded into the sample holder) under the conditions of measurement viz., target Cu, monochrometer graphite, voltage 45 kV and current 40 mA, with a scanning speed of 1°C/minute, the powder X-ray diffraction pattern was obtainted.
Differential Scanning Calorimeter (DSC)
Using differential scanning calorimeter (Model Q100, TA instruments), DSC thermograms were obtained. The measurements were recorded using aluminium sample pan, (utilizing ~ 2-10 mg samples under nitrogen atmosphere),at a scanning speed of 2°C/minute.
Thermo Gravimetric Analysis (TGA)
Thermo gravimetry (TG) curves were obtained by a thermo gravimeter (Model Q500, TA instruments). The measurements were made using a 50 mg platinum pan (sample weight about 10 mg) under nitrogen atmosphere at a scanning speed of 2°C/minute. Mass loss (%) was calculated based on the mass of the original sample.
Karl Fischer Titration (KFT)
Water content (% W/W) of the samples (200 mg) were obtainted by a Karl Fischer titrimetry (716 DMS Titrino, Metrohm Limited, Switzerland). The instrument was calibrated by using deionized water, before sample analysis.
Fourier Transform Infrared Spectroscopy (FT-IR)
FT-IR spectra were obtainted by a Infrared spectrometer (Bomem MB-120). Spectra over a range of 500 to 5000 cm-1 with a resolution of 1 cm-1 (32 scans) were recorded using KBr pellets. For diffuse reflection analysis, samples weighing approximately 2 mg were mixed with 200 mg KBr by means of an agate motor and pestle, and placed in sample cups for fast sampling.
Polarized Microscopy (PM)
Microphotographs were obtained by a Polarized Microscopy (Nikon LV100). Images were generated under transmitted light with partially crossed polarizers.
Particle Size Determination
Particle size determination was carried out with a calibrated eye piece micrometer. About 100 microcrystal size was measured individually, average was taken and their size range and mean diameter frequency was calculated.
Average Particle size is calculated by the formula,
Average Particle size = εnd/n
Aqueous Solubility Measurement by UV Spectrophotometer
The absorbance values for TN and TN-PTSA in deionised water at different times were detected by a μDISS Profile apparatus. The measurement of solubility was carried out at 430 nm, where PTSA has no absorption and the concentrations of TN-PTSA were calculated by means of a standard curve. In a typical experiment, 10 mL of aqueous medium was added to a flask containing 1mg sample, and the resulting mixture was stirred at 25oC and 400 rpm.
Antibacterial Bioassay
The investigated compounds TN, PTSA, TN-PTSA were tested against Gram negative strains: (i) Escherichia coli (MTCC 2692) and (ii) Pseudomonas aeruginosa (MTCC 2453), and Gram positive strains of (iii) Staphylococcus aureus (MTCC 902) and (iv) Bacillus subtilus (MTCC 441) at concentrations of 10, 20 and 30 μg/mL, using agar well diffusion method according to the literature protocol.
Soyabean casein digest agar Media (40g, Hi-Media) mixed with 1000 mL Milli Q water and then sterilized in autoclave at 15 lb pressure for 20 minutes. The sterile Soyabean casein digest agar media solution is allowed to cool at 45°C. To this 1 mL of specified bacterial or Fungi test organism is added. These preparations are then poured into Petri dishes of 90 mm diameter and allowed to solidify medium. The inoculation was done under aseptic conditions and when the medium was in molten state. The solidified plates were bored with 8mm diameter cork borer. The plates with wells were used for the antimicrobial studies.
Test solutions was prepared by dissolving the compounds (TN, TN-PTSA, PTSA) in DMSO at various concentrations such as 10, 20,30 μg/mL. 100 μL each concentration of these compounds was added in the bored place. Streptomycin was used as a standard reference and DMSO was used as a control solvent (added by using a micropipette) which did not possess any inhibition zone. The plates were incubated at 30-35ºC for 24 hours. The zone of inhibition was calculated by measuring the diameter of the inhibition zone around the well (in mm) including the well diameter12,13. In all 3 replicates, readings were taken in three different fixed directions and the average values were tabulated.
Conclusions
Novel salt of Tinidazole (Tinidazole with p-Toluenesulfonic acid) with improved aqueous solubility and anti-bacterial activity in Gram positive bacillus bacteria has been identified. Variation patterns in powder X-Ray diffraction of TN and TN-PTSA indicates that both have different crystal structures. From the DSC results, it concluded that TN-PTSA is more physically stable compound than TN. TGA and Karl Fisher titration data are in concurrence with DSC data. The salt formation was confirmed by FT-IR analysis. Solubility analysis showed enhance in aqueous solubility of TN-PTSA by 49.7 times. Furthermore, antibacterial activity of TN-PTSA to Gram positive bacillus bacteria is improved compared with TN.
Therefore, TN-PTSA can be used for carrying out further research aiming to decrease the dosage of Tinidazole drug in the treatment of infections with gram positive bacillus bacteria. In addition the improved antibacterial activity reveal that the pharmaceutical salt of Tinidazole with the p-Toluenesulfonic acid (TN-PTSA) can be a potential substitute to Tinidazole in the treatment of diseases with gram positive bacillus bacteria.
Acknowledgement
The support received from Mukkant Khagga of Jawaharlal Nehru Technology University, is gratefully acknowledged.
References
- Byrn, S.R. Solid-State Chemistry of Drugs, 2nd ED., SSCI Inc., New York, 1999.
- S.R.Vippagunta, H.G.Brittain and D.J.W.Grant, Adv.Drug Deliv.Res., 2001.
- Haleblian, J.; Jand Crone, W.M. J.Pharm.Sci. 1969, 58, 911.
CrossRef - Ketan Savjani, T.; Anuradha Gajjar, K.; Jignasa Savjani K. ISRN Pharmaceutics. 2012, Article ID 195727.
- Edward Kerns, H. J. Pharm.Sci. 2001, 90,1838.
CrossRef - https://medlineplus.gov/druginfo/meds/a604036.html.
- Stevens, J.S.; Byard, S.J.; Schroeder, S.L.M. Cryst.Growth Des. 2010, 10,1435.
CrossRef - Scott L. Childs , G. Patrick Stahly, and Aeri Park. Mol. Pharmaceutics, 2007, 4(3), 323-338.
- Stahl, P.H.; Wermuth, C.G. Hand book of pharmaceutical salts: Properties, Selection, and Use, 2nd Revised Edition. Weinheim:Wiley-VCH:2011.
- Tjahjono, M.; Schreyer, M.K.; Guo, L.; Garland, M. J Therm Anal Calorim. 2012, 108, 361.
CrossRef - Sarma, B.; Chen, J.; Hsi, H.Y.; Myerson, A.S. Korean J Chem Eng. 2011, 28, 315.
CrossRef - Biljana, R.D.; Niko, S.R.; Vidoslav, S.D.; Vukicević, R.D.; Palić, R.M. Molecules, 2010, 15, 2246.
CrossRef - Pelczar Jr MJ, Reid RD, Chan ECS, Cultivation of bacteria. In: Microbiology 4th Ed.,New Delhi; Tata McGraw Hill Publishing Co. Ltd, 1982, 103.


![]()


