Influence of Chemical Dose Splitting on Reduction of Carcinogenic Compounds During Paper Mills
Divya Prakash1, Shalini Singh2 and S. Kumar3
1ASET, Amity University Rajasthan, Jaipur, India.
2Lovely Professional University, Punjab, India.
3Indian Institute of Technology Roorkee, Roorkee, India.
Corresponding Author Email: divya1sharma1@gmail.com
DOI : http://dx.doi.org/10.13005/ojc/330154
Article Received on :
Article Accepted on :
Article Published : 18 Feb 2017
The major effects with exposure to high levels of chlorophenols are on the liver and the immune system. The International Agency for Research on Cancer (IARC) and the Environmental Protection Agency (EPA) has declared that the chlorophenols, are carcinogenic to man. The current study aims to analyze the residual bleaching effluent received from all bleaching stages of Jute Cady pulp for its content of chlorophenolics. Gas chromatographic analysis yielded important information regarding the types and concentration of various chlorinated derivatives in the effluent with, the major derivatives being phenols, catechols, guaiacols, syringaldehydes. The results indicate that splitting of chlorine dose in Chlorine (C) stage drastically reduced the formation of chlorophenolics in the spent liquor nearly by 46%, in the absence of washing between C1 and C2 stage. The total chlorophenolics further decreased by 51% when, washing between C1 and C2 stage was introduced thereby exhibiting a 5% increase in chlorophenolic content in comparison to chlorination stage i.e. without washing between C1 and C2 stage. The study is significant in the light of economy and toxicity and hold great promise to be used for designing chlorination stages for pulp bleaching for a more environment friendly pulp bleach process.
KEYWORDS:Jute Cady; Toxicity; Spent Bleach liquor; Gas Chromatography; Chlorophenolics
Download this article as:| Copy the following to cite this article: Prakash D, Singh S, Kumar S. Influence of Chemical Dose Splitting on Reduction of Carcinogenic Compounds During Paper Mills. Orient J Chem 2017;33(1). |
| Copy the following to cite this URL: Prakash D, Singh S, Kumar S. Influence of Chemical Dose Splitting on Reduction of Carcinogenic Compounds During Paper Mills. Orient J Chem 2017;33(1). Available from: http://www.orientjchem.org/?p=30424 |
Introduction
Water pollution is an ever increasing problem which has drastically amplified during the last few years. The major reason behind this is rapid industrialization needed to sustain exploding human population. The lack of appropriate planning to deal with the exponentially increasing demand for fresh water and corresponding generation of waste water has led to increase in water pollution at an alarming rate [1]. It has been observed that many industries are continuously producing hazardous waste materials and also emitting this wastage directly into the environment without giving any treatment. [2]. Paper and Pulp industry is among the seventeen most polluted industries [3]. This industry generates 200m3 of effluent/tonne of paper produced [4]. The paper and pulp industries are producing a huge amount and number of chlorophenolics compounds which are carcinogenic in nature [5, 6].
Even though, the harmful effects of chlorine bleaching on environment have been clearly established, in India many paper producing industries are applying the conventional CEH or CEHH till now. In developing countries a large number of paper mills do not have any proper recovery section, so they are giving pulps which have comparatively higher Kappa number and due to this reason the demand of bleaching chemicals have to be increased to achieve the target brightness. And due to inherent weak drainage qualities, with weak washing efficiency of the washers, a huge amount of dissolved organics are also carried over along with pulp to bleaching process. Durin bleaching stages C and first E stages produce the maximum amount of the toxic chlorinated phenolics compounds in residual effluent [7,8]. Among these compounds nearly 75 to 80% of the chlorine derivative phenolics compounds in effluent are high molecular weight material, and to identify these compounds is not a easy procedure. [9,10]. These compounds are majorly responsible for color and TOCl. They accumulate in the receiving streams. These low molecular weight chlorophenolics compounds produced during production of paper are reported to cause acute toxicity and mutagenicity due to their quality to penetrate living cell membrane [6, 11-12]. Therefore the chlorinated organic compounds generated in bleach plant effluent are of great environmental concern in conventional CEH or CEHH bleaching sequences. Effluents from the bleaching stages mainly, Extraction stage, of pulp bleaching are highly coloured and have a high COD. Although the amount of these toxic chemicals in the effluent must be reduced, but it is also necessary to achieve the target pulp brightness, which is suggested to be 80% as per standards followed [12-15] Thus, achieving target brightness may in fact be a secondary but, crucial characteristic of final product.
Apart from pollution problem plaguing the industry, Pulp and Paper industry is also continually faced with shortage of good-quality paper pulp sources and efforts to utilize newer and better fibre sources are being investigated [16-17]. Jute (Cassia acetifolia) is an important source of high-quality paper pulp fiber for Indian paper industries. Jute Cady is a comparatively cheap substitute for paper production (target brightness upto 80%) in comparison to hard woods. In India, the plant is cultivated in the states of West Bengal, Bihar, Uttar Pradesh, Assam, Meghalaya, Orissa, and Tripura. The other jute producing countries are Bangladesh, China, Nepal, Myanmar, Thailand and Indonesia. India contributes to about 2/5th of the total world jute production, with the major cultivation done in eastern and central part of the country [18-20].
As, majority of the related data have been done on softwood and hardwood pulps [12,21], non-wood pulps need to be exhaustively investigated in today’s changing demands especially, in reference to India.
Thus, the present investigation analyzes the chlorphenolic content of bleach liquor generated after bleaching of jute cady pulp to better understand the implications of utilization of jute cady as a paper raw material in India and its influence on the environmental quality. In contrast to the conventional bleaching, we split the chlorine dose in two equal portions as, C1 and C2 stages, to bleach the jute cady pulp. To the best of our knowledge, splitting of chlorine dose has been done on mixed paper pulps [13-15], but not on a single pulp, as in our case (Jute Cady). The bleached pulp characteristics (brightness and viscosity) and bleach effluents characteristics viz. COD, colour and chlorophenolic content, both qualitative and quantitative estimation) were evaluated.
Experimental Setup
Chemicals
All the reference standard chlorophenolics were purchased from Sigma Aldrich USA and Helix Biomedix, Canada. The other chemicals used were of HPLC and LR grade from reputed companies. The 90- 10% acetone water standardize solutions of chlorophenols were used [22].
Procurement and pre processing of pulp
Unbleached jute cady pulp was procured from Shreyans Paper Mill, Ahmedgarh, Punjab India. The pulp was washed, screened with the help of particular size sieves of 250 mm and air dried and stored in air tightened poly bags under dry conditions for further use.
Pulp bleaching
The kappa number of the unbleached pulp was determined as per standard (TAPPI, T-236) method [22] and subsequently, the pulp was bleached using different bleaching sequences. We practiced many stages of bleaching as we have to achieve the 80% brightness. (Table 1). The pulp was bleached by modified chlorine bleaching with washing after chlorine stage, CwwEH bleaching and, without washing after chlorine stage, CwoEH bleaching sequence and, the test sequences were compared with the conventional bleaching sequence, CEH.
In conventional CEH bleaching, the wet disintegrated pulp equivalent to 40 g OD was dispersed, add the required amount of bleach liquor in it & the pH of the suspension was reduced to 2 with dilute H2 SO4 before adding bleach liquor to it. The pulp suspension was transferred into a plastic bottle. Calculated fixed amount of H2SO4 was also added, so that the pH of the suspension remained 2. The pulp was shaken from time to time and kept for a period of 45 minutes at 30oC temperature. (Table-1). In the second Extraction stage i.e. E stage, the required amount of NaOH of known strength was mixed with pulp suspension and required water was also added to get 10% consistency. The pulp was repeatedly kneaded to uniformly distribute alkali into pulp suspension. The polythene bag was then vertically suspended in a water bath maintained at 70oC for 60 minutes (Table-1). The washed pulp after alkali extraction was then mixed with requisite amount of hypochlorite bleach liquor and water to adjust the pulp consistency to 10% in this H stage. The contents were transferred to a plastic bag and it was placed in a water bath pre-heated to 40oC for 3.5 hrs. After each 30 minutes, the pH of the pulp was checked at an interval of 30 mins and adjusted to pH 10[22] (Table 1).
Table 1: Comparison of pulp and effluent properties of modified chlorine bleaching with conventional CEH bleaching under specific bleaching conditions
|
Parameter |
Units |
Conventional CEH |
Cw.w. EH |
Cw.o. EH | ||||||
|
C |
E |
H |
C |
E |
H |
|||||
| C | E | H | C | E | H | C | E | H | ||
| Charge as active Cl |
% |
8.1 | – | 5.4 |
8.1 |
— |
5.4 |
8.1 |
— |
5.4 |
| Alkali charge as NaOH |
% |
– | 4.35 | – |
— |
4.35 |
— |
— |
4.35 |
— |
| Residual chlorine (of total) |
% |
1.22 | – | 3.09 |
.096 |
— |
1.93 |
1.46 |
— |
2.01 |
| Temperature |
oC |
30 | 70 | 40 |
30 |
70 |
40 |
30 |
70 |
40 |
| Consistency |
% |
3 | 10 | 7 |
3 |
10 |
7 |
3 |
10 |
7 |
| Retention time |
Minute |
45 | 60 | 230 |
45 |
60 |
230 |
45 |
60 |
230 |
| End pH |
— |
2.09 | 10.65 | 10.04 |
1.69 |
12.07 |
11.57 |
1.88 |
12.16 |
11.78 |
| COD |
kg/t |
31.3 |
76.5 | 24.6 |
23.9 |
71.8 |
21.9 |
22.4 |
68.7 |
21.5 |
| Colour |
kg/t |
43.8 |
83.9 | 2.4 |
32.7 |
71.6 |
0.9 |
29.7 |
70.1 |
0.9 |
| Viscosity |
Cp |
15.6 |
17.5 |
18.9 |
||||||
| Brightness |
%ISO |
80 |
80 |
80 |
||||||
| Unbleached Kappa No. |
— |
27.00 |
||||||||
In case of modified bleaching sequence, in C Stage the total chemical dose was divided into two equal amount. In the present experiment the C stage bleaching was modified by splitting the chlorine dose in two C1 and C2 stages. Firstly 50% of the bleach liquor was added to the pulp suspension and the bleaching under C stage conditions was continued for 20 minutes.
In CwoEH bleaching, the pulp was washed after completing C1 and C2 bleaching stage. 50% of the required amount of bleach liquor was added to the pulp suspension and the bleaching under C stage conditions was continued for 20 minutes for C1 stage. And the rest 50% of bleach liquor was added for next C2 stage. After C1 and C2 stage the pulp was washed. The effluent was collected and used for further continuous analysis in this CwoEH bleaching sequence. The remaining bleaching sequence (E and H stages) was completed as conventional bleaching (CEH bleaching), previously described.
Further, in CwwEH bleaching, the pulp was washed with fixed amount i.e. 100 ml of water after completing C1 stage. The washed pulp was used for next C2 stage. After C2 stage again washing was also done. The effluents from both C1 and C2 stages were collected, mixed and used for further continuous analysis in this CwwEH bleaching sequence. The remaining bleaching sequence (E and H stages) was completed as conventional bleaching (CEH bleaching), previously described.
After completion of each bleaching sequence, the washed pulps were evaluated for brightness [22] and viscosity [23] and the bleach effluent analyzed of COD, colour [23] and Chlorophenolics compounds [24].
Analysis of generated bleach effluent
In generated bleach effluent, COD, color and chlorophenolics were estimated [23]. The chlorophenols from the effluents were first modified as per the method suggested by Lindstrom and Nordin [24] and their acetyl derivatives, so obtained, were analyzed by the using Shimadzu Gas Chromatograph (Model GC- 9A) for estimation of chlorophenolics compounds under specified experimental conditions. GC analysis was carried out as used previously in our work[13,22]. For this analysis FID detector of HR-1 column was used. The range of detector was 10oC. The injection temperature was 275 oC while the sample size was 0.5-1µl.The column dimensions were 30m X 0.32mm. The following temperature programme was used: 80oC for initial 3 minutes then increased by 2oC/min upto 160oC. Then 160oC isothermal was used for next 5 minutes, again increased by 10oC/min upto 260oC and was maintained it for next 15 minutes [12, 21].
Results And Discussion
Effect of modified CEH pulp bleaching on pulp and effluent properties
As shown in table 2, Fig 1-3???, in CwoEH, the bleached pulp target brightness (80%) was achieved with, interestingly, an appreciable increase in pulp viscosity (12%), which indicated that CwoEH bleaching provided satisfactory pulp properties for further use. The effluent COD reduced by 11%and effluent color was also reduced by 19% under CwoEH bleaching as compared to conventional CEH bleaching. (Table 2, Fig 1-3)
Table 2: Effect of modified chlorine bleaching on the generation of chlorophenolic compounds in the effluent
| Name of the Compound | Conventional CEH | C (splitting) EH | |||||||
| CwoEH | CwwEH | ||||||||
|
C |
E | H |
C |
E | H |
C |
E | H | |
| 2,4 Dichlorophenol | 2.94 | 4.24 | 1.53 | 1.54 | 2.36 | 0.57 | 1.50 | 2.24 | 0.56 |
| 2,5 Dichlorophenol | 1.04 | 1.19 | – | 0.63 | 0.74 | – | 0.61 | 0.72 | – |
| 2,3-Dichlorophenol | 0.22 | – | – | 0.12 | – | – | 0.10 | – | – |
| 3-chloroguaiacol | – | 0.37 | – | – | 0.19 | – | – | 0.17 | – |
| 2,6 Dichlorophenol | 0.32 | 3.92 | – | 0.18 | 2.45 | – | 0.15 | 2.32 | – |
| 4-chlorophenol | 0.64 | – | – | 0.37 | – | – | 0.34 | – | – |
| 3-chlorophenol | 0.78 | 2.16 | 0.28 | 0.41 | 1.27 | 0.10 | 0.39 | 1.25 | 0.09 |
| 4-chloroguaiacol | 0.06 | – | 0.34 | 0.03 | – | 0.18 | 0.02 | – | 0.17 |
| 5-chloroguaiacol | – | 1.78 | 0.18 | – | 0.98 | 0.06 | – | 0.76 | 0.06 |
| 6-chloroguaiacol | – | – | – | – | – | – | – | – | – |
| 2-chlorophenol | 0.26 | – | – | 0.12 | – | – | 0.11 | – | – |
| 2,3,5-Trichlorophenol | 0.18 | 3.73 | – | 0.08 | 2.39 | – | 0.08 | 2.28 | – |
| 2,4,6-Trichlorophenol | 2.79 | 4.94 | 0.76 | 1.84 | 2.61 | 0.27 | 1.81 | 2.53 | 0.20 |
| 2,4,5-Trichlorophenol | – | – | – | – | – | – | – | – | – |
| 3,5 Dichloroguaiacol | – | – | – | – | – | – | – | – | – |
| 2,3,4 Trichlorophenol | – | – | – | – | – | – | – | – | – |
| 2,3,6 Trichlorophenol | 0.96 | 6.91 | – | 0.57 | 3.83 | – | 0.52 | 3.64 | – |
| 3,6 Dichloroguaiacol | 0.11 | – | – | 0.05 | – | – | 0.04 | – | – |
| 3,4 Dichloroguaiacol | 0.33 | 5.37 | – | 0.19 | 3.35 | – | 0.16 | 3.21 | – |
| 3,4-Dichlorocatechol | 4.65 | 2.34 | – | 2.34 | 1.40 | – | 2.02 | 1.27 | – |
| 3,4-Dicholorophenol | 0.99 | – | – | 0.41 | – | – | 0.29 | – | – |
| 4,5 Dichloroguaiacol | – | – | – | – | – | – | – | – | – |
| 4,6 Dichloroguaiacol | – | 0.45 | 0.14 | – | 0.26 | – | – | 0.20 | – |
| 5-Chlorovanillin | 2.14 | 3.66 | – | 1.07 | 2.03 | – | 0.98 | 1.89 | – |
| 5,6 Dichloroguaiacol | – | 3.18 | 0.27 | – | 1.67 | 0.15 | – | 1.58 | 0.15 |
| 4-Chlorocatechol | 3.72 | – | – | 1.85 | – | – | 1.64 | – | – |
| 3,5-Dichlorocatechol | 6.15 | 2.10 | – | 3.07 | 1.16 | – | 2.93 | 1.12 | – |
| 2,3,5,6-Tetrachlorophenol | – | – | – | – | – | – | – | – | – |
| 2,3,4,5-Tetrachlorophenol | – | – | – | – | – | – | – | – | – |
| 2,3,4,6-Tetrachlorophenol | 0.92 | 0.68 | – | 0.48 | 0.42 | – | 0.45 | 0.39 | – |
| 3,5,6-Trichloroguaiacol | – | 0.50 | – | – | 0.28 | – | – | 0.24 | – |
| 3,4,6-Trichloroguaiacol | – | 2.27 | – | – | 1.26 | – | – | 1.17 | – |
| 3,5-Dichlorosyringol | – | 1.60 | 0.35 | – | 0.94 | 0.12 | – | 0.90 | 0.12 |
| 3,4,5-Trichloroguaiacol | 2.41 | 3.34 | 0.96 | 1.26 | 1.96 | 0.53 | 1.20 | 1.72 | 0.49 |
| 3-Chlorocatechol | 4.78 | – | – | 2.51 | – | – | 2.26 | – | – |
| 6-Chlorovanillin | 0.68 | 2.01 | – | 0.32 | 1.16 | – | 0.28 | 1.08 | – |
| 3,6-Dichlorocatechol | 0.94 | 0.62 | – | 0.54 | 0.36 | – | 0.44 | 0.34 | – |
| 4,5,6-Trichloroguaiacol | 0.62 | 0.48 | – | 0.26 | 0.29 | – | 0.25 | 0.26 | – |
| 2-Chlorosyringaldehyde | 1.19 | 2.18 | 0.48 | 0.57 | 1.21 | 0.18 | 0.52 | 1.13 | 0.13 |
| 4,5-Dichlorocatechol | 0.85 | – | – | 0.42 | – | – | 0.39 | – | – |
| Pentachlorophenol | 0.69 | 7.51 | 0.66 | 0.37 | 3.85 | – | 0.30 | 3.62 | – |
| 3,4,5-Trichlorocatechol | 7.18 | 6.10 | – | 3.49 | 3.58 | – | 3.11 | 3.43 | – |
| Tetrachloroguaiacol | 1.75 | 2.70 | 0.83 | 0.88 | 1.68 | 0.37 | 0.82 | 1.66 | 0.32 |
| Trichlorosyringol | 0.50 | 8.89 | – | 0.31 | 4.76 | – | 0.27 | 4.15 | – |
| 3,4,6-Trichlorocatechol | 1.03 | – | 0.92 | 0.49 | – | 0.32 | 0.45 | – | 0.28 |
| 2,6-Dichlorosyringaldehyde | 0.29 | 7.18 | – | 0.16 | 3.89 | – | 0.12 | 3.64 | – |
| 5,6-Dichlorovanillin | 0.71 | 4.46 | 0.37 | 0.36 | 2.73 | 0.14 | 0.34 | 4.58 | 0.12 |
| Tetrachlorocatechol | 4.32 | 2.70 | 1.12 | 1.78 | 1.50 | 0.48 | 1.05 | 1.47 | 0.33 |
|
Total |
57.14 |
99.56 |
9.19 |
29.07 |
56.56 |
3.47 |
25.94 |
54.96 |
3.02 |
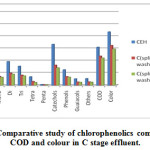 |
Figure 1: Comparative study of chlorophenolics compounds COD and colour in C stage effluent. |
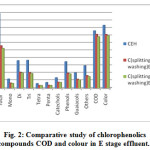 |
Figure 2: Comparative study of chlorophenolics compounds COD and colour in E stage effluent. |
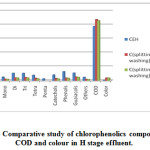 |
Figure 3: Comparative study of chlorophenolics compounds COD and colour in H stage effluent.
|
As Fig.1-3??? and Table 2 indicate, a decrease in the amount of all derivatives of chlorophenolic compounds (mono to penta) , guaiacols, phenols, catechols, and other chlorinated compound generated in C, E, H stage effluents, with the use of split chlorine dose in C stage in comparison to conventional CEH bleaching. It was also reported by Hise that when chemical doses into two equal portions, the formation of chlorinated compounds is reduced drastically [13].
Splitting of chlorine dose reduced the chlorinated phenolics by 49%, 43% and 62% in the bleaching effluent of C stage, E stage and H stage respectively in comparison of conventional CEH bleaching. A reduction of 47%, 45%, 45%, 49% and 52% in the content of mono, di, tri, tetra and penta-chlorophenolic compounds was founded respectively for CwoEH bleaching. Also, a drastic reduction in content of phenol (45%), catechol (49%), guaiacol (44%) and other chlorinated compounds (46%) was observed during CwoEH bleaching (Table 2, Fig 1-3). A great decrease in tetrachlorocatechol, 5,6 dichlorovanillin,2,6 dichlorosyringaldehyde, 3,4,5 trichlorocatechol, 3,4,5 trichloroguaiacol, pentachlorophenol, 5,6 dichloroguaiacol, in the range of 45-48%, was also observed in CwoEH bleaching when it compared to conventional CEH bleaching (Table 2, Fig 1-3). The splitting of chlorine dose meant application of lower concentration of chlorine over longer period of time as compared to conventional bleaching sequence which indicated milder attack on cellulose and hemicellulose while giving lower dissolution of carbohydrate fraction, lower pulp degradation, will yield stronger pulp of higher viscosity. At the same time, it will results into a lower effluent COD and color [12,21]
In CwwEH bleaching, the target brightness was again achieved, with the pulp visosity improvement by 21% in comparison to CEH bleached pulp (Table 2, Fig 1-3). The total chlorophenolics in CwwEH bleaching decreased by 51% in comparison of CEH conventional bleaching. A reduction in total chlorophenolic content of 55, 47 and 67% respectively in C, E, H stage effluent was observed for CwwEH bleached pulp (Table 2, Fig 1-3) as compared to conventional (CEH) bleaching. A huge reduction of 52%, 48%, 49%, 57% and 56% in mono, di, tri, tetra, and penta chlorophenolic compounds, respectively, for CwoEH bleaching sequence was also observed (Table 2, Fig 1-3) as compared to conventional bleaching. A similar trend was also observed the content of phenols, catechols, guaiacols and other chlorophenolics, the respective reductions being, 48%, 55%, 48% and 50%, in comparison of conventional bleaching (Table 2, Fig 1-3). The effluent COD was also found to decrease by 15%, while color was reduced by 23% for CwwEH, as compared to CEH bleaching. Table 2, Fig 1-3)
On comparing CwwEH bleached pulp with CwoEH bleached pulp, we noticed that 5% more reduction in the amount of chlorophenolics compounds was found in case of CwwEH as compared to CwoEH bleached pulp. The amount of chlorophenolics decreased more when pulp is washed after the first-split chlorination stage (CwwEH) in comparison to CwoEH bleaching. Washing of pulp after first chlorination stage removes the water soluble fraction of the lignin and other color constituents which consumes a portion of chlorine when fresh chlorine is charged in second split chlorination stage. The lignin and other colored constituents are attacked better, forming a lower CE kappa number [13,15].
Conclusion
Splitting of chlorine dose reduces the pollution load and gives a pulp of satisfactory brightness which turns out to be of higher strength (in terms of pulp viscosity) as compared to the conventional CEH bleaching. Splitting of chlorine dose in C stage in two equal portions also reduces the generation of chlorophenolics by 52-57% in comparison of conventional CEH bleaching sequence. Also, the reduction in effluent color is 23-28% and COD is 34-35% in comparison of conventional CEH sequence And the pulp quality as viscosity is also increased with 20-21% in comparison of conventional CEH sequence but not at the cost of brightness. Also, In the CwwEH bleaching, the reduction in content of chlorophenolic compounds (nearly 5%), COD ( nearly 4%) and Color (nearly 4%) is higher than that in the case of CwoEH bleaching. And the pulp quality in CwwEH is also improved by 9% in comparison of CwoEH. bleaching sequence.
Hence, as the target brightness (80%) is satisfactorily achieved with improved pulp strength (viscosity) properties and, the environment pollutants (Chlorophenolics, COD and color) in the effluent generated are drastically reduced and, the application of lower chlorine doses translates into better economical benefits in case of modified bleaching in comparison to conventional CEH bleaching, we propose the application of the modified CEH bleaching adopted by us instead of conventional CEH bleaching. Also, as CwwEH bleaching promises better applicability and higher benefits in terms of higher viscosity, lower toxicity, than CwoEH bleaching, it can easily applied for pulp chlorine bleaching. Though, CwoEH bleaching, has lower water consumtion and hence, better economy, as compared to CwwEH. The sequence of splitting of chemical dose change requires small capital investment in the form an additional C stage tower, pump and chlorine mixer. Reduced concentration of chlorophenolics in the bleach plant effluents is desirable to check the harmful effect of such hazardous chemicals which have been found to be resistant to biodegradation and accumulate in body and likely to cause danger diseases.
References
- Richardson, S.D.; Annual of Chemistry 2007, 79, 4295-4324.
CrossRef - Qadir, A.; Mailk, R.N.; and Husain, S.N.; Environ. Monitor. Assessment 2008,140, 43-59.
CrossRef - Szolosi, O.; Journal of the Australian Water Association, 2003, 30, 34-36.
- Savant, D.V.R.; Rahman, A.; Ranade, D.R.; Biores. Technol., 2006, 97, 1092.
CrossRef - Karrasch B.; Parra O.; Cid, H.; Mehrens, H.; Pacheco, M.; Urrutia, P.; Valdovinos, R.; Zaror, C.; Sci. Total Environ 2006, 359,194.
CrossRef - Pekka, N.; Pekka, K.; Harri, A.; Jaakko Poyry Consulting, Finland, 2002,9, 66.
- Ibarra, D.; Jose, C.; Gutiérrez, A.; Rodríguez, I.M.; Romero, J.; Martínez, M.J.; Martínez, A.T.; Journal of Analytical Applied Pyrolysis, 2005,74,116-122.
CrossRef - Dutt , D.; Tyagi C.H.; Journal of Scientific and Industrial Research, 2010, 69, 460-467.
- Lindberg, L.; Tuomi, A.; PPI Pulp and Paper International, 2009, 51, 23-28.
- Panwar,S.; Gupta, M.K.; Mishra, S.; Interaction meet on environmental impact of toxic substances released in pulp & paper industry, Proceedings, 2002, 69-73.
- Singh, S.;.Dutt, D.; Tyagi, C.H.; Upadhyaya, J.S; New Biotechnolgy, 2011, 28, 47-57.
CrossRef - Malhotra,R.; Prakash, D.; Shukla, S.K.; Kim, T.; Kumar, S.; Rao, N.J.; Clean Technologies and Environmental Policy, 2013, 15, 999-1011
CrossRef - Hise. R.G.; TAPPI Pulping Conference, 1989, 75, 121-126.
- Hise, R.G.; Streisel. R.C.; Bills, A.M.; TAPPI Pulping Conference, 1992, 57-62.
- Prakash, D..; Kumar, S.; Oct. Jour. Env. Res., 2014, 2, 239-246.
- Hedjazi, S.; Kordsachia, O.; Rudolf, P.; Latibarid, A.J.; Tschirnere, U.;Industrial Crops Production, 2009, 29, 27-36.
CrossRef - Zhang, H; He, Z; Yonghao, N.; Bioresour Technology, 2011, 102, 2829-2833.
CrossRef - Rencoret, J.; Marques, G.; Gutiérrez,A.; Nieto, L.;Jiménez, J; Martínez, A.T.; DelRío,J.C.; Ind. Crops Prod.,, 2009, 30,137-142.
CrossRef - Jahan, M.S.; Maruf, A.A.; Quaiyyum, M.A.I.; J Sci Ind Res., 2007, 42, 425-434.
- Jahan, M.S.; Kanna, G.H.; Mun. S.P.; Chowdhury, D.; Industrial Crops and Products, 2008, 28, 199-205.
CrossRef - Prakash D., Kumar S., Innovative Research in Chemistry, 2013, 1, 14 -21.
- TAPPI Test methods, standards methods for pulp & paper. TAPPI Press, Atlanta. 2000–2001.
- 23. APHA/AWWA; ‘Standard methods for the examination of water and wastewater.’ 21st edn (American Public Health Association and American Water Works Association: Washington, DC), 2005.
- Lindstom, K.; Nordin, J., J. Chromatogr, 1976, 128, 13-26.

This work is licensed under a Creative Commons Attribution 4.0 International License.
![]()
A New Edition of Web of Science
Journal Impact Factor
2022: 0.5
Five Year: 0.8
Journal is Indexed in

Cabells Whitelist
![]()


