Correlation of Ionic Imprinting Cavity Sites on the Amino-Silica Hybrid Adsorbent with Adsorption Rate and Capacity of Cd2+ Ion in Solution
Buhani, Dian Herasari, Suharso and Suripto Dwi Yuwono
Department of Chemistry, Faculty of Mathematic and Natural Sciences, University of Lampung, Indonesia.
Corresponding Author E-mail: buhani_s@yahoo.co.id
DOI : http://dx.doi.org/10.13005/ojc/330149
In this research, it has been evaluated concentration effect of Cd2+ ion used as the Cd2+ ionic imprinted on synthesis of the Cd2+ ionic imprinted amino-silica hybrid (Cd(II)-IIP) adsorbent to adsorption rate and capacity of the target ion (Cd2+) in solution. The results of the ionic imprinting (as active sites of Cd2+ ion) obtained were prepared from different concentrations of the Cd2+ ion producing the different ionic imprinted cavity fraction. The concentrations of Cd2+ ion used as the ionic imprinting were 0.05, 0.10, and 0.15 mol L−1 resulting the ionic imprinted cavity fraction for each 97.89 (Cd(II)-IIPa), 98.49 (Cd(II)-IIPb), and 95.82 % (Cd(II)-IIPc), respectively. From the adsorption data obtained, they show that initial concentration differences of the imprinted Cd2+ ion produce different adsorption models of the Cd2+ ion. The bigger the Cd2+ ionic imprinting fraction, the higher the adsorption rate (k1) and capacity (q) of Cd2+ ion on the adsorbent.
KEYWORDS:imprinted ionic; adsorption; amino-silica hybrid; adsorption active site.
Download this article as:| Copy the following to cite this article: Buhani B, Herasari D, Suharso S, Yuwono S. D. Correlation of Ionic Imprinting Cavity Sites on the Amino-Silica Hybrid Adsorbent with Adsorption Rate and Capacity of Cd2+ Ion in Solution. Orient J Chem 2017;33(1). |
| Copy the following to cite this URL: Buhani B, Herasari D, Suharso S, Yuwono S. D. Correlation of Ionic Imprinting Cavity Sites on the Amino-Silica Hybrid Adsorbent with Adsorption Rate and Capacity of Cd2+ Ion in Solution. Orient J Chem 2017;33(1). Available from: http://www.orientjchem.org/?p=30359 |
Introduction
Increasing of heavy metal using in a life activity has given the negative impact as environmental pollution derived from an industrial processing or heavy metal using at an environment1-3. Cd is one of heavy metals much more used in industry such as; gold coating industry, battery, rubber, and pigment used in ink, paint, as well as plastic4. The Cd metal is also exist naturally and also found in food although in small amount adsorbed by intestines 5-8 %. Cd is not biodegradable and it can be accumulated in human or animal body for a long time. The long-term exposure is associated with a renal dysfunction, obstructive lung diseases such as lung cancer. Cd may also produce bone defects (osteomalacia and osteoporosis) in humans and animals5.
In recent years, an adsorbent synthesis to bind heavy metals runs continuously to reduce theirs concentration and spreading in an environment especially in water6-8. Success of heavy metal adsorption process depends on the adsorbent types used. Selection of the adsorbents will determine selectivity parameters and adsorption capacity to heavy metals. Criteria of good adsorbent to be improved is not soluble in water and organic solvent, having big specific surface area, high adsorption capacity and selectivity to metals which will be separated, and reusability for continuous extraction9,10.
Ability of the adsorbent to bind heavy metals is very affected by active site availability on adsorbent. Several researches were performed to increase a number of active sites through adsorbent modification with adding specific functional groups11,12. In addition, it was performed increasing of the adsorbent active site selectivity to target metal ion via an ionic imprinting technique13-18.
The ionic imprinted material synthesis technique is a potential technique to produce a selective material to metal ions. In the ionic imprinting technique, adsorption selectivity of metal ions can be produced because existence of metal ions plays a role as a template and a monomer containing functional groups in a polymer synthesis. Releasing of metal ions as template from a polymer matrix will cause a formation of ionic imprinted cavities and an arrangement on the ionic imprinted material which will bind target ion selectively19-21. In addition, the ionic imprinted material is relatively cheap and it can be stored at room temperature for a long time.
Effect of the active sites from modification result with addition of functional groups and ionic imprinting process to improve selectivity on adsorbent in adsorbing metal ion (adsorbate) can be known through evaluation of kinetic parameter and adsorption isotherm of metal ion with adsorbent22-24. In this paper, it was studied the effect of the active sites as the amino-silica hybrid ionic imprinted fraction on adsorption rate and adsorption capacity of Cd(II) ion from solution because equilibrium provide fundamental physicochemical data for evaluating the applicability of sorption processes as unit operation25. Chemical equilibrium is described by isotherm equation expressing surface characteristic and adsorbent active site affinity at certain temperature and pH. The adsorbent containing different number and active site type will have a different adsorption characteristics.
The effect of ionic imprinted cavity fraction formed as the active sites on adsorption characteristic was studied with interacting the adsorbent containing different ionic imprinted (template) concentrations to Cd2+ ion in solution. The interaction was evaluated with a kinetic model and an adsorption isotherm to determine the adsorption rate, adsorption isotherm model, and adsorption capacity value. Besides that, in the solution effect of pH is very important because the existence of H+ ions which is big enough will competitive with metal ions to place the active sites on adsorbent which will influence the ability of metal ion adsorbed 26. In this paper also, it was studied the adsorption model of metal ions on the ionic imprinted material with H+ ion concentration variety to the active sites availability to bind the Cd2+ ions from solution.
Materials and Methods
Materials and equipments
Reagent used in this work consisted of 3-aminopropyl-trimetoxyslane (APS), from Aldrich, TEOS, CdCl2·H2O, Na2EDTA, CH3COOH, ethanol, CH3COONa, and filter paper Whatman 42 from E-Merck, as well as HCl and NaOH from Alba. Apparatus used besides standard glass, it was also used supporting and analysis apparatus. The supporting apparatus consists of analytical balance (Mettler AE 160), sieve (200 mesh), and oven (Fisher Scientific), magnetic stirrer, centrifuge (OSK 6474B Centrifuge), and pH meter (Orion 4 Star). Analysis instrumentation performed in this research consisted of an atomic adsorption spectrophotometer (AAS) (Perkin Elmer 3110) applied to calculate the metal concentration and IR spectrophotometer (Prestige 21 Shimadzu) used to analyze the functional groups. Identification of surface morphology and element composition were performed with using a SEM-EDX (JSM 6360 LA). Identification of the material surface area was applied by surface area analyzer (Quantachrome Nova 1200e).
Adsorbent Preparation
In Cd(II)-IIP synthesis, the synthesis used APS compound, solution interacted was made into 2 parts consisting of A solution containing mixture of TEOS and water, 10 mL, filled into the plastic container and added HCl 1 M up to pH 2. Then, it was stirred by a magnetic stirrer for 30 min. Solution of B contains 5 mL of Cd2+ solutions in ethanol with each 0.05, 0.10, and 0.15 mol L−1 to produce adsorbents of Cd(II)-IIPa, Cd(II)-IIPb, and Cd(II)-IIPc, respectively. Then, it was added each with 1 mL of APS stirred until to be homogeneous. The solution A and B were mixed with stirring using a magnetic stirrer for 30 min. Gel formed was left for a night, it was rinsed with water/ethanol mixture 60/40 % continued with soaking for 24 h in Na2EDTA 0.1 M and stirred for 30 min in HCl 0.5 M. Then, the material obtained was neutralized by water up to pH ≈ 7, dried in oven for 6 h at temperature of 60 oC, and grounded until size of 200 meshes. For non-ionic imprinted adsorbent (NIP) was prepared without the Cd2+ ion27.
Batch Adsorption Experiments
Experiments were performed with interacting 50 mg of the adsorbent in a series of Erlenmeyer flasks containing Cd2+ ion solution with concentrations of 0.0–250.0 mg L−1. The adsorption was carried out in a batch system using a stirrer at optimum pH of 6 for 2 h and at 27°C27. Then, the solution was centrifuged and the filtrate was taken to analyze the metal concentration left in the solution with AAS.
Influence of H+ ion concentration was studied with interacting 50 mg of the adsorbent with Cd2+ ions for 24 h at the H+ ion concentrations for each 0.5, 1.0, 1.5, 2.5, and 5.0 mmol L−1. Then, the solution was also centrifuged and the filtrate was taken to calculate the metal concentration left in the solution with AAS.
The amount of Cd(II) ion adsorbed q (mg g−1) by NIP and Cd(II)−IIP adsorbent was calculated using Equation 1:
![]()
where ci and cf are initial and final concentration of the Cd2+ ion in solution, v is solution volume (L), and m is adsorbent mass (g).
To investigate the adsorption process optimization, it was performed correlation approach between the Cd2+ ion amount adsorbed experimentally with a batch method and the Cd2+ ion amount adsorbed estimatically via the adsorption isotherm equations using Langmuir, Freundlich, Dubinin-Radushkevich, and Temkin model. The isotherm model parameters were evaluated to determine the root mean squared error (RMSE) and Chi-square test (χ2)16,22 with these equations below:
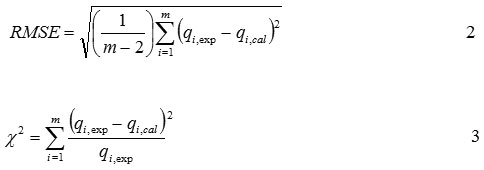
where qi,exp and qi,cal are obtained from the experiment result and estimation result via the adsorption isotherm equation, m is the number of observation in the experimental isotherm. A smaller RMSE value indicates a better curve fitting, moreover, if the data obtained from the model are close to the experimental results, χ2 will be a small number22,28.
Results and Discussion
Synthesis and Characterization of Material
The effect of the Cd2+ ion concentration used as a template on synthesis of Cd(II)-IIP material from the amino-silica hybrid was studied with using the initial concentration for Cd(II)-IIPa, Cd(II)-IIPb, and Cd(II)-IIPc of each 0.05, 0.10, and 0.15 mol L−1 resulting the ionic imprinted cavity fraction for each 97.89 (Cd(II)-IIPa), 98.49 (Cd(II)-IIPb), and 95.82 % (Cd(II)-IIPc).
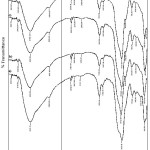 |
Figure 1: Infrared spectra of (a) NIP, (b) Cd(II)-IIPa, (c) Cd(II)-IIPb, and (d) Cd(II)-IIPc |
In order to identify the active sites playing a role to the Cd2+ ion adsorption, identification of functional groups, surface morphology, element compositions, surface area, volume, and porous diameter of the adsorbent were investigated in this experiment. IR spectra resulted on analysis of adsorbents, Cd(II)-IIPa, Cd(II)-IIPb, and Cd(II)-IIPc, if they were compared with NIP, they do not show difference significantly (Fig. 1). These indicate that the NIP ionic imprinting process to be Cd(II)-IIP does not change the functional group type on Cd(II)-IIP. From Fig. 1, it can be seen that on Cd(II)-IIP and NIP show relatively similar IR band appearing new band at 2939,52 cm−1 indicating stretching vibration of CH2 group and at 1640-1560 cm−1 indicating bend vibrations of primer amine (N-H) 9,29.
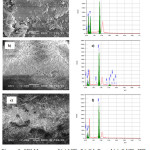 |
Figure 2: SEM Images of (a) NIP, (b) Cd-P, and (c) Cd(II)-IIPb as well as EDX spectra of (d) NIP, (e) Cd-P, and (f) Cd(II)-IIPb |
Fig. 2 shows that the surface morphology of Cd-P (Cd with the amino-silica hybrid) (Fig. 2(b)) appears to be brighter than the surface morphology of NIP (Fig. 2(a)) and Cd(II)-IIPb (Fig. 2(c)). This is caused on the Cd-P existed Cd atom producing brighter color (higher accelerating) resulted by Cd atom having high atomic number on the material of Cd-P.
From the surface morphology of NIP, CdP, and Cd(II)-IIPb material (Fig. 2(a-c)) supported by the EDX spectra of NIP (Fig. 2(d)) exists only silica, carbon, nitrogen, and oxygen. But, in Fig. 2(e) for CdP, besides the elements (silica, carbon, nitrogen, and oxygen), Cd is found as a template in the ionic imprinted synthesis. The Cd(II) ions were released to produce the ionic imprinted cavity as seen in the EDX spectra from Cd(II)-IIPb (Fig. 2(f)).
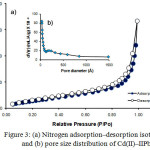 |
Figure 3: (a) Nitrogen adsorption-desorption isotherms and (b) pore size distribution of Cd(II)-IIPb |
In Fig. 3, it can be observed that nitrogen adsorption-desorption isotherm model and graph of relationship between pore volume and pore diameter resulted from measurement of Cd(II)-IIP isotherm tend to follow adsorption isotherm combination of type I and IV based on Brunnauer classification. The adsorption isotherm model of type I occurs in the area of low P/Po, this case can be seen from the isotherm form that tends to be horizontal. The isotherm model of type I forms only one layer of adsorbate and it occurs on chemisorption process. While, the isotherm model of type IV occurs in the area of higher P/Po indicated with the adsorption pattern increase that designating adsorption on porous material. This fact is also supported with pore diameter size of 30.45 Å with specific surface area of 29.01 m2 g-1 and total pore volume of 0.29 mL g-1. From the characterization result of the surface characteristic of Cd(II)-IIP material shows that the material is mesoporous. In addition, it can be stated that the active sites of Cd(II)-IIP material are not only determined by active group modification on silica (amino (-NH), silanol (-Si-OH), and siloxane (-Si-O-Si-)), but also determined by the material surface characteristic produced during the ionic imprinting process takes place.
Effect of H+ Ion Concentration on Adsorption Process
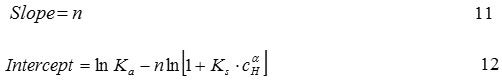
Adsorption of Cd2+ ion on non-imprinted ionic (NIP), Cd(II)-IIPa, Cd(II)-IIPb, and Cd(II)-IIPc in solution media with various concentrations of H+ ions can be seen in Fig. 4. In Fig. 4, it can be observed that each material of NIP, Cd(II)-IIPa, Cd(II)-IIPb, and Cd(II)-IIPc with the different ionic imprinted fraction shows a similar adsorption model relatively, the higher concentration of H+ ion the lower amount of Cd2+ ion adsorbed (q). These facts indicate that with increasing of H+ ion, the adsorption ability of the Cd(II)-IIP material from the amino-silica hybrid to Cd2+ ion will decrease. In this case, H+ ion competes with Cd2+ ion to place the active sites on the adsorbent.
With using SAS model developed by Su et al.26, adsorption competition of H+ and Cd2+ ions to Cd(II)-IIP material are known according to a theoretical study proposed with an isotherm equilibrium equation of (Mn+) metal ion as follows:
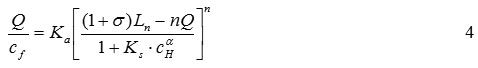
For Eq. (4), the Cd2+ concentration (Cf) in the dilute solution approaches zero, and therefore Q approaches zero. As a result, the isotherm reduces to
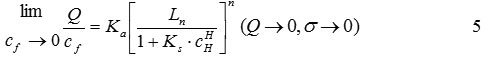
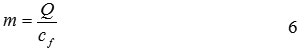
Eq. (5) is used to determine the model parameters Ka, Ks, n, and a. For a dilute Cd2+solution, the partition coefficient, m of Cd2+between adsorbent and solution phases at equilibrium is defined as
In this case, Langmuir isotherm was used as experiment data approach because Langmuir equation can establish the adsorption of metal ion dissolved.
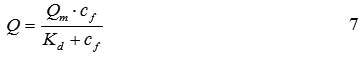
when Cf is close to zero, partition coefficient m from Cd2+ will be the same with the slope from the adsorption isotherm, namely:
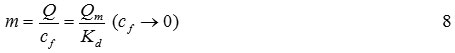
Thus, the partition coefficient can be estimated from the Eq. (8). Substituting Eq. (8) into Eq. (5) and rearranging yields the following equation:
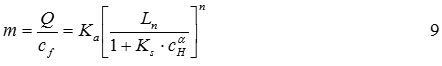
Assuming that the linear model parameters, Ka, KS, n and a are independent of the surface active site concentration on the adsorbent surface, the values of these parameters can be obtained by taking the logarithm of both sides of Eq. (9)
![]()
This plot of ln(m) versus ln(Ln) should yield a straight line with the following properties:
where, CH is the concentration of H+ ions in solution (mmol L-1), a is an amount of H+ bindingsite characteristic, Cf is the concentration of Cd2+ ion in solution (mmol L-1), Ci is the initial concentration of Cd2+ ion in solution (mmol L-1), Ka is the equilibrium constants of Cd2+, Kd is the dissociation constants of Langmuir equation (mmol L-1), Ks is the equilibrium constants of H+, La is the concentration of adsorption active site that is not occupied (empty) on adsorbent surface (mmol g-1 adsorbent), Ln is the total amount of the concentration of active site ionic imprinted on adsorbent surface that is the amount of concentration Cd2+ ion used in ionic imprinting process (mmol g-1 adsorbent), m is the partition coefficient between Cd2+ ion and solution, n is the amount of binding site characteristic for Cd2+, Q is the concentration of Cd2+ adsorbed by adsorbent (mmol g-1 adsorbent), Qm is the adsorption capacity in Langmuir adsorption isotherm equation (mmol g-1 adsorbent), σ is non-imprinted factor26.
If the data of Fig. 4 were plotted using Eq. 10, then it can be produced Fig. 5 showing the relationship between Ln and m to determine the value of n displayed in Table 1. From Fig. 5, it can be observed that generally plot of logarithm from partition coefficient resulted from the Langmuir adsorption isotherm equation, ln(m) versus ln(Ln) produced straight line for each concentration variation of H+ with the slope n that is nearly similar of 0.5 which means that one active site binds to two Cd2+ions.
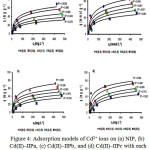 |
Figure 4: Adsorption models of Cd2+ ions on (a) NIP, (b) Cd(II)-IIPa, (c) Cd(II)-IIPb, and (d) Cd(II)-IIPc with each H+ ion concentration solution media of 0.5, 1.0, 1.5, 2.5, and 5.0 mmol L-1 |
Table 1: Results of plot ln (m) vs ln (Ln) on Cd(II)-IIP at the H+ ion concentrations of 0.5, 1.0, 1.5, 2.5, and 5.0 mmol L-1
|
H+ (mmol L–1) |
0.50 |
1.00 |
1.50 |
2.50 |
5.00 |
|
R2 |
0.99 |
0.97 |
0.93 |
0.91 |
0.96 |
|
n |
0.48 |
0.49 |
0.51 |
0.49 |
0.47 |
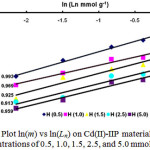 |
Figure 5: Plot ln(m) vs ln(Ln) on Cd(II)-IIP material at H+ion concentrations of 0.5, 1.0, 1.5, 2.5, and 5.0 mmol L-1 |
Adsorption Kinetics
In order to know Cd2+ ion adsorption kinetic model on NIP and Cd(II)−IIP, adsorption data were evaluated with using pseudo-first-order (Eq. (13)) and pseudo-second-order (Eq. (14)) kinetic model as follow23,30:
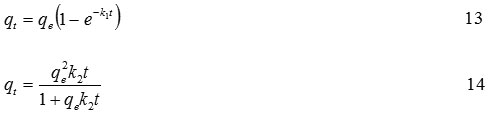
where qt and qe (mg g-1) are total Cd2+ ions adsorption capacity at time t and at equilibrium, respectively, k1 and k2 are the first order and second order rate constants, respectively.
Analysis results of kinetic models are displayed in Fig. 6(a) for the pseudo-first-order kinetic model and Fig. 6(b) for the pseudo second-order kinetic model. Table 2 shows total Cd2+ ions adsorption rate constants (k1and k2) and correlation coefficients calculated using linearized plots of Eqs. (13) and (14), respectively. In addition, RMSE and χ2 (Eqs. (2) and (3)) were determined to know Cd2+ ions adsorption kinetic model tendency on NIP and Cd(II)-IIP with the different ionic imprinted cavity fractions.
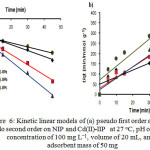 |
Figure 6: Kinetic linear models of (a) pseudo first order and (b) pseudo second order on NIP and Cd(II)-IIP at 27oC, pH of 6, Cd(II) concentration of 100 mg L−1, volume of 20 mL, and adsorbent mass of 50 mg
|
In Table 2 can be seen that Cd2+ ion adsorption process on NIP and Cd(II)-IIP tends to follow the pseudo-first-order kinetic model stated with average linear regression coefficient value (R2) 0.99. This tendency is also supported by RMSE and χ2 smaller than the pseudo second-order kinetic model showing that the data obtained from estimation result using the pseudo-first-order kinetic model having value closing with the experiment results. In generally, in Table 2 was observed that k1 of Cd2+ ion on the Cd(II)-IIPb adsorbent was relatively higher than the Cd(II)-IIPa and the Cd(II)-IIPc.
Table 2: Comparison between the pseudo-first-order and the pseudo second-order Cd2+ ion adsorption kinetic model on NIP, Cd(II)−IIPa, Cd(II)−IIPb, and Cd(II)−IIPc
|
Adsorbents |
||||
| NIP | Cd(II)−IIPa | Cd(II)−IIPb | Cd(II)−IIPc | |
| qe (mg g–1) |
23.094 |
20.697 |
20.253 |
25.178 |
| Kinetic models | ||||
| Pseudo-first-order | ||||
| k1 (min–1) |
0.041 |
0.073 |
0.094 |
0.028 |
| qe cal (mg g–1) |
23.469 |
20.817 |
20.291 |
25.155 |
| R2 |
0.992 |
0.996 |
0.997 |
0.991 |
| RMSE |
0.025 |
0.010 |
0.011 |
0.015 |
| Χ2 |
0.009 |
0.001 |
0.002 |
0.003 |
| Pseudo-second-order | ||||
| k2 (g mg–1 min–1) |
27.808 |
84.823 |
130.114 |
70.031 |
| qe cal (mg–1 g–1) |
11.814 |
16.400 |
17.757 |
11.419 |
| R2 |
0.749 |
0.949 |
0.958 |
0.876 |
| RMSE |
0.289 |
0.198 |
0.160 |
0.280 |
| Χ2 |
0.849 |
0.440 |
0.301 |
0.817 |
Adsorption isotherm
The effect of initial concentration of Cd2+ ion solution on NIP and Cd(II)-IIP to investigate tendency of the adsorption isotherm model can be seen in Fig. 7. Fig. 7 displays the Cd2+ ion adsorption isotherm model on NIP and Cd(II)−IIP with initial various concentrations showing that the Cd2+ ion adsorption increased constantly with increasing of metal ion concentration and at relatively higher concentration, increasing of metal ion concentration did not anymore followed with increasing of Cd2+ ion adsorption on the adsorbent significantly. The adsorption isotherm models applied to evaluate adsorption process running were Langmuir (Eq. (15)), Freundlich (Eq. (16)), Dubinin-Raduskevich (Eqs. (17) and (18)), as well as Temkin (Eq. (19)) adsorption isotherm31,32.
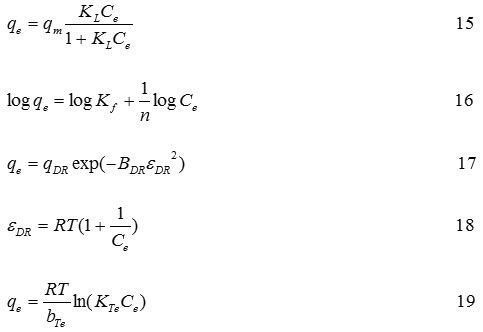
where, qm is the maximum metal ion amount adsorbed (mg g−1), Ce is the metal ion equilibrium concentration (mL g−1), n is the Freundlich exponent, KL (L mol−1) and KF (mg g−1) is each the Langmuir and Freundlich constant. The εDR, the Polanyi potential, is a constant related to the adsorption energy, qDR and BDR are the D−R isotherm constants in mg g−1 and mol2 kJ−2 respectively, bTe is the Temkin constant related to the heat adsorption (J mol−1), KTe is the equilibrium binding constant L g−1, R is the gas constant (8.314 kJ mol−1), and T is the absolute temperature (K).
Parameters of Cd2+ ion adsorption isotherm on NIP and Cd(II)-IIP from isotherm equations of Langmuir, Freundlich, Dubinin-Radushkevich, and Temkin (Table 3) show that generally, Cd2+ ion adsorption data follow adsorption isotherm model of Langmuir with average of R2 around 0.99 supported by lower RMSE and χ2. These facts give an indication that Cd2+ ion adsorption on NIP and Cd(II)-IIP characterized as monolayer.
In Table 3, it can be seen that increasing of adsorption capacity occurred on Cd(II)-IIP higher than NIP. Surface of Cd(II)-IIP material was to be more selective and specific upon metal ion used as a template. The existence of appropriate acid and base character between Cd2+ ion and N atom as donor in complex formation in synthesis of ionic imprinted material will produce a selective material to the target metal because the interaction of metal ions and the material runs to be stronger and also to be more selective.
Adsorption capacity of Cd2+ ion on Cd(II)-IIPb material is relatively bigger than Cd(II)-IIPa and Cd(II)-IIPc material (Table 3), these results are accordance with the results obtained on determination of the adsorption kinetic model pseudo second order. Evaluation result of the adsorption isotherm shows that difference of template metal ion concentrations (ionic imprinted cavity fraction) will give effect on the metal ion adsorption isotherm model adsorbed.
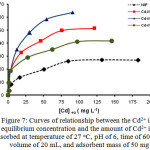 |
Figure 7: Curves of relationship between the Cd2+ ion equilibrium concentration and the amount of Cd2+ ion adsorbed at temperature of 27°C, pH of 6, time of 60 min, volume of 20 mL, and adsorbent mass of 50 mg |
If the data of Cd2+ ion adsorption capacity on the Cd(II)-IIP material (Table 3) were compared with other research results about the Cd2+ ionic imprinted material as the material of dual-ligand reagent (2Z)-N,N’-bis(2-aminoethylic)but-2-enediamide-Cd2+ with the batch method adsorption resulting adsorption capacity of 32.56 mg g-1 33. Adsorption of Cd2+ ion with the continue method using phenol-formaldehyde-Cd(II)-2- (p-sulphophenylazo-1,8-dehyroxynapthalene,3,6-disulphonate and polymer Cd(II)-2,2-{thane-1,2-diylbis[nitrilo (E) methyl]}lidene diphenolate-4-vinyl pyridine produced the adsorption capacity of 0.27 and 0.48 mg g−1, respectively34,35. From the research result, it can be known that the adsorption capacity of Cd2+ ion on Cd(II)-IIP is relatively the highest among the other materials in adsorbing the target metal ion.
Table 3: Adsorption parameters of Cd2+ ions on NIP and Cd(II)-IIP with Langmuir, Freundlich, Dubinin-Raduskevich, and Temkin Equations (pH of 6 and temperature of 27°C)
|
Adsorbents |
||||
| NIP | Cd(II)-IIPa | Cd(II)-IIPb | Cd(II)-IIPc | |
| Adsorption isotherms | ||||
| Langmuir | ||||
| qm (mg g–1) | 28.823 |
54.304 |
62.105 |
43.402 |
| KL x 103(L mol–1) |
8.644 |
13.076 |
15.863 |
14.254 |
| R2 |
0.990 |
0.990 |
0.991 |
0.990 |
| RMSE |
2.311 |
3.478 |
3.266 |
4.377 |
| χ2 |
1.683 |
3.427 |
2.412 |
7.327 |
| Freundlich | ||||
| Kf (mg g–1) |
3.270 |
6.445 |
7.138 |
6.831 |
| n |
2.263 |
2.072 |
1.955 |
2.527 |
| R2 |
0.930 |
0.874 |
0.935 |
0.794 |
| RMSE |
3.283 |
7.836 |
10.093 |
5.463 |
| χ2 |
2.944 |
10.778 | 11.765 | 10.724 |
| Dubinin-Raduskevich | ||||
| qDR (mg g−1) | 26.396 | 54.315 | 59.472 | 41.157 |
| BDR x 10−3 (mol2 kJ-2) |
2.104 |
1.815 |
1.659 |
1.495 |
| R2 |
0.976 |
0.953 |
0.992 |
0.827 |
| RMSE |
2.302 |
3.563 |
3.332 |
3.985 |
| χ2 |
1.466 |
3.183 |
1.281 |
7.559 |
| Temkin | ||||
| bTe (J mol−1) |
2.206 |
3.987 |
4.496 |
2.884 |
| aTe (L g−1) |
1.023 |
1.086 |
1.114 |
1.048 |
| R2 |
0.975 |
0.993 |
0.972 |
0.963 |
| RMSE |
1.691 |
1.822 |
4.058 |
3.232 |
| χ2 |
7.170 |
1.138 |
7.170 |
9.242 |
Conclusions
From the evaluation results of the adsorption kinetic and adsorption isotherm parameters show that the values of the adsorption rate and capacity of ionic imprinted materials on Cd(II)-IIPa, Cd(II)-IIPb, Cd(II)-IIPc are bigger than NIP. The Cd2+ ionic imprinting cavity fraction played a role as active sites prepared from different concentrations of Cd2+ ion produces different adsorption rate and capacity with ion target (Cd2+ ion). Adsorption competition of Cd2+ and H+ ion to active sites is influential to number of Cd2+ ion adsorbed on NIP and Cd(II)-IIP. The higher the concentration of H+ ions, the lower the number of Cd2+ ions adsorbed. The Cd2+ ionic imprinted material from amino-silica hybrid can be used as effective material to bind Cd2+ ions in solution.
Acknowledgements
The authors would like to thank the Directorate of Research and Community Services, Directorate General of Higher Education (DIKTI), Ministry of Research, Technology and Higher Education of the Republic of Indonesia (Kemenristekdikti) for funding this research through Fundamental Research Grant with contract number: 040/SP2H/LT/DRPM/II/2016.
References
- Hajiaghababaei, L.; Badiei, A.; Ganjali, M.R.; Heydari, S.; Khaniani, Y.; Ziarani, G.M. Desalination. 2011, 266, 182-187.
CrossRef - Suharso; Buhani. Asian J. Chem. 2011, 23(3), 1112-1116.
- Buhani; Suharso; Sembiring, Z. Orient. J. Chem. 2012, 28(1), 271-278.
- Newton, D.E. Chemistry of the Environment, Fact on File, an Imprint of Infobase Publishing, New York, 2007.
- National Library of medicine, Hazardous Substance Data Bank (HSDB), 1996.
- Buhani; Suharso; Fitriyani, A.Y. Asian J. Chem. 2013, 25(5), 2875-2880.
- Buhani; Suharso; Sumadi. Asian J. Chem. 2012, 24(1), 133-140.
- Buhani; Suharso. Asian J. Chem. 2009, 21(5), 3799-3808.
- Buhani; Narsito; Nuryono; Kunarti, E.S.; Suharso. Desalin. Water Treat. 2015, 55, 1240-1252.
- Buhani; Suharso; Aprilia, L. Indo. J. Chem. 2012, 12(1), 94-99.
- Alcantara, E.F.C.; Faria, E.A.; Rodrigues, D.V.; Evangelista, S.M.; DeOliveira, E.; Zara, L.F.; Rabelo, D.; Prado, A.G.S. J. Colloid Interf. Sci. 2007, 311, 1-7.
CrossRef - Cui, Y.; Chang, X.; Zhu, X.; Luo, H.; Hu, Z.; Zou, X.; He, Q. Microchem. J. 2007, 8, 20-26.
CrossRef - Chang, X.; Wang, X.; Jiang, N.; He, Q.; Zhai, Y.; Zhu, X.; Hu, Z.; Microchim. Acta. 2008, 162, 113-119.
CrossRef - He, Q.; Chang, X.; Zheng, H.; Jiang, N.; Wang, X.; Intern. J. Environ. Anal. Chem. 2008, 88(6), 373-384.
CrossRef - Zhang, N.; Suleiman, J.B.; He, M.; Hu, B. Talanta. 2008, 75, 536-543.
CrossRef - Chen, N.; Zhang, Z.; Feng, C.; Li, M.; Zhu, D.; Sugiura, N. Mater. Chem. Phys. 2011, 125, 293-298.
CrossRef - Liu, H.; Yang, F.; Zheng, Y.; Kang, J.; Qu, J.; Chen, P. Water Res. 2011, 45, 145-154.
CrossRef - Arbab-Zavar, M.H.; Chamsaz, M.; Zohuri, G.; Darroudi, A. J. Hazard. Mater. 2011, 185, 38-43.
CrossRef - Li, F.; Jiang, H.; Zhang, S. Talanta. 2007, 71, 1487-1493.
CrossRef - Zhao, J.; Han, B.; Zhang, Y.; Wang, D. Anal. Chim. Acta. 2007, 603, 87-92.
CrossRef - Zhai, Y.; Liu, Y.; Chang, X.; Ruan, X.; Liu, J. React. & Funct. Polymers. 2008, 68, 284-291.
CrossRef - Montazer-Rahmati, M.M.; Rabbani, P.; Abdolali, A.; Keshtkar, A.R.; J. Hazard. Mater. 2011, 185, 401-407.
CrossRef - Bermúdez, Y.G.; Rico, I.L.R.; Bermúdez, O.G.; Guibal, E. Chem. Eng. J. 2011, 166, 122-131.
CrossRef - Zakhama, S.; Dhaouadi, H.; M`Henni, F.; Biores. Technol. 2011, 102, 786-796.
CrossRef - Ho, Y.S.; Porter, J.F.; McKay, G. Water Air Soil Pollut. 2002, 141, 1-33.
CrossRef - Su, H.; Chen, S.; Tan, T. Process Biochem. 2007, 42, 612-619.
CrossRef - Buhani; Narsito; Nuryono; Kunarti, E.S. Desalination. 2010, 251, 83-89.
- Vijayaraghavan, K.; Padmesh, T.V.N.; Palanivelu, K.; Velan, M. J. Hazard. Mater. 2006, B 133, 304-308.
- Machado, R.S.A.; da Fonseca, M.G.; Arakaki, L.N.H.; Espinola, J.G.P.; Oliveira, S.F. Talanta. 2004, 63, 317-322.
CrossRef - Patel, R.; Suresh, S. Biores. Technol. 2008, 99, 51-58.
CrossRef - Ho, Y.S.; Porter, J.F.; McKay, G. Water Air Soil Pollut. 2002, 141, 1-33.
CrossRef - Perić, J.; Trgo, M.; Medvidović, N.V. Water Res. 2004, 38, 1893-1899.
CrossRef - Zhai, Y.; Liu, Y.; Chang, X.; Chen, S.; Huang, X. Anal. Chim. Acta. 2007, 593, 123-128.
CrossRef - Candan, N.; Tüzmen, N.; Andac, M.; Andac, C.A.; Say, R.; Denizli, A. Mater. Sci. Eng. 2009, C 29, 144-152.
- Gawin, M.; Konefal, J.; Trzewik, B.; Walas, S.; Tobiasz, A.; Mrowiec, H.; Witek, E. Talanta. 2010, 80, 1305-1310.
CrossRef

This work is licensed under a Creative Commons Attribution 4.0 International License.
![]()
A New Edition of Web of Science
Journal Impact Factor
2022: 0.5
Five Year: 0.8
Journal is Indexed in

Cabells Whitelist
![]()


