Reload Purified Melittin and Lactoferrin on Perfluorooctyl Bromide Nanoparticles (PFOB-Nps) and Examine the Distribution of Particle Size, Zeta Potential and Confirmation of Their Accession on the Nanoparticles Via Tryptophan Fluorescence and Circular Dichroism (CD) and its Anti-Cancer Effects on Human Breast Cancer Cell Line MCF7
Hadis Rahmani Incheh Keykanlu1, Saeid Zibaei *2, Mehdi Ardjmand3 and Ali Akbar Safekordi4
1Department of Chemical Engineering, Science and Research Branch, Islamic Azad University, Tehran, Iran.
2Razi Institute, Ministry of Jahad-e-Keshavarzi, Mashhad, Iran.
3Department of Chemical Engineering, South Tehran Branch, Islamic Azad University, Tehran, Iran.
4Department of Chemical Engineering, Sharif University of Technology, Tehran, Iran.
Corresponding Author E-mail: s.zibaee@mrazi.ac.ir
DOI : http://dx.doi.org/10.13005/ojc/320631
Acording to the prevalence of cancer in today's societies, it is too important to find new drugs for that treatment. Cationic antimicrobial peptides that are able to eliminate a wide range of bacteria, fungi, parasites, viruses and unicellular, are natural anti-cancer agents. In the present study, the effect of cationic peptides of bee venom Melittin (ML) and Lactoferrin (LF) of camel milk which was loaded on the Perfluorooctyl Bromide (PFOB) nanoparticles, were examined on MCF7 cells. Nanoparticles using oil in water emulsion was prepared by ultra-thoracic and ultrasonic. Then ML and LF were separately added to the nanoparticles then incorporation of them were confirmed by tryptophan fluorescence and circular dichroism (CD) spectra. The mean diameter of the nanoparticles did not change after addition of ML and LF (~100 nm), but as expected, the zeta potential of the nanoparticles with increasing of ML and LF concentrations to the preformed nanoparticles increased from -18.43(without ML and LF) to +21.61(LF 110.66µg/ml) and +20.93(ML 0.1µg/ml) and +23.75(LF 110.66µg/ml and ML 0.1µg/ml. By using of scanning electron microscopy (SEM), the morphology and structure of nanoparticles was investigated, homogeneity and uniformity during processing and loading of ML and LF was observed. Effectiveness of nanoparticles loaded on cancer cells was performed with MTT test. The results showed that ML and LF had a positive effect on cancer cell death. Percent of cell death was higher when ML and LF was loaded on nanoparticles. With increase of ML and LF concentration loading on nanoparticles, increases cancer cell death. Minitab software was used to analyze some data.
KEYWORDS:Bee venom; Camel milk; Melitiin; Lactoferrin; Perfluorooctyl Carbon; PerfluorooctylBromide; MCF7 cell Line
Download this article as:| Copy the following to cite this article: Keykanlu H. R. I, Zibaei S, Ardjmand M, Safekordi A. A. Reload purified Melittin and Lactoferrin on perfluorooctyl bromide nanoparticles (PFOB-NPs) and examine the distribution of particle size, zeta potential and confirmation of their accession on the nanoparticles via tryptophan fluorescence and circular dichroism (CD (and its anti-cancer effects on Human Breast Cancer Cell Line MCF7. Orient J Chem 2016;32(6). |
| Copy the following to cite this URL: Keykanlu H. R. I, Zibaei S, Ardjmand M, Safekordi A. A. Reload purified Melittin and Lactoferrin on perfluorooctyl bromide nanoparticles (PFOB-NPs) and examine the distribution of particle size, zeta potential and confirmation of their accession on the nanoparticles via tryptophan fluorescence and circular dichroism (CD (and its anti-cancer effects on Human Breast Cancer Cell Line MCF7. Orient J Chem 2016;32(6). Available from: http://www.orientjchem.org/?p=26419 |
Introduction
Despite great advances in cancer treatment, a significant tendency for new anticancer agents due to the increased resistance of cancer cells to anticancer drugs, is currently being expanded.
Cationic antimicrobial peptides can be divided into two categories based on their work: the first group consists of peptides that are toxic to microbes, cancer cells and healthy mammalian cells (non-selective), for example Melittin (ML) of existing peptides the bee venom, tachyplesin isolated from horseshoe crab. The second group consists of peptides that are much potent to microbes and cancer cells, but not healthy cells, for example, cecropin by insects, magainins isolated from the skin of frogs and LF. However, at higher concentrations of more peptides put toxic effect on normal cells because of their fundamental amphipathic property.[1-3]
ML and other cytolytic peptides are memorable candidate for cancer chemotherapy[4], for two reasons: (1) Cancer cells due to more negative charge on their surface than normal cells are less likely to develop resistance to pore through the membrane.(2) The combination of a chemotherapy drug (e.g., Doxorubicin, Adriamycin ) or selective cationic antimicrobial peptides which is not going to harm healthy cells along(e.g., LF) together with ML can have a synergistic effectiveness, resulting in a therapeutic dose required reduced. [5, 6]
ML is the principal active component of apitoxin (bee venom) and is a powerful stimulator of phospholipase A2. ML is a peptide consisting of 26 amino acids with the sequence GIGAVLKVLTTGLPALISWIKRKRQQ and it constitutes 50% of dry venom. Molecular weight of ML is 2.86 kD and has a net charge of +6 at physiological pH. The amphiphilic property of this peptide makes it water-soluble[7] ML is a very strong basic peptide and Its impact is extreme. ML connected to the hydrophobic membrane and in a matter of milliseconds, either perpendicular or parallel to the surface and cause hemolysis of red blood cells and thereby increase the permeability of their membranes.[8],[9]
Lactoferrin (LF) is a globular glycoprotein with a molecular weight about 80 kDa, this protein is composed of 703 aminoacid sit. That is one of the constituents of milk and the most important property is that the absorption and transport of iron. LF through chelating the iron ion unavailable to the invading pathogens. And thus inhibit the growth of harmful bacteria indirectly inhibits the spread of infection. Due to the wide distribution of LF in various tissues and the presence of Network of positive charges in it, this protein is a multi-functional protein. In some cases, basic amino acids of LF interactions with anionic molecules at specific levels of bacteria, virus, fungus and parasite and Cause lysis of cells. LF is able to stop the growth of cancer cells through the inhibition of cell proliferation by altering the expression or activity of regulatory proteins and also through the activation of natural killer cells and inhibits tumor growth through activation of apoptosis (programmed cell death).
In order to increase for drug therapeutic effect, must protected until reach to target site in the body and maintained its chemical and biological properties. Some drugs are highly toxic and can cause negative side effects and if they are destroyed during delivery, decreased efficacy. Particles that are not connected easily removed by the liver and spleen. [10, 11] Up to now several transportation system are used for ML and LF, that each with advantages and disadvantages. In this work, used a new drug delivery system for the treatment of cancer is known that the potential utility of cytolyic peptides.[5, 12]
perfluorocarbon nanoparticles used as drug carriers and molecular imaging. Since perfluorocarbon (PFCs) are biologically inert, chemically stable, nonbiodegradable, nontoxic and nonvolatile, that all these features can produce nanoemulsions are biocompatible. Specifically, perfluorooctyl bromide (PFOB) mostly used due to its low vapor pressure, evaporation and may be to reduce the production of pulmonary emphysema. [10]
Materials and methods
Materials
Bioactive Protein
Bee venom was prepared from Shiraz, Iran and stored at -20◦C. Camels milk was prepared from Torkaman Sahra, Iran and stored at -20˚C until needed. The bioactive LF (Purity: >85%) from bovine whey and the bioactive ML (Purity: >85%) from BV were purchased from Sigma-Aldrich (USA)
Chemicals and Biochemicals
Perfluorooctyl bromide (PFOB) 99%, carboxymethyl Sephadex C-50 resin, soybean phosphatidylcholine (Lecithin), dipalmitoyl-sn-glycero-3-phosphoethanolamine (DPPE, assay: >99%), MTT (3-(4, 5-Dimethylthiazol-2-yl)-2, 5-Diphenyltetrazolium Bromide) and RPMI-1640 Media were purchased from Sigma-Aldrich (USA).
Other chemicals and biochemicals including protein marker 26612 were purchased from Thermo Scientific (USA). HCl (37%) and NaCl, monosodium phosphate, sodium citrate, acrylamide, bisacrylamide, tris, TEMED, APS, sodium dodecyl sulfate (SDS), ethanol, tetramethylbenzidine, acetic acid, silver nitrate, Sodium thiosulfate, formaldehyde, sodium carbonate, sulfuric acid, hydrogen peroxide, dimethyl sulfoxide, citric acid, bovine serum albumin, C.Blue G250 were purchased from Merck (Germany).
Analytical Equipment
High-performance liquid chromatog-raphy (HPLC) system (Agilent, series 1200) and ion exchange chromatography column were used. . Cationic exchange chromatography column (10×3 cm) was used. All spectrophotometric readings were carried out using quartz cuvettes in an UV-VIS spectrophotometer, Shimadzu (Kyoto, Japan). Upper Speed Vacuum Centrifuge (Ultracentrifuge) model VS-30000i of VISION SCIENTIFIC CO. LTD was used. Micro-spin/ FUGE/ VOTEX KIAGEN (Molecular Biology Company), magnetic stirrer (yellow MAGHS7), pH meter of Metrohm Swiss (827 pH lab) were used. Eppen dorf centrifuge (5415D), Sodium dodecyl sulfate1 polyacrylamide gel electrophoresis (SDS-PAGE) of Sigma PS 2000-2 (USA) were used. Cationic exchange chromatography column (10×3 cm) was used. Orbital shaker (FINEPCR SH30t), Laminar flow hood (Beasat) and CO2 incubator (N-Biotex) were used. The Zeta potential and particles size of the nanoemulsion particles were determined respectively in a ZetaCompact (CAD Instruments, France) and particle size analyzer (VASCO – 1, France). SEM analysis of nanoemulsions were carried out in a scanning electron microscope (LEO,model VP 1450, Germany). Also, ultrasound (XL2020-010, USA), ultraturax (IKA, Model T25, Germany), circular dichroism (CD) spectrometer (J-815, CD spectrometer, Japan), fluorescence intensity (model 2500, Hitachi, Japan) were used for analytical assays.
Peptide Synthesis
Bee venom was prepared using Benton electric shock device. 30mg of collected BV was dissolved in 2ml of ddH2O and centrifuged at 12,000 rpm for 15 min at 4°C. Supernatant was centrifuged at the same conditions then was filtered with 0.2µm membrane filter. ML of samples was purified to>95% homogeneity by reverse-phase high-pressure liquid chromatography analysis (RP-HPLC) on a C18 column with semi-polar solution Included water and acetonitrile containing 0.1% TFA as mobile phase under gradient elution at 215 nm.[13]
For the isolation of LF from camel milk, the fat and casein removed from milk by centrifuge at 4500g for 15 min in 4˚C (two times) and ultracentrifuge at 30000g for 30 min in 25˚C, (two times). What remains was whey protein. LF from camel milk was extracted and purified by ion-exchange chromatography (resin carboxymethyl Sephadex C-50). Since the molecular weight of LF and lactoperoxidase is 80 kDa, to ensure the existence of LF in the output column chromatography, the coloring reaction with tetramethylbenzidin (TMB) was applied. The reaction mixture contains H2O2 30%, mM 88 TMB and sodium phosphate buffer (1 mM 10 at pH =6) with ratio 1: 10: 100. 10 microliters of sample containing of the enzyme with 200 ml of the reaction mixture was incubated for 15 minutes at 37˚C. For this purpose, the horseradish peroxidase (HRP) was used as a positive control.[14]
The protein solution was desalinated by dialysis where the dialysis bag was surrounded with sucrose or polyethylene glycol (PEG).
Purity of ML and LF was confirmed by SDS – PAGE. ML and LF concentration was measured by the Bradford protein assay and nano-drop spectrophotometery.
ML was Identified by comparing the area under the eluting ML peak (retention time 22 minutes) to a standard curve generating using ML sample were purchased from Sigma-Aldrich. Extracted ML lyophilized and stored at -20◦C in the dark until needed.
Hemolytic Activity Assay of ML
In general the hemolytic Activity used to evaluate of potential bacteria or drugs and unknown substances in the destruction of red blood cells. In addition, one of the trials evaluating the safety of drug dose is hemolytic activity assay.
The hemolytic activity of bee venom and ML was assayed by a standard procedure[15]. In concise, fresh rabbit red blood cells (RBCs) that were collected in the presence of an anti-coagulant (sodium citrate) were washed three times in PBS. ML (in selected amounts dissolved in water 0.1, 0.05, 0.001 µg/ml, respectively) were added to the suspension of red blood cells (2% v/v) in PBS to the final volume of 200 μl and incubated at 37 °C for 35 min. The samples were centrifuged for 10 min at 2000 rpm, and the release of hemoglobin was monitored by measuring the absorbance (Asampel) of the supernatant at 540 nm. RBCs in PBS (Ablank) and in 0.2% v/v Triton X-100 (ATriton) were used for negative and positive controls respectively. The percentage of hemolysis was calculated according to the equation, Percentage of hemolysis = [(Asampel – Ablank)/( ATriton – Ablank)] × 100.
Preparation of Nanoparticles
Perfluorooctyl bromide nanoparticles (PFOB) was prepared by oil in water emulsions. “2% W / V surfactant (98 mol% egg lecithin and 2 mol% dipalmitoylphosphatidylethanolamine, DPPE), 20% V / V (PFOB) and rest of the water to volume 10ml” were stirred on a magnetic stirrer. [5]Then the blend were stirred by Ultra-Turex stirrer for 10 minute at 12000 rpm within water-ice solution. To obtain nano-sized particles, the blend were stirred by Ultrasound stirrer for 10 minutes within water-ice solution.[16]
Addition of ML and LF to NPs:
After the preparation of NPs, LF (in selected amounts in saline phosphate buffered of 110, 55, 27.5 µg/mL, respectively) and ML (in selected amounts in saline phosphate buffered of 0.1, 0.05, 0.001 µg/ml, respectively) were added to the preformed NPs separately and together, and the residual free (unbound) LF and ML washed out by centrifugation at 1000 rpm for 10 min. The amount of unbound LF was measured by measuring the tryptophan fluorescence and Bradford method [17]. Control NPs (without LF) were stored for 52 days under the same conditions.[18]
Entrapment Efficiency (EE)
The concentration of ML and LF added to the nanoparticles was determined by measuring concentration of ML and LF in the supernatant obtained by centrifugation in before step.
Entrapment efficiency (in percentage) was calculated using Eq.1.
Where is the amount of free ML or LF (or mix both of them) and is the total amount of ML or LF (or mix both of them) presented in 500 μL of NPs.[19]
Scanning Electron Microscopy Analyses
Scanning electron microscopy (SEM) is a method that uses electrons for high-resolution imaging of surfaces of particles, as a light microscope uses visible light. The advantages of SEM over light microscopy include much higher magnification (>100,000X) and greater depth of field up to 100 times that of light microscopy. Qualitative and quantitative chemical analysis information is also obtained using an energy dispersive x-ray spectrometer (EDS) with the SEM. In this study, the use of SEM, the particle shape and the particle size was checked before and after loading ML and LF.
Determination of Particle Size
Physical dynamic light scattering method is used to determine the distribution of particles in solution and suspension. This nondestructive and rapid method for the determination of particle size in the range of a few nanometers to microns to work. The task of setting a particle size specification for a material requires knowledge of which technique will be used for the analysis and how size affects product performance. All particle size analysis instruments provide the ability to measure and report the particle size distribution of the sample. The size of nanoparticles were obtained before and after loading ML and LF.[20, 21]
Determination of Zeta Potential
Zeta potential is a physical property which is exhibited by any particle in suspension. It can be used to optimize the formulations of suspensions and emulsions. Knowledge of the zeta potential can reduce the time needed to produce trial formulations. It is also an aid in predicting long-term stability.
Always around the level of the particles that have been in fluid, increasing the concentration of charged ions with opposite charge can be observed because the particles have a surface charge. Therefore an additional layer of ions surrounding the particle surface in the form of an electric double layer around the particle is created. The result can be an imaginary distance between the particle and fluid environment are given the impression that this is a double layer that surrounds the particle. These are the so-called hydrodynamic and potential are there in the distance is known as the zeta potential. Here by examining changes of zeta potential of nanoparticles before and after loading ML and LF, them accession was confirmed.[22]
Circular Dichroism (CD) Spectroscopy
The spectrometer, one of the most important light cognitive techniques to study biological molecules. A powerful way to determine the structure of proteins that an advantage of the method is easy to use, other benefits of this method is the short duration of the trial, and even detectable structural changes at a few milliseconds. Circular dichroism (CD) spectroscopy can be used to observe how secondary structure changes with environmental conditions or on interaction with other molecules. Structural, kinetic and thermodynamic information about macromolecules can be derived from circular dichroism spectroscopy. Herein, CD was used at confirm the incorporation of ML and LF to nanoemulsions.
Fluorescence Spectroscopy
Fluorescence spectroscopy is a method that directly study the interaction of the ligand with macromolecules, which extensive studies have been done by this method, especially by measuring fluorescence quenching. Fluorescence quenching occurs with static and dynamic quenching that checked in the Results and Discussion. For obtain the information about the incorporation of ML and LF to nanoparticles, fluorescence spectroscopy that is a highly sensitive and useful method were used. Fluorescence ray is the emission ray of UV and visible spectrum with compared to absorption radiation, longer wavelength and less energy. At the Aromatic amino acid in the presence of tryptophan, tyrosine and phenylalanine amino acids, protein absorption at the wavelength of about 280 nm are significant.
Add Free ML and LF and Loaded ML and LF onto the Nanoparticles on Breast Cancer MCF7 Cells Lines
To study the effectiveness of ML and LF and the effectiveness of nanoparticles containing ML and LF and the effectiveness of their combination on the growth of breast cancer MCF7 cells lines, three different concentrations of mentioned compounds were used.
MTT assay is a colorimetric method that is on the basis of breaking and dioxidating of tetrazolium yellow crystals (MTT) with the chemical formula 3 – [4, 5 – dimethylthiazol-2- yl] -2, 5-diphenyl-tetrazolium bromide and it is simpler than other methods of cell proliferation and applicable with the exist facilities in most laboratories.
The MCF–7 breast cancer cell line was prepared from Razi Institute, Ministry of Jahad-e-Keshavarzi, Mashhad, Iran. These cells are thawed to revive and recover. The recovered cells were transferred into culture flasks and were incubated with 5% carbon dioxide at 37 ° C. To investigate the effectiveness of nanoparticles containing of LF in the growth of cancer cells, three different concentrations were used. For this purpose, a day before adding nanoparticles, the cells were transferred in 96-well plates with 200 ml of medium. After adding nanoparticles, plates containing cells were incubated with 5% carbon dioxide at 37 ° C. After 24 hours the survival rate of the cells was controlled with MTT assay in vitro.
Results and Discussions
Identification of ML by HPLC System
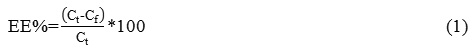
As the figure 1 shows, after 22 minutes, HPLC system was created a strong peak that was compared with standard ML as well as SDS-PAGE (figure 2b) was proved that the peak is ML.
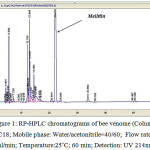 |
Figure 1: RP-HPLC chromatograms of bee venome (Column: C18; Mobile phase: Water/acetonitrile=40/60; Flow rate: 1ml/min; Temperature:25˚C; 60 min; Detection: UV 214nm;) |
The Results of SDS PAGE Analysis
In order to evaluate the pattern of the venom protein extracted and to determine the purity of the protein (ML and LF) and characterize the molecular weight range, after cationic exchange chromatography and the high performance liquid chromatography (HPLC) respectively sodium dodecyl sulphate-polyacrylamide electrophoresis (SDS- PAGE) was used. The samples were loaded on a 15% gel with 120V and 90 minutes and purified ML and LF were confirmed by comparison with standard ML and standard LF. The fraction in NaCl solution (0.7mol/L) was identified as LF by SDS-PAGE (Figure. 2a, Lane 2). SDS-PAGE results showed that the identified fraction had higher purity. The fraction in 22 minutes was identified as ML by SDS-PAGE (Fig. 2b, Lane 2). SDS-PAGE results showed that the identified fraction in 22 minutes had higher purity.
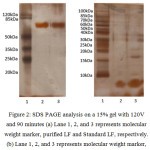 |
Figure 2: SDS PAGE analysis on a 15% gel with 120V and 90 minutes (a) Lane 1, 2, and 3 represents molecular weight marker, purified LF and Standard LF, respectively.(b) Lane 1, 2, and 3 represents molecular weight marker, purified ML and Standard ML, respectively. |
The Results of Hemolytic Activity Assay of ML
According to Figure 3 the hemolytic activity increases with increasing concentration of ML.
 |
Figure 3: Hemolytic Activity Assay of ML |
Entrapment Efficiency (EE)
According to the description given in section , by measuring the amount of free (unbound) protein ( ML and LF) after centrifugation and comparison with ML and LF present in 500 μL of NPs by tryptophan fluorescence and Bradford method according to equation 1, the entrapment efficiency for ML and LF were obtained about 87 and 91 percent, respectively91% respectively.
The Results of Scanning Electron Microscopy Analyses
SEM images of PFOB nanoparticles and nanoparticles loaded with ML or LF and nanoparticles loaded with both ML and LF, were shown in Figure 4a, 4b, 4c, 4d and figure 5 respectively with a magnification of between 100,000 to 500,000. It clearly that the structure of the nanoparticles during the production process and the incorporation of ML and LF is very homogeneous with uniform distribution diameter and the spherical particle morphology has not changed. Uniform shape of nanoparticles due to their surface charge which stay homogeneously together and do not precipitate. Also, because of the high surface tension, hydrophobicity and lipophobicity of the PFOB nanoparticles core, the general structure was preserved and finally, from the collapse of the nanoparticles was prevent.
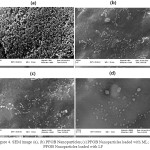 |
Figure 4: SEM image (a), (b) PFOB Nanoparticles; (c) PFOB Nanoparticles loaded with ML; (d) PFOB Nanoparticles loaded with LF. |
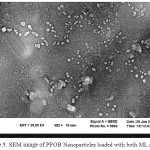 |
Figure 5: SEM image of PFOB Nanoparticles loaded with both ML and LF |
The Results of Particle Size Analysis and Determination of Zeta Potential
As Figures 6 (a,b,c) show the surface charge of nanoparticles due to the surfactant lipid monolayer is negative, with the addition of cationic peptide (ML) and cationic protein (LF) the zeta potential increase to positive numbers as a result the incorporation of ML and LF to nanoparticles confirms. The mean diameter (∼100 nm) of the nanoparticles after addition of LF and ML has not changed.
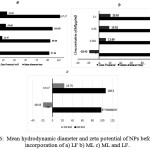 |
Figure 6: Mean hydrodynamic diameter and zeta potential of NPs before and after incorporation of a) LF b) ML c) ML and LF. |
The Results of Tryptophan Fluorescence
To study the interaction and the incorporation of ML and LF with the lipid monolayer of PFOB nanoparticles intrinsic tryptophan fluorescence (TRP19) (excitation, 280 nm) were used. The spectra clearly showed a strong fluorescence emission at wavelengths around 350 nm and 332 nm for ML and LF respectively. With the addition of ML and LF to nanoparticles a significant reduction in emission intensity of fluorescence was observed that the process is called fluorescence quenching.
Quenching the fluorescence emission intensity of the supernatant solution shows that LF added to the nanoparticles completely been connected to the nanoparticles. Results are shown in Figure 7.
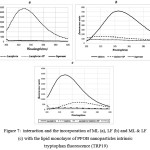 |
Figure 7: Interaction and the incorporation of ML (a), LF (b) and ML & LF (c) with the lipid monolayer of PFOB nanoparticles intrinsic tryptophan fluorescence (TRP19) |
The results of Circular Dichroism (CD) spectroscopy
For final confirmation of PFOB nanoparticle-bound ML and LF, CD spectra was used. This is a very sensitive spectroscopy to reveal major structural changes in the secondary structure of ML and LF occurred upon binding to the nanoparticles. When ML is associated with the PFOB nanoparticle lipid monolayer, a double negative peak is observed that characteristic of a R-helical configuration (Figure 8a) and when LF is associated with the PFOB nanoparticle lipid monolayer, a negative peak is observed (Figure 8b) also when ML and LF are associated with the PFOB nanoparticle lipid monolayer, a negative peak is observed (Figure 8c).
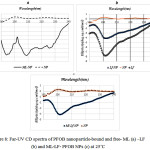 |
Figure 8: Far-UV CD spectra of PFOB nanoparticle-bound and free- ML (a) -LF (b) and ML-LF- PFOB NPs (c) at 25˚C |
The Results of the Effectiveness of Nanoparticles Loaded on MCF7 Cells Using MTT Test
In this study, inhibitory effects of nanoparticles leaded with ML and Lf on the viability and proliferation of breast Cancer cell line (MCF7) was investigated. Results of MTT assay indicated that ML and LF and nanoparticles leaded with ML and Lf show cytotoxic effect on breast cancer cells. As the figure 9 shows with increase of ML and LF leaded nanoparticles concentration increases cancer cell death. This is despite the fact that with increase of free ML concentration is less effective in cell death. Can be concluded when ML and LF to be loaded on nanoparticles, the most surface of its will be available and therefore a greater effectiveness on cell death. The results show that the higher concentration of ML and LF increase percent of cell death.
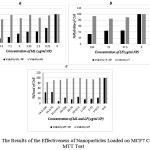 |
Figure 9: The Results of the Effectiveness of Nanoparticles Loaded on MCF7 Cells Using MTT Test |
Conclusion
Due to the unique properties of ML and LF including antimicrobial activity, immune system, and even their anti-cancer properties, appears to be great potential in the use of these natural biological products to fight diseases. In recent years, much research has been done on them. However, many research experiments in order to gain a better understanding of the activities and their interactions and safe and full use of them is still needed. Due to the sensitive nature of the ML and LF against proteolysis, a lot of research such as the use of nanoparticles to carry has been done. The purpose of this research was to design, formulate and evaluate Perfluorooctyl Bromide (PFOB) nanoparticles for ML and LF deliver in pharmaceutical applications.
The results showed that ML and LF alone effective on cancer cells and also by increasing the concentration of LF from 5.37 to 150 (µg/ml) and with increasing the concentrations of ML from 0.005 to 0.1 (µg/ml), increase cancer cell death. This effect was intensified when ML and LF was loaded onto the nanoparticles that due to the protein greater availability levels when loaded on nanoparticles.
References
- Berge, G., Anticancer activity of bovine lactoferricin and a cytolytic 9-mer peptide: from milk to cancer vaccine? 2009.
- Berge, G., Therapeutic vaccination against a murine lymphoma by intratumoral injection of a cationic anticancer peptide. Cancer immunology, immunotherapy, 2010. 59(8)1285-1294.
CrossRef - Hoskin, D.W. and A. Ramamoorthy, Studies on anticancer activities of antimicrobial peptides. Biochimica et Biophysica Acta (BBA)-Biomembranes, 2008. 1778(2): 357-375.
CrossRef - Huang, C., Hybrid melittin cytolytic peptide-driven ultrasmall lipid nanoparticles block melanoma growth in vivo. ACS nano, 2013. 7(7):. 5791-5800.
CrossRef - Soman, N.R., Synthesis and characterization of stable fluorocarbon nanostructures as drug delivery vehicles for cytolytic peptides. Nano letters, 2008. 8(4): 1131-1136.
CrossRef - Wang, C., Melittin, a major component of bee venom, sensitizes human hepatocellular carcinoma cells to tumor necrosis factor-related apoptosis-inducing ligand (TRAIL)-induced apoptosis by activating CaMKII-TAK1-JNK/p38 and inhibiting IκBα kinase-NFκB. Journal of Biological Chemistry, 2009. 284(6): 3804-3813.
CrossRef - Raghuraman, H. and A. Chattopadhyay, Melittin: a membrane-active peptide with diverse functions. Bioscience reports, 2007. 27(4-5): 189-223.
CrossRef - van den Bogaart, G., et al., On the mechanism of pore formation by melittin. Journal of Biological Chemistry, 2008. 283(49): 33854-33857.
CrossRef - Papo, N. and Y. Shai, Exploring peptide membrane interaction using surface plasmon resonance: differentiation between pore formation versus membrane disruption by lytic peptides. Biochemistry, 2003. 42(2): 458-466.
CrossRef - Lee, S.-J., , Characterization of perfluorooctylbromide-based nanoemulsion particles using atomistic molecular dynamics simulations. The Journal of Physical Chemistry B, 2010. 114(31): 10086-10096.
CrossRef - Lee, S.-J., Interaction of melittin peptides with perfluorocarbon nanoemulsion particles. The Journal of Physical Chemistry B, 2011. 115(51): 15271-15279.
CrossRef - Soman, N.R., Molecularly targeted nanocarriers deliver the cytolytic peptide melittin specifically to tumor cells in mice, reducing tumor growth. The Journal of clinical investigation, 2009. 119(9): 2830-2842.
CrossRef - Alia, O. and M. Laila, Antimicrobial Effect of Melittin Isolated from Syrian Honeybee (Apismellifera) Venom and its Wound Healing Potential. International Journal of Pharmaceutical Sciences Review & Research, 2013. 21(1).
- Liang, Y., et al., Simultaneous isolation of lactoferrin and lactoperoxidase from bovine colostrum by SPEC 70 SLS cation exchange resin. International journal of environmental research and public health, 2011. 8(9): 3764-3776.
CrossRef - Asthana, N., S.P. Yadav, and J.K. Ghosh, Dissection of antibacterial and toxic activity of Melittin a leucine zipper motif plays a crucial role in determining its hemolytic activity but not antibacterial activity. Journal of Biological Chemistry, 2004. 279(53): 55042-55050.
CrossRef - Abbas, S., An overview of ultrasound-assisted food-grade nanoemulsions. Food Engineering Reviews, 2013. 5(3): 139-157.
CrossRef - Kruger, N.J., The Bradford method for protein quantitation, in Basic protein and peptide protocols. 1994, Springer. 9-15.
CrossRef - Mader, J.S., et al., Bovine lactoferricin selectively induces apoptosis in human leukemia and carcinoma cell lines. Molecular Cancer Therapeutics, 2005. 4(4): 612-624.
CrossRef - Kruger, N.J., The Bradford method for protein quantitation. Basic protein and peptide protocols, 1994: 9-15.
- Goodman, J.W., Some fundamental properties of speckle. JOSA, 1976. 66(11): 1145-1150.
CrossRef - Berne, B.J. and R. Pecora, Dynamic light scattering: with applications to chemistry, biology, and physics. 2000: Courier Corporation.
- Wiącek, A. and E. Chibowski, Zeta potential, effective diameter and multimodal size distribution in oil/water emulsion. Colloids and Surfaces A: Physicochemical and Engineering Aspects, 1999. 159(2): 253-261.
CrossRef

This work is licensed under a Creative Commons Attribution 4.0 International License.
![]()
A New Edition of Web of Science
Journal Impact Factor
2022: 0.5
Five Year: 0.8
Journal is Indexed in

Cabells Whitelist
![]()


