Biosorption Kinetic Models on the Removal of Congo red onto Unripe Calamansi (Citrus microcarpa) peels
1Biology Department, College of Science, De La Salle University, 2401 Taft Avenue, Manila, Philippines.
2Mathematics Area, School of Multidisciplinary Studies, De La Salle-College of Saint Benilde, 2544 Taft Avenue, Manila, Philippines.
3College of Medicine, University of the Philippines Manila, 547 Pedro Gil Street, Manila, Philippines.
4Department of Physical Sciences and Mathematics, College of Arts and Sciences, University of the Philippines Manila, Padre Faura Street, Manila, Philippines.
Corresponding Author E-mail: derick.sumalapao@dlsu.edu.ph
DOI : http://dx.doi.org/10.13005/ojc/320607
Download this article as:
![]()
Unripe calamansi peels were prepared and used as a bioadsorbent in the removal of congo red from an aqueous solution using batch adsorption studies. The efficiency of adsorption was evaluated by varying adsorbent dose and contact time. The removal of congo red increased at higher adsorbent dose and longer contact time. The overall rate of adsorption processes appeared to be in accordance with the pseudo-second order reaction mechanism. Higher initial adsorption rate, extent of surface coverage, and activation energy were favored at a lower adsorbent dose, while the intraparticle diffusion was relatively faster at a higher adsorbent dose. The intraparticle diffusion, Elovich, and MacArthur-Wilson modelswere adequate in describing the chaotic behavior of the kinetic processes involved in the removal of congo red dye onto unripe calamansi peels.
KEYWORDS:Biosorption kinetics; Pseudo-second order; Elovich; MacArthur-Wilson; Intraparticle diffusion; Citrus microcarpa
Introduction
Dyes are colored organic compounds which are used in industries that produce textiles, paper, and distilleries. As a result of incomplete binding with fibers during the dyeing process, dyes are found in highly colored wastewaters which pollute bodies of water1. Due to their high water solubility and ability to color vividly at low concentrations, dyes easily contaminate the wastewater produced by industries2. This affects gas solubility and transparency of bodies of water, which have a detrimental effect on aquatic life1. One of these dyes is congo red which is a common, toxic, and carcinogenic dye used for coloration of paper products. Paper industries dispose of congo red in large amounts and are usually found in sediments in polluted canals3. When dyes such as congo red enter the water systems, they can cause pollution, consequently harming humans and aquatic organisms4.
As such, one way to address this problem is through biosorption. It is a physico-chemical process which makes use of biological materials to adsorb pollutants from aqueous solutions5. Currently, activated carbon is one effective yet expensive biosorbent used in treating groundwater and industrial wastes6. Agricultural wastes are being considered as an alternative adsorbent compared to other materials due to its availability in large quantities, renewability, and inexpensiveness7. Compared to conventional physical and chemical methods, biosorption studies are looking for easier and less costly treatment, often making use of these agricultural wastes as bioadsorbents6.
Currently, no biosorption studies have been conducted for calamansi (Citrus microcarpa) peels, although there have been for orange peels8, which belong to the same family. Finding potential uses for these discarded peelings may reduce waste and pollution. Hence, this study explores on the removal of congo red from an aqueous solution by unripe calamansi peels in a single component adsorption system at varying adsorbent doses and contact times using spectrophotometry.
In addition, , this study attempts to elucidate the mechanisms governing the removal of congo red , and to find a suitable mathematical model for the kinetics of the removal involving adsorbent dose and contact time. In particular, comparison on the removal of congo red from an aqueous solution using calamansi peels under constant pH, dye concentration, and temperature will be made. Only unripe calamansi peels as adsorbent with congo red as the adsorbate were used in this study. Furthermore,, factors such as the dye concentration, pH, and temperature were kept constant at 0.1 g/L, 4.00, and room temperature (27 oC), respectively. The bioadsorptive properties of calamansi peels were measured across different contact times, namely 10, 20, 30, 40, 50, and 60 min under 0.25 g and 0.50 g adsorbent doses. The mechanisms of adsorption and potential limiting steps will be described using several equations, namely the pseudo-first order, pseudo-second order, Elovich, MacArthur-Wilson, and intraparticle diffusion nonlinear kinetic models.
Nonlinear models, in general, are more difficult to specify, identify, and estimate than linear models, and it involves nonlinear iterative processes in determining the solution. Gauss-Newton, as one of the iterative methods employed in classic nonlinear regression analysis, was considered in estimating the parameters of nonlinear models in this study. The adequacy and sufficiency of the various models were individually assessed. It is important to be able to predict the rate at which hazardous wastes are removed from an aqueous solution in order to design appropriate adsorption treatment systems. Moreover, exhaustive exploration on the adsorption kinetics involving wastewater treatment is important in providing better understanding of the reaction pathways and possible mechanisms involved.
The use of commercial water treatment processes such as activated carbon is limited in the textile industry due to the high cost of production and problems with regeneration6. Hence, this necessitates a need for cheaper and more efficient alternative methods, and one of these is biosorption. One reason that makes biosorption a potential alternative to the current commercial methods is the abundance of biomass9. Utility of calamansi peels as bioadsorbent would help in the reduction of agricultural waste and pollution. In a system design perspective, aggregate analysis of varying adsorption rates is a prerequisite for practical application and this requires examination of the controlling mechanism of the adsorption process which includes the mass transfer, chemical reaction, and diffusion control. As such, several adsorption kinetic models were tested using the obtained experimental data. Therefore, the study could provide potential alternatives to other dye-removal methods like membrane filtration, reverse osmosis, coagulation or flocculation, and fenton reagents which are not economically feasible6. Considering the lack of studies exploring calamansi peels as bioadsorbent, the study will provide baseline information on the adsorptive properties of calamansi peels.
Materials and Methods
Preparation of Adsorbents and Adsorbate
Calamansi Peels
Citrus microcarpa is a fruit available in the Philippines year-round, but is most abundant from August to October10. Due to its varied uses, the plant is cultivated both on a large and small scale throughout the country. Unlike oranges, which are also part of the Rutaceae family, calamansi fruit peelings have not been tested for adsorptive properties.
Five kilograms of unripe calamansi was procured from Villa Colongan, Barangay Colongan, Ibaan, Batangas, Philippines and subsequently peeled after two days. The peels were washed with distilled water to remove impurities and other particles, cut into small pieces, and dried in an oven at 100 °C for 90 min8. The dried peels were then crushed using a mortar and pestle, then grounded into granules and sifted through a 1.00 mm mesh in order to control particle size. Degraded cells offer a larger available surface area and intracellular component resulting to increase in the availability of more surface binding sites and modifies the functional groups present in the cell wall11. Subsequently, the sifted granules were washed with distilled water and decanted until the supernatant fluid had a comparable absorbance to that of distilled water. The adsorbent was dried again in an oven for 80 min at 50 °C and subsequently stored in a desiccator until it was used in the experiment12.
Congo red and Point of Zero Charge
Congo red (C32H22N6Na2O6S2; 696.68 g/mol) is an anionic direct diazo dye that is mainly used for paper coloration in the paper industry3, and about 15% of congo red ends up in wastewater13. It is the sodium salt of benzidinediazo-bis-1-naphtylamine-4-sulfonic acid and is known to degrade into benzidine, which is a carcinogen14. The treatment of congo red contaminated wastewater can be implicated due to its complex aromatic structure15, providing the dye physico-chemical, thermal and optical stability, and resistance to biodegradation and photodegradation16, 17.
The point of zero charge (pHpzc) is the pH at which the surface of an adsorbent has a net charge of zero, and the surface of an adsorbent will be positive and will attract anions if the pH is lower than pHpzc, while a negatively charged surface will favor the adsorption of cationic substances if the pH is above the pHpzc9. At pH below the isoelectric point, a dye exists predominantly in its molecular form, while above the isoelectric point, it exists with a higher proportion in its dissociated form. The isoelectric point of congo red is 3, thus it would be negatively charged at pH range of 5.0-10.0 18, 19. Considering the anionic nature of congo red, it can be said that setting the stock solution to an acidic pH will theoretically allow better adsorption. Rice husk ash was observed to exhibit a high adsorption capacity on congo red at pH 4.020.
Congo red solution with a concentration of 0.1 g/L was prepared by dissolving 0.1 g congo red in 1 L acetate buffer with a pH of 4.00. A buffer solution with a pH of 4.00 was prepared using 0.1 M NaOH and 1 M acetic acid12. The flask was wrapped in aluminum foil and stored inside an icebox until it was needed.
Establishment of Calibration Curve
A calibration standard for the congo red was prepared by mixing the dye with acetate buffers resulting into five different concentrations which range from 5 to 85 ppm of three replicates per trial. The absorbance for each calibration solution was then determined using a UNICO UV-Vis spectrophotometer set at λmax=500 nm with a uniform pathlength of 1 cm for all the trials21. Simple linear regression analysis was employed to generate the calibration curve.
Batch Adsorption Study
From the stock solution of 0.1 g/L congo red, 70 mL was transferred to a 250-mL beaker, and then 0.50 g of adsorbent was added to the solution which was mixed using a magnetic stirrer operating at 500 rpm. A volume of 8 mL sample was taken from the mixture using a syringe at 10-min intervals for 60 min. The samples were then filtered using Whatman® nitrocellulose membrane filters of pore size 0.45 μm to separate the adsorbent from the solution12, the absorbance of each sample was subsequently measured using a UNICO UV-Vis spectrophotometer set at λmax=500 nm8. The same procedure was done for the 0.25 g adsorbent dose. Two replicates for each adsorbent dose were prepared.
Percent Removal of Dye
For each absorbance measurement, the corresponding molar concentration was then calculated using (1). According to Beer’s law, the product of molar absorptivity and pathlength is replaced by the slope obtained in the calibration curve.
![]()
In order to determine the magnitude of the effects of the adsorbent on congo red, the percent removal for each trial with respect to the initial mean molar concentration can be derived from the non-treated pre-filtration using (2).
![]()
Using the calibration curve, the final molar concentration was calculated and subsequently the percent removal of the dye was computed. For the given initial and final concentrations of the dye, denoted as Ciand Cf in (mg L-1), respectively, the percent removal can be computed using (2)14.
The Bioadsorption Kinetic Models
The functional relationship between contact time and the amount of congo red adsorbed, with a levelling of the increase of the amount of dye adsorbed at some contact time value, depicts a chaotic nonlinear interacting relationship. A nonlinear model was required to capture this phenomenon.
The Pseudo-First Order Kinetic Model
The pseudo-first order kinetic model is defined as
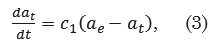
where αt (mg g-1) is the amount of dye adsorbed at time t, αe (mg g-1) is the adsorption capacity at equilibrium, c1 (min-1) is the pseudo-first order rate constant, and t (min) is the contact time. The general solution to this pseudo-first order model is
![]()
The Pseudo-Second Order Kinetic Model
The pseudo-second order kinetic model22 is given as
![]()
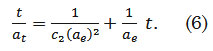
where αt (mg g-1) is the amount of dye adsorbed at time t, αe (mg g-1) is the adsorption capacity at equilibrium, c2 (g mg-1 min-1) is the pseudo-second order rate constant, and t (min) is the contact time. The general solution to this second order differential equation is defined as
The Elovich Model
The Elovich model23 is defined as
![]()
The solution to this differential equation describes the activated chemisorptions24 and is defined by
![]()
where αt (mg g-1) is the amount of dye adsorbed at time t, α (mg g-1 min-1) is defined as the initial adsorption rate, β (g mg-1) is the extent of surface coverage and activation energy for chemisorption, and t (min) is the contact time.
The MacArthur-Wilson Model
The MacArthur-Wilson model is a two-parameter negative exponential model25 which takes the form
![]()
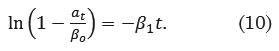
where αti (mg g-1) is the amount of dye adsorbed at time ti , βo (mg g-1) is a parameter defined as the asymptote or potential maximum, β1 (min-1) is defined as the rate at which the response variable approaches its potential maximum, t (min) is the contact time, and εi (mg g-1) is the random error term. The linearized form of (9) is defined as
Intraparticle Diffusion Model
Another functional relationship identified to some adsorption processes is that the uptake varies almost proportionally with rather than with the contact time, t. The Weber-Morris plot examines the possible relationship between at and t ½ using the equation
![]()
where at (mg g-1) is the amount of dye adsorbed at time t, kid is the intraparticle diffusion rate constant. The intercept,C , represents the thickness of boundary layer, a larger intercept suggests a greater boundary layer effect because of the instantaneous utilization of the readily available adsorbing sites on the adsorbent surfaces26.
The Gauss-Newton Method
The proc nlin (nonlinear regression procedure) of SAS (Statistical Analysis System) was used to fit the models and estimate the parameters. In software computing algorithms such as SAS, in finding the least squares estimator, in a nonlinear model, one of the most often methods used is the Gauss-Newton procedure. This method is iterative and requires starting value estimates for the parameters25. Inference on the coefficients using this method is based on the asymptotic variance-covariance matrix of the regression coefficients. Convergence of the parameter estimates depends on the specified initial values. Poor starting points can result the procedure to move in an undesired direction, and so convergence is never met. Hence, transformation of a nonlinear model to a linear form in estimating the parameters by linear regression is a possible solution and was employed in this study, and subsequent values obtained were taken as initial estimates. Table 1 summarizes the linearized form of the different nonlinear kinetic models employed in this study.
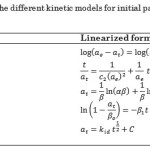 |
Table 1: Linearized form of the different kinetic models for initial parameter estimation procedure. |
Error Analysis
Since the parameter estimation procedure involves nonlinear models, three different error functions of nonlinear regression were utilized to evaluate the adequacy of the best-fit bioadsorption kinetic model to the experimental data.
Sum of Squares of the Errors (SSE)
The most commonly employed error function is SSE27 and is defined as
![]()
where αe,pred and αe,obs are the predicted and the observed values (mg g-1) at equilibrium, respectively, and n is the number of observations.
Sum of the Absolute Errors (SAE)
Parameter estimates employing the SAE describe a better fit as the value of the errors increases as it favors the fit towards the high-concentration observations27. The expression for SAE is defined as
![]()
Average Relative Error (ARE)
The average relative error function attempts to minimize the fractional error distribution across the entire range of observations28, and is computed using the expression

Results and Discussion
The uptake of congo red dye continues to increase until it reaches the equilibrium, for which such phenomenon is typical from the presence of several surface sorption sites, which gradually get saturated with the dye at increasing contact time. The mean removal of congo red revealed a relatively slow initial rate during the first 10- and 20-min intervals (p>0.05), and does not differ between the two adsorbent doses (p>0.05). This is in contrast to the rapid initial adsorption of congo red taking place within the first 20-min interval using chitosan, after which the adsorption slowed down and then almost reached equilibrium at 120 min29. Beyond the 20-min interval, the removal rate gradually increases, and eventually remains constant for the 0.25 g adsorbent dose as illustrated in Figure 1. However, for the 0.5 g adsorbent dose, removal rate continues to rise until the 50-min interval, and eventually starts to gradually remain constant. The mean amount of dye adsorbed during the 50- and 60-min intervals significantly differ between the two adsorbent doses (p <0.001).
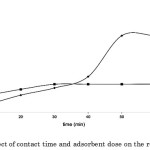 |
Figure 1: The effect of contact time and adsorbent dose on the removal of congo red. |
Figure 1 describes the uptake of congo red as it increases up to a certain threshold and then remains almost unchanged. The possible presence of repulsive forces between adsorbate molecules on the solid and bulk phases might contribute to the observed moderate rates of adsorption as it approaches the equilibrium. The equilibrium contact time for 0.5 g and 0.25 g adsorbent doses was observed at 50 min and 30 min, respectively (p<0.01). Adsorption curves are single, smooth, and continuous leading to saturation and indicate the possible monolayer coverage on the surface of adsorbents by the dye molecules30. Due to the rapid adsorption of all available sites and a relatively small amount of absorbent used, removal efficiency of congo red decreased; an increase in the amount of adsorbent may therefore reverse adsorption trend31. The percentage removal of congo red remarkably increases at an increasing dose. An increase in the dose from 0.25 g to 0.5 g resulted to 33-40% increase in the percent removal. This is possibly explained by the increase in the surface area for dye bindings and availability of additional sorption sites29, 31, 32.
Parameter Estimates and Analysis
Initial parameter estimates for the varying nonlinear kinetic models employed in this study were obtained using the respective linearized form as presented in Table 1. In the pseudo-first order kinetic model, the linear plots of against is reflected in Figure 2(a). From these plots, the value of in the pseudo-first order kinetic model was determined, and is given in Table 2. Due to the inherent disadvantage of correctly estimating the equilibrium amount adsorbed as obtained from the linearity of the curve, the relationship does not necessarily reflect the pseudo-first order mechanism. Further, the values obtained from the linear plots are different from the observed values, the pseudo-first order adsorption kinetic model is inadequate to describe the given rate processes as justified by the coefficients of determination (R2) significantly deviating from unity.
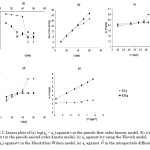 |
Figure 2: Linear plots using (a) pseudo-first order, (b) pseudo-second order, (c) Elovich, (d) MacArthur-Wilson, and (e) intraparticle diffusion kinetic model |
Table 2: Parameter estimates of the adsorption kinetic models at varying adsorbent doses.
| Model | Parameter | Adsorbent Dose Levels | |
| 0.5 g | 0.25 g | ||
| Pseudo-first order | obs (mg g-1) | 2.800 | 2.370 |
| pred (mg g-1) | 5.029 | 0.119 | |
| (min-1) | 0.110 | 0.044 | |
| R2 (%) | 85.88 | 82.25 | |
| Pseudo-second order | ae obs (mg g-1) | 2.800 | 2.370 |
| ae pred (mg g-1) | 2.818 | 2.385 | |
| c2 (g mg-1 min-1) | 0.093 | 0.714 | |
| R2 (%) | 99.63 | 99.99 | |
| Elovich | (mg g-1 min-1) | 10.69 | 2.17×10¹⁴ |
| (g mg-1) | 2.758 | 16.837 | |
| R2 (%) | 88.00 | 93.39 | |
| MacArthur-Wilson | B0 (mg g-1) | 2.562 | 2.347 |
| B1 (min-1) | 0.163 | 0.320 | |
| R2 (%) | 99.37 | 99.99 | |
| Intraparticle Diffusion | kid (mg g-1 min-½) | 0.148 | 0.022 |
| C (mg g-1) | 1.613 | 2.205 | |
| R2 (%) | 92.37 | 88.65 | |
Figure 2(b) describes the linear plots of
![]()
against in the pseudo-second order kinetic model. The estimate of the constant,c2 , was obtained from these linear plots, and is given in Table 2. It is important to note that the αe observed and αe predicted values obtained in the pseudo-second order biosorption kinetic model are almost the same (R2=0.99) which suggests that the adsorption phenomenon can be modelled approximately using the pseudo-second order kinetic equation for the different adsorbent doses. As such, the equilibrium system capacity for the pseudo-second order is relatively more reasonable compared to the pseudo-first order when predicted results were compared with experimental measurements. The pseudo-second order model provides the best correlation in the system processes indicating that the overall rate of congo red adsorption processes appear to be governed by the chemical process in accordance with the pseudo-second order reaction mechanism.
The pseudo-second order equation provides the best correlation for the kinetic process while the Elovich model adequately fits the experimental measurements well at lower adsorbent dose as depicted in Figure 2(c). Results of Elovich model suggest that higher initial adsorption rate, extent of surface coverage, and activation energy are favored at a lower adsorbent dose. The values of these parameters are reflected in Table 2. The agreement of the results with Elovich model with the observed values is subsequently explained. The adequacy of Elovich model to fit experimental data to heterogeneous catalyst surfaces helps to explain the fit in predicting the adsorption of congo red onto calamansi peels. This form of kinetic law involves a variation of the energetics of chemisorption with the active sites resulting to different activation energies for chemisorption since the peels of calamansi have been found to contain hydroxycinnamic acids and phenolic acids33. Since calamansi and orange belong to the same family, and both peels contain various functional groups; electrostatic attraction, organic properties, and structure of dye molecules can influence the adsorption process. Dried orange peel with pH 4 has higher tendency of electrostatic attraction since congo red has an anionic functional group, a high electrostatic attraction exists between the positively charged surface of the absorbent and the anionic dye32.
The initial parameter estimates for the MacArthur-Wilson model were obtained from the linear plots given in Figure 2(d). The αe observed and αe predicted values (βo ) obtained using the MacArthur-Wilson model are very close to each other as justified by the coefficients of determination which are almost unity as shown in Table 2. This suggests that the adsorption phenomenon can be approximately described using the MacArthur-Wilson model for the different adsorbent doses. However, the rate (β1 )at which the uptake approaches its potential maximum is relatively faster at a lower adsorbent dose.
Estimates for the diffusion rate constant and thickness of boundary layer of the intraparticle diffusion model are also reflected in Table 1. The intraparticle diffusion model offers an adequate fit for the experimental data involving higher adsorbent dose. The intraparticle diffusion is noted to be relatively faster at a higher adsorbent dose as a result of the instantaneous utilization of the most readily available adsorbing sites on the adsorbent surface, while the boundary layer effect appeared to be larger at the lower adsorbent dose as described by the linear plots in Figure 2(e).
Elovich model provides the best fit in the uptake of the dye in any adsorbent dose with error values noted to be smaller in the case of lower adsorbent dose as reflected in Table 3. Intraparticle diffusion model offers a better fit involving higher adsorbent dose as justified by small error measures and high coefficients of determination. Identifying the best-fit kinetic model is important in predicting the mechanisms involving chemical reaction or mass transport process that control the rate of the pollutant removal since this information is important in the design of appropriate sorption treatment plants31.
Table 3: Error analysis of the different adsorption kinetic models at varying adsorbent doses.
| Model | SSE | SAE | ARE | |||
| 0.5 g | 0.25 g | 0.5 g | 0.25 g | 0.5 g | 0.25 g | |
| Pseudo-first order | 2.472 | 0.602 | 4.035 | 2.214 | 60.721 | 12.012 |
| Pseudo-second order | 7.286 | 0.089 | 8.351 | 0.782 | 6.676 | 0.412 |
| Elovich | 0.168 | 0.002 | 1.352 | 0.132 | 4.594 | 0.470 |
| MacArthur-Wilson | 0.464 | 0.003 | 2.277 | 0.139 | 7.667 | 0.472 |
| Intraparticle Diffusion | 0.109 | 0.004 | 1.008 | 0.181 | 0.411 | 0.078 |
SSE – Sum of Squares of the Errors; SAE – Sum of the Absolute Errors; ARE – Average Relative Error
Moreover, analysis of the differential forms and the second-order derivatives of the Elovich, MacArthur-Wilson, and intraparticle diffusion models point out that these are negative over the entire range of contact time . These second-order derivatives are presented in Table 4. As such, these models justify the concave downward appearance of the curve when the experimental values on the amount of dye adsorbed from an aqueous solution onto calamansi peels versus contact time are fitted. The graphs of these models are displayed in Figure 3.
 |
Table 4: Differential forms of the second-order derivatives of the kinetic models. |
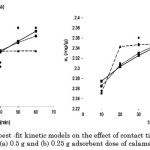 |
Figure 3: Comparison of the best -fit kinetic models on the effect of contact time on the adsorption of congo red onto (a) 0.5 g and (b) 0.25 g adsorbent dose of calamansi peels. |
Conclusion
The removal of congo red reflects a relatively slow initial and final increase rates against contact time. The removal of congo red increases at higher adsorbent dose and longer contact time. The kinetic processes involved behave under a pseudo-second order reaction, based on the assumptions that the rate limiting step, may be chemical adsorption or chemisorption involving valency forces through sharing or exchange of electrons between congo red and calamansi peels. Elovich model suggests that higher initial adsorption rate, extent of surface coverage, and activation energy are favored at a lower adsorbent dose, while the intraparticle diffusion model offers an adequate fit for the experimental data involving higher adsorbent dose. The intraparticle diffusion is noted to be relatively faster at a higher adsorbent dose as a result of the instantaneous utilization of the most readily available adsorbing sites on the adsorbent surface.
Given the results of the study, the removal of congo red from an aqueous solution onto calamansi peels has been found possible. With this information, it is possible to create a design that will optimize a treatment procedure employing calamansi peels as a bioadsorbent.
References
- Pereira, L.; Alves, M. Dyes-Environmental Impact and Remediation. In Environmental Protection Strategies for Sustainable Development, Strategies for Sustainability Series. A. Malik & E. Grohmann. Eds.2012, 1st Ed., 111-162.
CrossRef - Ratna, P. Pollution due to synthetic dyes toxicity & carcinogenicity studies and remediation.International Journal of Environmental Sciences. 2012, 3(3), 940-955.
- Jalandoni-Buan, A. C.; Decena-Soliven, A. L. A.; Cao, E. P.; Barraquio, V. L.; Barraquio, W. L. Characterization and identification of congo red decolorizing bacteria from monocultures and consortia.Philippine Journal of Science. 2010, 139(1), 71-78.
- Torres, J. M. O.; Cardenas, C. V.; Moron, L. S.; Guzman, A. P. A.; dela Cruz, T. E. E.Dye decolorization activities of marine-derived fungi isolated from Manila Bay and Calatagan Bay, Philippines. Philippine Journal of Science. 2011, 140(2), 133-143.
- Gadd, G. Biosorption: critical review of scientific rationale, environmental importance and significance for pollution treatment. Journal of Chemical Technology & Biotechnology. 2009, 84(1), 13-28.
CrossRef - Mohammed, M.; Shitu, A.; Ibrahim, A. Removal of methylene blue using low cost adsorbent: A review. Research Journal of Chemical Sciences. 2014, 4(1), 91-102.
- Salleh, M.A.M.; Mahmoud, D.K.; Wan Abdul Karim, W. A.; Idris, A. Cationic and anionic dye adsorption by agricultural solid wastes: A comprehensive review. Desalination. 2011, 280, 1-13.
CrossRef - Agboinghale, F. Studies on the use of orange peel for adsorption of congo red dye from aqueous solution. Computing, Information Systems, Development Informatics & Allied Research Journal. 2014, 5(4).
- Lim, L.; Priyantha, N.; Tennakoon, D.; Chieng, H.; Dahri, M.; Suklueng, M. Breadnut peel as a highly effective low-cost biosorbent for methylene blue: Equilibrium, thermodynamic and kinetic studies. Arabian Journal of Chemistry. 2014.
CrossRef - City Agriculturist Office-Davao City. Calamansi italicize.Davao City: City Agriculturist Office. 2010, 1-2.
- Farooq, U.; Khan, M.A.; Athan, W.; Kozinski, J.A. Effect of modification of environmentally friendly biosorbent wheat italicize on the biosorptive removal of cadmium (II) ions from aqueous solution. Chem. Eng. J.2011, 171, 400-410.
CrossRef - Abdur Rahman, F. B.; Akter, M.; Abedin, M.Z. Dyes removal from textile wastewater using orange peels. International Journal of Science and Technology Research. 2013, 2(9), 47-50.
- Sudipta, C.; Min, S.L.; Wooa, H. Adsorption of congo red by chitosan hydrogel beads impregnated with carbon nanotubes. Bioresour. Technol.2010, 101, 1800-1806.
CrossRef - Kaur, S.; Rani, S.; Mahajan, R.K. Adsorption kinetics for the removal of hazardous dye congo red by biowaste materials as adsorbents.Journal of Chemistry.2013.
CrossRef - Purkait, M.K.; Maiti, A.; Gupta, S.D.; De, S.Removal of congo red using activated carbon and its regeneration. J. Hazard. Mater. 2007, 145, 287-295.
CrossRef - Vimonses, V.; Lei, S.; Jin, B.; Chow, C.W.K.; Saint, C. Kinetic study and equilibrium isotherm analysis of congo red adsorption by clay materials. Chem. Eng. J.2009, 148, 354-364.
CrossRef - Smaranda, C.; Gavrilescu, M.; Bulgariu, D. Studies on sorption of congo red for aqueous solution onto soil. Int. J. Environ. Res.2011. 5(1), 177-188.
- Ahmad, R.; Kumar, R.Adsorptive removal of congo red dye from aqueous solution using bael shell carbon. Appl. Surf. Sci. 2010, 257, 1628-1633.
CrossRef - Zhang, Z.; Moghaddam, L.; O’Hara, I.M.; Doherty, W.O.S. Congo red adsorption by ball-milled sugarcane bagasse. Chem. Eng. J.2011,178, 122-128
CrossRef - Sarkar, D.; Bandyyopadhyoy, A. Shrinking core model in characterizing aqueous phase dye adsorption. Chem. Eng. Res. Des.2011, 89, 69-77.
CrossRef - Harris, D. Quantitative Chemical Analysis. New York: W. H. Freeman and Company. 7th ed. 2007, 70, 384
- Ho, Y.S.; McKay, G. The kinetics of sorption of divalent metal ions onto sphagnum moss peat. Water Research, 2000, 34(30), 735-742.
CrossRef - Cheung, C.W.; Porter, J.F.; McKay, G. Sorption kinetics for the removal of copper and zinc effluents using bone char.Sep Purif Technol, 2000, 92, 263-74.
CrossRef - Özacar, M. & Sengil, A. A kinetic study of metal complex dye sorption onto pine sawdust. Process Biochemistry, 2005, 40(2), 565–572.
CrossRef - Myers, R. H. Classical and Modern Regression with Applications. DWS Publishing Company. Boston, Massachusetts. 1986.
- Kannan, N.; Sundaram, M.M. Kinetics and mechanisms of removal of methylene blue by adsorption in various carbons- a comparative study. Dyes and Pigments, 2001. 51(1), 25-40.
CrossRef - Rajoriya, R.K.; Prasad, B.; Mishra, I.M.; Wasewar, K.L. Adsorption of benzaldehyde on granular activated carbon: kinetics, equilibrium, and thermodynamic. Chemical and Biochemical Engineering Quarterly. 2007, 21(3), 219-226.
- Kapoor, A.; Yang, R. T. Correlation of equilibrium adsorption data of condensible vapours on porous adsorbents. Gas Separation and Purification, 1989, 3(4), 187-192.
CrossRef - Jabbar, A. Z.; Hadi, A.G.; Sami, F. Removal of azo dye from aqueous solution using chitosan. Oriental Journal of Chemistry.2014, 30(2), 571-575.
CrossRef - Mane, V.S.; Mall, I.D.; Srivastava, V.C. Use of bagasse fly ash as an adsorbent for the removal of brilliant green dye from aqueous solution. Dyes and Pigments. 2007, 73(3), 269-278.
CrossRef - Ayawei, N.; Ekubo, A.T.; Wankasi, D.; Dikio, E.D. Adsorption of congo red by Ni/Al-CO3: Equilibrium, Thermodynamic, and Kinetic Studies. Oriental Journal of Chemistry.2015, 31(3), 1307-1308.
CrossRef - Wong, Y.C.; Ranjini, K.N.; Wan-Nurdiyana, W.A. Removal of congo red and acid yellow 36 dye using orange peel and rice husk as absorbents. Oriental Journal of Chemistry.2014, 30(2), 529-539.
CrossRef - Cheong, M.; Chong, Z.; Liu, S.; Zhou, W.; Curran, P.; Bin Yu. Characterisation of calamansi italicize. Part I: Volatiles, aromatic profiles and phenolic acids in the peel. Food Chemistry. 2012, 134(2), 686-695.
CrossRef


ISSN Online: 2231-5039

![]()


