Silver Nanoparticles-Based Nano-drop Spectrophotometric Determination of Cationic Surfactants Coupled with Hydrophobic Interaction; An Application to Pharmaceuticals and Environmental
Ashima Sharma and Kavita Tapadia
Department of Chemistry, National Institute of Technology, Raipur, India, CG, 492010.
Corresponding Author E-mail: akavita9@rediffmail.com
DOI : http://dx.doi.org/10.13005/ojc/320536
The proposed work describes the nanodrop spectrophotometric determination of cationic surfactants using citrate-modified silver nanoparticles based on the aggregation of silver nanoparticles induced by cationic surfactants due to the hydrophobic effect. The visible color change in the solution of silver nanoparticle includes a red shift with the quenching of the absorption spectra. The maximum absorbance was measured at wavelength,λmax400 nm. The concentrations of cationic surfactants were determined using a nanodrop spectrophotometer with limits of detection of 15.0, 8.0, 6.0, 5.8, and 13.0 µM for dodecyl trimethyl ammonium bromide, myristiltrimethyl ammonium bromide, cetrimoniumtrimethyl ammonium bromide, cetylpyridinium chloride and benzalkonium chloride, respectively. The proposed method was successfully applied for the determination of cetylpyridinium chloride in commercial mouthwasher, gum astringent and nasal spray pharmaceuticals and environmental samples.
KEYWORDS:Silver nanoparticles; aggregation; cationic surfactants; hydrophobic effect; pharmaceutical; environmental sample
Download this article as:| Copy the following to cite this article: Sharma A, Tapadia K. Silver Nanoparticles-Based Nano-drop Spectrophotometric Determination of Cationic Surfactants Coupled with Hydrophobic Interaction; An Application to Pharmaceuticals and Environmental. Orient J Chem 2016;32(5). |
| Copy the following to cite this URL: Sharma A, Tapadia K. Silver Nanoparticles-Based Nano-drop Spectrophotometric Determination of Cationic Surfactants Coupled with Hydrophobic Interaction; An Application to Pharmaceuticals and Environmental. Orient J Chem 2016;32(5). Available from: http://www.orientjchem.org/?p=22571 |
Introduction
Surfactants are surface-active compounds that can reduce the surface tension of water when used in very low concentrations. Surfactants are amphiphilic compounds. One end of the surfactant is hydrophilic (water soluble), and the other end is hydrophobic (water insoluble)1. The hydrophobic ends are generally natural fats and oils. The hydrophilic ends may be cationic, anionic and nonionic in nature. The most commonly used cationic surfactant is cetrimide, which contains tetradecyltrimethyl ammonium bromide with a minimum amount of dodecyl and hexadecyl compounds2. Anionic surfactants include carboxylates (soaps), sulfates, and sulfonates. Cationic surfactants (CSs) are widely used in various pharmaceutical, cosmetic and industrial applications. CSs are the main component of disinfectant fluid and act as biocides, emulsifiers, and wetting agents. Allergic reactions and inflammation can be caused by CSs in some sensitive persons; in particular, they can cause corneal damage when exposed to the eye3.CSs have become pollutants as a result of their deposition on land or into water bodies, and many are toxic to aquatic organisms4. Therefore, determination of quaternary cationic surfactants such as dodecyl trimethyl ammonium bromide (DTAB), myristiltrimethyl ammonium bromide (TTAB), cetrimoniumtrimethyl ammonium bromide (CTAB), cetylpyridinium chloride (CPC) and benzalkonium chloride (BZK) is very important.
There are several techniques for the determination of CSs, including capillary electrophoresis (CE)5, two-phase titration6,reversed-phase high-performance liquid chromatography (RP-HPLC)7, 8,gas chromatography (GC), gas chromatography-mass spectrometry (GC-MS)9, UV visible spectrophotometry10-12 and Rayleigh light scattering (RLS)13.These techniques are costly, consume a large amount of time and chemicals, require complicated operating steps and are inconvenient for outdoor detection. Therefore, we need to develop simple, rapid and sensitive methods for the determination of quaternary ammonium surfactants. The newest procedure, nanodrop spectrophotometric (NDS) determination, was applied to the determination of cationic surfactants based on a color change originating from the interaction of CSs and silver nanoparticles (Ag NPs), which is a fast, cost-beneficial procedure that is less time consuming. NDS avoids the use of large volumes of reagent solution; 1.0 μL of sample solution is sufficient for the spectrophotometric measurements (http//www.nanodrop.com/library/nd-1000-v3.7-users-manual-8.5×11.pdf.). The proposed method is simple, rapid and low cost, and it is more applicable for on-site determinations.
In previously reported methods, various reagents, such as orange (II), tetrabromophenolphthalein ethyl ester, bromophenol blue, quinidine and pyrocatechol violet, have been used for the spectrophotometric determination of CSs14-18.However, due to interference of some common ions, these reagents cannot be used. The Fe (III)-SCN– method was used for CSs determination, but interference of the reducing and oxidizing agents was observed19. The bismuth (III) iodide method20was also used for CS determination.
Noble metal nanomaterials (e.g., Au and Ag) have been commonly used to develop highly sensitive colorimetric probes for the determination of biomolecules21, 22, drugs23, toxicants24-28and small molecules 29-31 due to their optical and electrical properties and biocompatibility32, 33.Ag nano materials are more cost effective in their preparation than Au nano materials.
In the proposed work, we demonstrated a novel concept of CS determination by developing an Ag NP-based colorimetric system. The aggregation of Ag NPs with the addition of CSs due to hydrophobic effects results in color change, which is visible. The strategy is shown in scheme 1. The development of the CS determination method was successfully applied for the analysis of our model CS, CPC in pharmaceuticals and environmental samples.
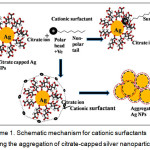 |
Scheme 1: Schematic mechanism for cationic surfactants inducing the aggregation of citrate-capped silver nanoparticles. |
Materials and Methods
Instrumentation
A nanodrop spectrophotometer (NDS, Model No.1000, Thermo Scientific Inc., Wilmington, Delaware, USA) with a path length of 10 mm was used for the absorbance measurements. An HR-TEM JEM-2100, JOEL (Philips, JAPAN) was used for the particle size analysis. Fourier transform infrared (FTIR) spectroscopy was performed on a Thermo Nicolet, Avatar 370 model with the spectral range 4000-400 cm-1 (Thermo scientific, USA) for the structural characterization of the NPs and the study of their size morphology. An LI-617 pH meter (Elico, Hyderabad, India) was used for pH measurements, and a Spinot magnetic stirrer with hot plate (Singhla Scientific Industry, Ambala Cant, India) was used for the Ag NPs preparation.
Chemicals and Reagents
Silver nitrate (AgNO3, 99.8%) and conc. HCl (38%) were purchased from Qualigen, Fischer Scientific, Mumbai, India. Sodium chloride (99.5%) was obtained from OCPW, Calcutta, India. Sodium hydroxide (99.5%) and trisodium citrate (≥ 98.0 %) were obtained from Merck, Mumbai, India. Dodecyl trimethyl ammonium bromide (DTAB, ≥ 95.0 %), myristiltrimethyl ammonium bromide (TTAB, ≥ 99.0 %) and benzalkonium chloride (BZK, ≥ 95.0 %) were obtained from Sigma Aldrich, St. Louis, USA. Cetrimonium bromide (CTAB, 98.0%) and cetylpyridinium chloride (CPC, 99.0%) were purchased from LOBA Chemie, Mumbai, India. Sodium dodecyl sulfate (SDS, ≥ 90.0 %) was purchased from Merck, Mumbai, India.Polyoxyethylenesorbitanmonolaurate (TWEEN-20, density-1.110 g/cm3 at 20⁰C) was obtained from Merck, Mumbai, India.
Standard stock solutions (1.0 mM) of surfactants were prepared using double-distilled water, and the desired concentrations of surfactant solutions were prepared by appropriate dilution of the standard stock solutions. Sodium hydroxide and hydrochloric acid (1.0 M) were used for pH adjustment. The required concentration of citrate-reduced silver nanoparticles (Ag NPs) was prepared by appropriate dilution of the 1.0 M stock solution of Ag NPs.
Procedure for preparation of citrate-reduced silver nanoparticles
Citrate-reduced Ag NPs were prepared according to a previously reported method 34, 35 with minor modifications: a 50 mL solution of 0.1 M AgNO3 in a conical flask covered with foil paper was heated to boiling temperature. The solution was removed from the heating element and placed in an ice bath. Then, 5 mL of 1% sodium citrate solution (double-distilled water) was added dropwise with vigorous stirring. A pale yellow color appeared. The solution was then heated to boiling temperature with vigorous stirring. After completion of the reaction, the solution was cooled to room temperature under vigorous stirring, and a dark yellow color appeared. The final product was stored in a dark brown bottle at room temperature.
Sample Preparation
Pharmaceutical samples such as commercial mouthwash (Cepacol, Australia; Fluocaril, Thiland) gum astringent(Stolin; India) and nasal spray(SinoFresh® Homeopathic Sinus and Nasal Care Spray; India) were prepared for the analysis. A 5.0 mL sample was transferred to a 100 mL volumetric flask and diluted 100 times with double-distilled water36. Then, 1.0 µL of the sample was subjected to NDS measurements. The water samples werecollected from different areas of Raipur city, Central India, and were filtered with Whatmann-42 paper and analyzed in the laboratory. The proposed method was used for field experiments. Batteries were used as the energy source for the NDS instrument.
Procedure for the determination of cationic surfactants and spectral studies
Various CS solutions with a given concentration were added separately to an Ag NP solution containing 10-3 M HNO3 at room temperature. The absorption spectra and images were recorded 3 mins after adding the analytes, and 1.0 µL samples of the solutions were directly spotted onto the pedestal of the NDS for analysis of the absorption spectra.
Results and Discussion
Characterization and aggregation of silver nanoparticles (high-resolution transmission electron microscopic analysis)
The Ag NPs were synthesized by the citrate reduction method with trisodium citrate. The HR-TEM images of dispersed Ag NPs and aggregated Ag NPs are shown in figure 1. According to the TEM analysis, the particle size of Ag NPs was 10.75 nm, which increased to an average size of 21.0 nm (calculated by histogram analysis) due to instantaneous aggregation of the NPs after the addition of 1.0 µM CPC.
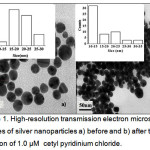 |
Figure 1: High-resolution transmission electron microscopic images of silver nanoparticles a) before and b) after the addition of 1.0 µM cetylpyridinium chloride. Click here to View Figure |
The citrate-capped Ag NPs were highly sensitive to CSs. As shown in figure 2, when 1.0 µM of DTAB, TTAB, CTAB, CPC and BZK was added separately to the Ag NPs solution, the color of the solution changed from the yellow to colorless within 3 min, indicating the aggregation of Ag NPs.
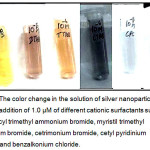 |
Figure 2: The color change in the solution of silver nanoparticles after the addition of 1.0 µM of different cationic surfactants such as dodecyltrimethyl ammonium bromide, myristiltrimethyl ammonium bromide, cetrimonium bromide, cetylpyridinium chloride, and benzalkonium chloride. Click here to View Figure |
Nanodrop Spectroscopy
To investigate the effects of surfactants on Ag NPs through the absorption spectra, the whole experiment was performed on NDS. Figure 3 a, b, c, d, and e show that the absorption wavelength of the Ag NPs sharply decreased and that the absorption spectra gradually broadened to a longer wavelength with the addition of CSs.
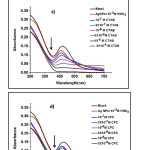 |
Figure 3: Absorption spectra of the silver nanoparticle suspension (pH=3.0, 10-3 M HNO3) in the presence of different concentrations of a) dodecyl trimethyl ammonium bromide(DTAB), b) myristiltrimethyl ammonium bromide(TTAB), c) cetrimonium bromide(CTAB), d) cetylpyridinium chloride(CPC), and e) benzalkonium chloride(BZK) in the range of 0.1-30 µM.
|
Fourier transform infrared analysis of silver nanoparticles and cationic surfactants
As shown in figure 4, the OH stretching band at 3453.82 cm-1 in the FT-IR spectra of the Ag NPs without surfactant shifted to 3453.22 cm-1 for the Ag NPs with a cationic surfactant (CPC), and a decrease in the OH peak is clearly visible. Similarly, the C=O peak at 1637.27 cm-1 in the Ag NPs shifted and decreased with the addition of CSs. The above changes in peaks confirmed the aggregation of Ag NPs.
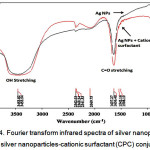 |
Figure 4: Fourier transform infrared spectra of silver nanoparticles and silver nanoparticles-cationic surfactant (CPC) conjugate. Click here to View Figure |
Optimization of reaction conditions
Effect of pH
The effect of pH on the sample solution was investigated to obtain the optimal aggregation for Ag NPs. The optimal pH of the aqueous solution was investigated in the range of pH 2.0-10.0. The absorbance of the Ag NP solutions with the addition of 1.0 µM CSs was individually studied for each CS. The absorbance decreased as the pH increased to 3.0. Thus, pH 3.0 resulted in the optimal aggregation of Ag NPs, and above this pH, precipitation occurred. Therefore, pH 3.0 was chosen as the optimal pH for the whole study, as shown in figure 5.
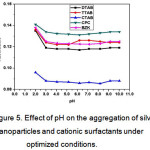 |
Figure 5: Effect of pH on the aggregation of silver nanoparticles and cationic surfactants under optimized conditions. Click here to View Figure |
Effect of Different Acids
To investigate the effect of different acids on the aggregation of Ag NPs with CSs, the absorption spectra of Ag NPs with CSs in the presence of 10-3 M different acids, such as H2SO4, HCl, and HNO3, were analyzed. There was no any change in absorption spectra of Ag NPs by adding 10-3 MH2SO4.The absorption spectra of Ag NPs decreased to a greater extent after the addition of CSs in the presence of 10-3 M HNO3 than in the presence of 10-3 M HCl. The decrease in absorption spectra of the Ag NP solution at 400 nm is due to the aggregation of Ag NPs induced by CSs because of the strong size-dependent surface plasmon resonance properties of Ag NPs and also the molecular volume of NO3– ions is greater than that of Cl– ions, the hydrophobicity of the ion pair formed by NO3– with CSs is stronger than the ion pair of Cl– with cationic surfactants. Thus, 10-3 M HNO3 was chosen as the optimal experimental condition37-38.
Effect of Reaction Time
The reaction time was the most important parameter of the experiment and was investigated in the range of 20-260 seconds under the optimized conditions. The absorbance of the Ag NP solution with CSs gradually decreased up to 180 sec and then remained constant. Thus, 180 sec (3 min) was selected as the optimal reaction time for the experiment and was sufficient for completion of the reaction.
Effect of Salt Concentration
Salt plays key role in aggregation of Ag NPs. Thus the influence of NaCl, NaNO3, Na2SO3, Na3PO4 and Na2SO4 on the aggregation of Ag NPs was also studied. The effect of various saltson Ag NPs with CSs was investigated separately in the range of 1.0 X10⁻³-5.0X10⁻³M under optimized conditions. However only NaCl gave the best results. The reason behind this phenomenon is electrostatic interaction between chloride ion and cationic surfactants adsorbed on the Ag NPs surface. Chloride is the best bridging ligands amongst another anions due to its medium size. Due to high absorbance below 2.0 X10⁻³ M concentration, aggregation of Ag NPs was not be clearly visible beyond 2.0 X10⁻³ M concentration of NaCl and absorbance remained constant. Thus, 2.0 X10⁻³ M concentration of salt solution was used for the optimization of the experiment.
Effect of the Concentration of the Probe Solution
The optimal concentration of probe solution (Ag NPs) was investigated by measuring the absorption intensity of probe solution Ag NPs in the presence of cationic surfactants under optimized condition. The effect of concentration of Ag NPs was studied in the range of 0.02-0.7 M. As the concentration of Ag NPs varied from 0.05-0.5 M, the absorbance was increased concurrently to 0.30M and beyond this absorbance remained constant. Therefore, 0.30MAg Nps was sufficient for aggregation of the Ag NPs solution with cationic surfactants.
Determination of Different Cationic Surfactants
The sensitivity of the proposed work was investigated for the spectrophotometric determination of CSs, which were evaluated individually. The color change of the Ag NP suspension changed from yellow to red and finally to colorless with an increase in the concentration of surfactant. The CSs included several homologues with different lengths of alkyl chain. The limit of detection (LODs) were 15.0 µM, 8.0 µM, 6.0 µM, 13.0 µM, and 5.8 µM for DTAB, TTAB, CTAB, BZK and CPC, respectively. The LODs decreased with increasing surfactant chain size. With increasing concentration of cationic surfactants, the Ag NPs tended to redisperse because of the reversal of the surface charge of Ag NPs39.
Selectivity
The selectivity of citrate stabilized Ag NPs was evaluated with the addition of different types of surfactants (cationic, anionic and non-ionic). CSs induced the aggregation of Ag NPs and change in color of Ag NPs solution was observed. Anionic surfactant SDS (sodium dodecyl sulphate) and non-ionic surfactant Tween-20 (Polyoxyethylenesorbitianmonolaurate) could not induce the aggregation of Ag NPs with the additionindividually and not change in color of Ag NPs was seen which was identified by experimental results and shown in figure 6. The selectivity of CSs surfactants was also proved by HR-TEM analysis as shown in figure 7.
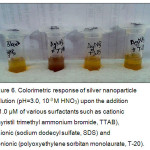 |
Figure 6: Colorimetric response of silver nanoparticle solution (pH=3.0, 10-3 M HNO3) upon the addition of 1.0 µM of various surfactants such as cationic (myristiltrimethyl ammonium bromide, TTAB), anionic (sodium dodecyl sulfate, SDS) and nonionic (polyoxyethylenesorbitanmonolaurate, T-20).
|
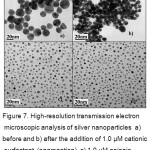 |
Figure 7: High-resolution transmission electron microscopic analysis of silver nanoparticles a) before and b) after the addition of 1.0 µM cationic surfactant (aggregation), c) 1.0 µM anionic surfactant (no aggregation), and d) 1.0 µM nonionic surfactant (no aggregation).
|
Sensitivity, optimum concentration, and statistics
The proposed method is simple colorimetric determination. The LODs were15.0 µM, 8.0 µM, 6.0 µM, 5.8 µM, and 13.0 µM for DTAB, TTAB, CTAB, CPC and BZK, respectively at λmax 400nm. The % RSD was ±1.2101, ±0.7134, ±0.8307, ±0.4983 and ±1.1435 for DTAB, TTAB, CTAB, CPC and BZK, respectively. The optimum concentration of cationic surfactant was 1.0 µM at optimum pH 3.0 with 10-3M HNO3.
Proposed work further extended for the determination of CPC in pharmaceuticals and environmental samples. The calibration range, LOD and % RSD for CPC was 10-7 – 3X10⁻⁵ M, 5.8 µM and ±0.4983, respectively.
Application
The proposed method was successfully applied for the determination of CSs, such as CPC, in commercial mouthwash (Cepacol, Australia; Fluocaril, Thiland) gum astringent (Stolin; India) and nasal spray(SinoFresh® Homeopathic Sinus and Nasal Care Spray; India). Table 1 shows that the recoveries corresponding to the addition of varying concentrations of CPC to the sample solution was in the range of 97.4-103.0%. Additionally, there is good agreement between the results of the proposed method and the reference CPC content (500 µg/mL) of the mouthwash formulation. Triplicate measurements were performed in the consumer product analysis. The proposed method was tested for the analysis of CPC in environmental (water) samples. The bismuth (III) iodide method was used for data validation of the environmental samples (table 2).
Table 1: Determination of cetylpyridinium chloride in commercial mouthwash pharmaceuticals by the proposed method.
|
Cetylpyridinium chloride (µg/mL) |
||||
| Pharmaceuticals | Added | Found a | Recovery%c | Original sample b (µg/mL) |
| Cepacol | 0.03.06.09.0 | 5.11 ± 0.788.98 ± 0.6710.6 ± 0.5613.2± 0.51 | 10110295.0101.2 | 511 ± 1.95 |
| Fluocaril | 0.03.06.09.0 | 4.88 ± 0.967.96 ± 0.8811.6 ± 0.6814.1 ± 0.48 | 97.497.7103102 | 488 ± 1.98 |
| Stolin | 0.03.06.09.0 | 4.91 ± 0.966.99 ± 0.8711.2 ± 0.6812.8 ± 0.55 | 98.510110296.4 | 491 ± 1.78 |
| Sinofresh | 0.03.06.09.0 | 5.09 ± 0.378.06 ± 0.5810.5 ± 0.4812.9± 0.91 | 96.4101.198.999.7 | 509± 1.22 |
a Average of three determinations ± standard deviations, b Amount measured by the proposed method for mouthwash
cCalculated by the formula [(a+b=c)], [(c-a/b)*100=% Recovery]
Table 2: Determination of cetylpyridinium chloride in environmental samples by the proposed method compared with previous methods.
|
S.NO. |
Water Samples |
Present Method [Using the Ag NPs method] (mgL-1) |
RSD% n=6 |
Previous Method [Using Bi (III)I] (mgL-1) |
RSD% n=6 |
| 1 |
PW1 |
4.4 |
1.7 |
4.2 |
1.2 |
|
PW2 |
3.5 |
1.2 |
3.8 |
1.3 |
|
| 2 |
GW1 |
1.7 |
1.1 |
1.9 |
1.3 |
|
GW2 |
1.5 |
1.2 |
1.6 |
1.3 |
|
| 3 |
RW1 |
3.8 |
1.3 |
3.9 |
1.4 |
|
RW2 |
3.6 |
1.3 |
3.5 |
1.0 |
|
| 4 |
MWW1 |
4.9 |
0.7 |
5.0 |
0.9 |
|
MWW2 |
5.2 |
1.4 |
5.1 |
1.3 |
PW=Pond Water, GW=Ground Water, RW=River Water, MW=Municipal Waste Water
Samples collected from Raipur City, Six analyses were performed
Conclusion
In the present method, citrate-stabilized Ag NPs applied for the determination of CSs. The absorbance of the probe solution decreased upon the addition of surfactant solution due to the aggregation of Ag NPs. The proposed NDS method was simple, low cost, rapid and applicable for the on-site determination of surfactants. This method provides a simple colorimetric determination of CSs. The proposed method was successfully utilized for the determination of CPC in pharmaceutical such as commercial mouth washers, gum astringent, nasal spray and environmental samples, such as pond water, ground water and municipal waste water. After comparison of present method with previously reported method, the present method has found with better selectivity than previous methods.
Acknowledgement
The authors are grateful to the National Institute of Technology, Raipur, for providing all necessary facilities.
References
- Butt, H.J.; Graf, K.;Kappl, M. In: Physics and Chemistry Interfaces; Wiley-VCH Verlag&Co.:Germany2003.
- Carter, S. J. In Dispensing for pharmaceutical students, (CBS publisher) p. 128
- Poison information, Ministry of Health Singapore, http://www.gov.sg/moh/mohiss/poison/cationic.html
- Murphy M.G.; Al-Khalidi, M.; Crocker, J.F.S.Chemosphere2005, 59, 235-246.
- Liu, H.Y.; Ding, W.H. J.Chromatogr.A 2004,1025, 303-312.
- Cacic, M.D.; Sak-Bosnar;Galovico,M. Talanta2008,76, 259-264.
- Malenovic,A.;Ivanovic, D.;Jancic, B. ActaChim. Slov.2004, 51,559-566.
- Malenovic, A.;Medenica, M.;Ivanovic, D. Farmaco2005,60, 157-161.
- Hind, A.R.;Bhargava, S.K.;Grocott, S.C. J. Chromatogr. A1997, 765,287-293.
- Ding, W.H.; Tsai, P.C. Anal.Chem.2003,75, 1792-1797.
- Li, C.;Numata,M.; Takeuchi, M. Angew,Chem. Int.2005,44, 6371-6374.
- Zhou, H.Y., Zhao, C.; Li;Heet, Y. Talanta2012, 97,331-335.
- Liang, A; Liu, Q.; Jiang, Z. Trends Anal. Chem.2012,37, 32-47.
- Betteridge, D. Anal Chem.1978,50, 832-846.
- Kawase, J.; Yamanaka, M. Analyst (Lond.)1979,104, 750-755.
- Masadome, T.; Imato, T. J Flow Inject Anal.1996,13, 120-124.
- Sakai, T.;Ohno, N. Anal Sci.1991,7, 297- 300.
- Sakai, T. Analyst1992,117, 211-214.
- Patel, R.M.; Patel, K.S. Talanta1999,48, 923-931.
- Agrawal, K.;Agnihotri, G.;Shrivas, K.;Mundhara, G.L.; Patel, K.S.; Hoffmann, P. MicrochimActa2004,147, 273-278.
- Wei, H., Li, B.; Dong, S. Chem. Commun.2007, 3735-3737.
- Lee, J.S.;Ulmann, P.A.; Ha, M.S. Nano Lett.2008, 8,529-537.
- HoromoziNehzad,M.R.; Tashkhurion, J.;Khodaveisi. J. Iran. Chem. Soc.2010,7, S83-S91.
- Zhou, H.Y.; Zhao, C.; Li;Heet, Y. Talanta2012,97, 331-335.
- Kim, S.; Park, J. W.; Kim, D. AngewChem. Int.2009, 48,4138-4141.
- Xue, Y.; Zhao, H.; Wu, Z.; Li, X.; He, Y.; Yuan, Z. Analyst 2011,136, 3725-3730.
- Wu, Y.; Zhan, S.; Zhou, P. Chem. Commun.2012, 48, 4459-4461.
- Liu, Z.Y.; Wu;Hu, J. Chem. Commun.2012,48, 3164-3166.
- Liu, J.; Lu, Y.; Wang, A.; Fan, C. Small2008,4, 1196-1200.
- Jiang, H.; Chen, Z.; Cao, H.;Huang, Y. Analyst2012,137, 5560-5564.
- Liu, Z.D.; Zhu, H.Y.; Zhao, H.X.; Huang, C.Z. Talanta2013,106, 255-260.
- Nakashima, H.; Yoshida, N. Chem. Lett.2006,35,1168-1178.
- Qian, J., Qian, X;Xu, Y. Chem. Eur. J.2009,15,319-323.
- Ratyakshi;Chauhan,R.P. Asian journal of chemistry2009, 21,S113-116.
- Ravindran, A.; Mani, V.;Chandrasekaran, N.; Mukherjee, A. Talanta2011, 85, 533-540.
- Zarei, A.R.;Sadeghi, H.B.;Abedin, S. Iranian journal of pharmaceutical research2013,12,671-677.
- Kim, Y.; Johnson, R.C.;Hupp, J.T. NanoLett.2001, 1,165-167.
- Li, J.; Fu, H.E.; Wu, L.J.;Zheng, A.X.; Chen, G.N.; Yang, H.H. Anal.Chem.2012, 84, 5309-5315.
- Frens G. Nature Phys Sci.1973241, 20-22.

This work is licensed under a Creative Commons Attribution 4.0 International License.
![]()
A New Edition of Web of Science
Journal Impact Factor
2022: 0.5
Five Year: 0.8
Journal is Indexed in

Cabells Whitelist
![]()


