Physico – Chemical Study of Transition Metal Complexes with Schiff’s Base derived from Naphthaldehyde and Substituted Aromatic Amines
Prem Mohan Mishra1 and Veena Mishra2
1Department of Chemistry, M. L. S. M. College, Darbhanga, India.
2L. N Mithila University, Darbhanga, Bihar – 846004, India.
Corresponding Author E-mail: mishrapm6@gmail.com
DOI : http://dx.doi.org/10.13005/ojc/320549
In continuation of the previous work here we are going to report stability constant values of transition metals like Cu(II) , Ni(II), Co(II) and Zn (II) with Schiff;s base ligand. Schiff’s base ligands were synthesized by the condensation reaction of Naphthaldehyde with 7- Hydroxy naphthalene – 2 – amine .Nitrate salts of divalent cobalt, nickel, copper and zinc were estimated by usual methods. Ligand was analysed for elements by standard method. pH metric titrations were carried out with the help of digital pH meter and stability constant of complexes of these metals with the ligands synthesized were computed by Irving- Rossotti technique modified by Calvin-Bjerrum. The stability constant values of metals for the given ligand were found to be in the order Cu(II) > Ni(II), Co(II) > Zn (II). This result is in agreement with the natural order proposed by Irving-William.
KEYWORDS:Schiff’s base, complex compounds, Stability constant, Irving – Rossotti titration technique, Naphthaldehyde, Thermodynamic parameters.
Download this article as:| Copy the following to cite this article: Mishra P. M, Mishra V. Physico – Chemical Study of Transition Metal Complexes with Schiff’s Base Derived from Naphthaldehyde and Substituted Aromatic Amines. Orient J Chem 2016;32(5). |
| Copy the following to cite this URL: Mishra P. M, Mishra V. Physico – Chemical Study of Transition Metal Complexes with Schiff’s Base Derived from Naphthaldehyde and Substituted Aromatic Amines. Orient J Chem 2016;32(5). Available from: http://www.orientjchem.org/?p=21257 |
Introduction
These days considerable attention is being paid to the chemistry of complex compounds of Schiff’s base containing nitrogen and other donor atoms.1- 4 Schiff’s base offer a versatile and flexible series of ligands capable to bind with varity of metal ions to give complexes with varying properties. These complexes are biologically active5and have wide potential applications in many fields such as catalysis6, electrochemistry7 and medicines and have shown that metal complexes act as antitumour, antiviral, anti cancer10 and other many anti bacterial agents.
A large number of polydentate Schiff’s base compounds have been synthesized and their complexes have been structurally characterized and extensively investigated. But little is known for their stability in aqueous solution in which it is used. Hence, the title project have been under taken. Here in the stability constant of complexes of divalent transition metals i.e. Co(II), Ni(II), Cu(II) and Zn(II) with Schiff’s base ligands have been determined.
Experimental
Nitrate salts of divalent Co, Ni, Cu and Zn all were E. Merck. All other chemicals used were AnalR grade and used without further purification. Elemental analysis of metal salts were done by volumetric and gravimetric methods. Double distilled and deionised water was used throughout the experiment. All titrations were done in aqueous-dioxane medium in the ratio 3:2 (v/v). Dioxane was purified by standard method.
Schiff’s base ligands were synthesized by the condensation of Naphthaldehyde with 7-Hydroxy naphthalene– 2 – amine. 3.5g of aldehyde in solution was mixed with nearly 3.0 g amine. The mixture was boiled under reflux in the presence of glacial acetic acid for about 2 hours. The solution was concentrated and cooled to 00C. The product obtained was filtered, washed several times and re-crystallized from ethanol. The yield of product was nearly 2.6 g.
 |
Scheme 1 |
Calvin – Bjerrum pH metric titration of acid, acid + ligand and acid + ligand + metal ions solutions were done at constant ionic strength of 0.1 M KNO3 at 298 K temperature in an inert atmosphere of nitrogen.The same process of titration were repeated for all the four Co, Ni, Cu and Zn metal ions. The change in colour and appearance of turbidity at particular pH value were recorded simultaneously. The change in pH of the solutions with each addition of alkali was recorded in Table no. 2.
Results
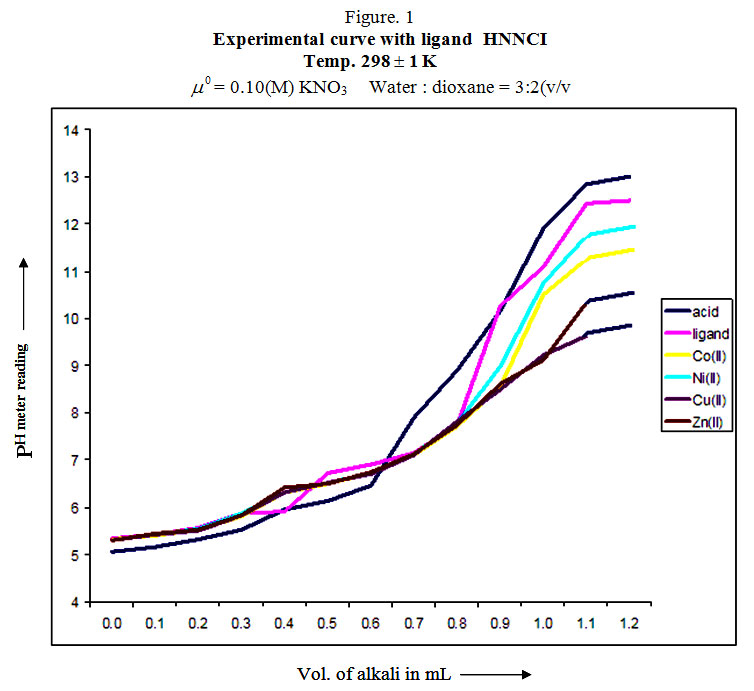
A graph was plotted between pH meter reading [B] and volume of alkali added in each case, (Figure – 1. ) Three titration curves obtained for each metal ions are acid titration curve (a), ligand titration curve (b) and complex titration curve (c) respectively.
Table 1: Concentrations Used In The Experiment
|
Metal / Ions |
Vo (mL) |
Y |
NO |
EO |
T |
T
|
| Co (II) | 100 | 1 | 1.0 (M) | 1.0 x 10⁻² (M) | 2.4 x 10⁻³ (M) | 5.0 x 10⁻⁴ (M) |
| Ni(II) | 100 | 1 | 1.0 (M) | 1.0 x 10⁻² (M) | 2.4 x 10⁻³ (M) | 5.0 x 10⁻⁴ (M) |
| Cu(II) | 100 | 1 | 1.0 (M) | 1.0 x 10⁻² (M) | 2.4 x 10⁻³ (M) | 5.0 x 10⁻⁴ (M) |
| Zn(II) | 100 | 1 | 1.0 (M) | 1.0 x 10⁻² (M) | 2.4 x 10⁻³ (M) | 5.0 x 10⁻⁴ (M) |
The values of volumes (V1, V2, & V3) corresponding to the same pH values were read from acid, ligand and complex titration curves (a), (b) and (c) respectively obtained from the experiment at temperature 298 K given in Figure – 1.
Table 2: Volume of alkali consumed in different titrations
check this from word file
Ligand – HNNCI (L1) Temp. 298±1K
μ0= 0.10 (M) KNO3 Water : dioxane medium (v/v) = 3:2
|
pH – meter reading (B) |
||||||
| Vol. of alkali added in mL | H+ | H++ L | H+ +L + Co(II) | H+ +L + Ni(II) | H+ + L + Cu(II) | H+ + L + Zn(II) |
| 0.0 | 5.05 | 5.35 | 5.32 | 5.3 | 5.3 | 5.3 |
| 0.1 | 5.15 | 5.43 | 5.4 | 5.42 | 5.42 | 5.44 |
| 0.2 | 5.33 | 5.57 | 5.52 | 5.55 | 5.5 | 5.52 |
| 0.3 | 5.53 | 5.87 | 5.8 | 5.86 | 5.82 | 5.82 |
| 0.4 | 5.95 | 5.91 | 6.32 | 6.32 | 6.32 | 6.42 |
| 0.5 | 6.13 | 6.73 | 6.5 | 6.52 | 6.52 | 6.5 |
| 0.6 | 6.45 | 6.9 | 6.72 | 6.72 | 6.7 | 6.74 |
| 0.7 | 7.9 | 7.15 | 7.1 | 7.12 | 7.1 | 7.12 |
| 0.8 | 8.9 | 7.75 | 7.72 | 7.79 | 7.82 | 7.74 |
| 0.9 | 10.15 | 10.27 | 8.55 | 8.98 | 8.5 | 8.62 |
| 1.0 | 11.9 | 11.1 | 10.5 | 10.75 | 9.22 | 9.12 |
| 1.1 | 12.85 | 12.43 | 11.25 | 11.75 | 9.62 | 10.34 |
| 1.2 | 13.15 | 12.57 | 11.70 | 12.10 | 10.20 | 10.56 |
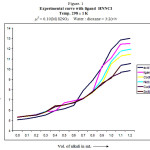 |
Figure 1: Experimental curve with ligand HNNCI |
Proton Ligand Stability Constant
The ligand titration curve is above the acid titration curve showing the basic nature of ligand and it is well separated from the acid titration curve at pH=6.3 at temp 298 K. The ligand curves run parallel to the acid titration curve indicating the smooth dissociation of the ligand.
The values of n̄A at various pH reading [B] was calculated from the acid and ligand titration curves and recorded in table 3.
The formation curve obtained from the plot of n̄A vs [B] extends from 0.43 to 0.88 (Figure 2) at temp 298 K. The dissociation of ligand may be represented as
HL ⇌ H+ + L–
The value of proton ligand stability constant was calculated by half integral method and it was further corroborated by linear plot method. (log n̄A / (1 – n̄A) vs [B] Figure. – 3.
Table 3: The values of n̄A at various pH reading [B]
Ligand – HNNCI Temp.: 298
μ0= 0.10(M) KNO3 Water : dioxane = 3:2(v/v)
| [B] | V2 – V1 | n̄A | log n̄A /1-n̄A) |
| 5.2 | 0.005 | 0.8878 | |
| 5.4 | 0.007 | 0.8840 | |
| 5.6 | 0.007 | 0.8832 | |
| 5.8 | 0.008 | 0.8812 | |
| 6.0 | 0.008 | 0.8814 | |
| 6.2 | 0.009 | 0.8742 | |
| 6.4 | 0.009 | 0.8724 | |
| 6.6 | 0.010 | 0.8682 | |
| 6.8 | 0.014 | 0.8610 | |
| 7.0 | 0.014 | 0.8442 | |
| 7.2 | 0.014 | 0.8362 | |
| 7.4 | 0.015 | 0.8360 | 1.2642 |
| 7.6 | 0.017 | 0.8282 | 1.2090 |
| 7.8 | 0.017 | 0.8196 | 1.0402 |
| 8.0 | 0.018 | 0.8121 | 1.0252 |
| 8.2 | 0.022 | 0.7986 | 0.8530 |
| 8.4 | 0.024 | 0.7964 | 0.7942 |
| 8.6 | 0.032 | 0.7882 | 0.7020 |
| 8.8 | 0.034 | 0.7834 | 0.6320 |
| 9.0 | 0.040 | 0.7602 | 0.4582 |
| 9.2 | 0.052 | 0.7120 | 0.3904 |
| 9.4 | 0.054 | 0.6794 | 0.3490 |
| 9.6 | 0.060 | 0.6555 | 0.2904 |
| 9.8 | 0.062 | 0.6274 | 0.2272 |
| 10.0 | 0.070 | 0.5996 | 0.4672 |
| 10.2 | 0.084 | 0.5674 | 0.4032 |
| 10.4 | 0.092 | 0.5322 | 0.3344 |
| 10.6 | 0.102 | 0.4883 | 0.2530 |
| 10.8 | 0.110 | 0.4782 | 0.0492 |
| 11.0 | 0.122 | 0.4672 | 0.0310 |
| 11.2 | 0.142 | 0.4394 | -0.2050 |
![Figure 2: Formation curve of ligand – HNNCI Plot of n̄A Vs [B]](http://www.orientjchem.org/wp-content/uploads/2016/09/Vol32No5_Phys_Prem_fig2-150x150.jpg) |
Figure 2: Formation curve of ligand – HNNCI Plot of n̄A Vs [B] |
![Figure 3: Linear plot of log(log n̄A / (1 - n̄A ) Vs [B]](http://www.orientjchem.org/wp-content/uploads/2016/09/Vol32No5_Phys_Prem_fig3-150x150.jpg) |
Figure 3: Linear plot of log(log n̄A / (1 – n̄A ) Vs [B] |
The complex titration curve of the system crossed the ligand mixture curve at pH 5.35 for Co(II), pH 4.88 for Ni(II), at pH = 5.90 for Cu(II) and pH 5.68 for Zn(II) – ligand system indicating the start of complexation.
Metal titration curve run parallel to the ligand titration curve indicating the liberation of extra proton due to hydrolysis of metal ions.
In, Co (II) System
Precipitation was observed at pH 8.9. Hence in the calculation of only the lower pH region of titration curve were used.
In Ni(II) System
The curve increased regularly up to pH 7.56 indicating constant rate of release of proton .No turbidity appears, which indicates that hydrolysis does not take place.
In Cu(II) System
Similarly in Cu(II) system the curve increased regularly up to pH 9.356 indicating constant rate of release of proton .No turbidity appears, indicating that hydrolysis does not take place
In ,Zn(ii) system
In case of Zn(II) system complex titration curve diverges at higher pH which indicates incomplete dissociation of ligand. Therefore for the calculation of n̄ only symmetrical region of the curve was used.
The value of n̄ calculated for these metals are
Co(II) – 0.22 to 1.86
Ni(II) – 0.40 to 1.96
Cu(II) – 0.081 to 1.82
Zn(II) – 0.12 to 1.72
As n̄ value did not go beyond 2 for any of the metal indicating the formation of ML and ML2 type of complexes.
From the formation curve of n̄ vs PL (Figure no.- 4a,4b,4c and 4d) the values of log K1 and log K2 were calculated in each case. It was further corroborated by mid point calculation method and linear plot of log n̄/ 1- n̄ vs PL (Figure no.- 5a, 5b, 5c and 5d) and also by plot of log 2- n̄/n̄-1 vs PL (Graph no.-6a, 6b, 6c and 6d) at temperature 298 K.
Table 4: Values of and PL at various [B] values
Co (II) + HNNCI Temp: 298 1 K
μ0 = 0.10 (M) KNO3 Water: Dioxane = 3:2(v/v)
| [B] | V3 – V2 | n̄ | PL |
| 5.0 | 0.004 | 0.2222 | 8.1650 |
| 5.2 | 0.006 | 0.3244 | 7.9762 |
| 5.4 | 0.010 | 0.4265 | 7.7862 |
| 5.6 | 0.018 | 0.5914 | 7.6014 |
| 5.8 | 0.032 | 0.5764 | 7.4124 |
| 6.0 | 0.042 | 0.7870 | 7.2412 |
| 6.2 | 0.052 | 1.8662 | 7.0634 |
| 6.4 | 0.060 | 1.2842 | 6.8858 |
| 6.6 | 0.072 | 1.58404 | 6.7092 |
| 6.8 | 0.074 | 1.7964 | 6.5364 |
| 7.0 | 0.090 | 1.8682 | 6.3742 |
Table 5: Values of PL at various values of log n̄/(1-n̄) and log (2 -n̄/(n̄-1)
Co (II) + HNNCI Temp : 298 1 K
μ0 = 0.10 (M) KNO3 Water: Dioxane = 3:2(v/v)
| log n̄/(1-n̄) | PL | log (2 -n̄/(n̄-1) | PL |
| -0.9560 | 8.9754 | 0.0262 | 7.7092 |
| -0.4134 | 8.7850 | -0.3622 | 7.5364 |
| 0.4212 | 8.4132 | ||
| 0.7904 | 8.2402 |
Table 6: Values of n̄ and PL at various [B] values
Ni (II) + HNNCI Temp : 298 1K
μ0= 0.10 (M) KNO3 Water: Dioxane = 3:2(v/v)
| [B] | V3 – V2 | n̄ | PL |
| 5.0 | 0.004 | 0.0406 | 8.1590 |
| 5.2 | 0.006 | 0.1012 | 7.9644 |
| 5.4 | 0.008 | 0.2454 | 7.7764 |
| 5.6 | 0.014 | 0.4082 | 7.5930 |
| 5.8 | 0.022 | 0.6150 | 7.4124 |
| 6.0 | 0.034 | 0.8036 | 7.2322 |
| 6.2 | 0.042 | 0.9932 | 7.0520 |
| 6.4 | 0.052 | 1.2306 | 6.8786 |
| 6.6 | 0.062 | 1.4634 | 6.7068 |
| 6.8 | 0.086 | 1.6972 | 6.5368 |
| 7.0 | 0.094 | 1.9684 | 6.3734 |
Table 7: Values of PL at various values of logn̄/(1-n̄) and log (2 -n̄/(n̄-1)
Ni (II) + HNNCI Temp : 298 1K
μ0= 0.10 (M) KNO3 Water: Dioxane = 3:2(v/v)
| logn̄ /(1-n̄ ) | PL | log (2-n̄) / (n̄ – 1) | PL |
| -0.9454 | 8.9640 | 0.6226 | 7.8782 |
| -0.4882 | 8.7770 | 0.5626 | 7.7064 |
| -0.1606 | 8.5924 | 0.4622 | 7.5362 |
| 0.2040 | 8.4124 | 0.3216 | 7.4832 |
| 0.6114 | 8.2322 | 0.2182 | 7.3218 |
Table 8: Values of n̄ and PL at various [B] values
Cu (II) + HNNCI Temperature 298 K
μ0= 0.10 (M) KNO3 Water: Dioxane = 3:2(v/v)
| [B] | V3 – V2 | n̄ | PL |
| 6.2 | 0.006 | 0.0814 | 8.5624 |
| 6.4 | 0.010 | 0.1640 | 8.3702 |
| 6.6 | 0.012 | 0.2672 | 8.1794 |
| 6.8 | 0.014 | 0.3722 | 7.9890 |
| 7.0 | 0.020 | 0.4796 | 7.7994 |
| 7.2 | 0.024 | 0.6150 | 7.6124 |
| 7.4 | 0.030 | 0.7632 | 7.4270 |
| 7.6 | 0.042 | 0.9412 | 7.2462 |
| 7.8 | 0.052 | 1.1434 | 7.0684 |
| 8.0 | 0.060 | 1.3270 | 6.8912 |
| 8.2 | 0.064 | 1.5364 | 6.7152 |
| 8.4 | 0.080 | 1.8240 | 6.5526 |
Table 9: Values of PL at various values of log n̄/(1-n̄) and log (2 -n̄/(n̄-1)
Cu (II) + HNNCI Temperature 298 K
μ0= 0.10 (M) KNO3 Water: Dioxane = 3:2(v/v)
| logn̄ /(1-n̄ ) | PL | log (2-n̄) / ( n̄- 1) | PL |
| -0.7056 | 8.3704 | 0.7752 | 7.0684 |
| -0.4360 | 8.1796 | 0.3114 | 6.8902 |
| -0.2262 | 7.9892 | -0.0642 | 6.7152 |
| -0.0353 | 7.7994 | -0.6710 | 6.5364 |
| 0.2044 | 7.6130 | -0.7128 | 6.3281 |
| 0.5090 | 7.4284 | -0.8214 | 5.9216 |
Table 10: Values of n̄ and PL at various [B] values
Zn (II) + HNNCI Temp: 298 1K
μ0= 0.10 (M) KNO3 Water: Dioxane = 3:2(v/v)
| B | V3 – V2 | n̄ | PL |
| 6.0 | 0.006 | 0.1226 | 7.3646 |
| 6.2 | 0.018 | 0.1852 | 7.1726 |
| 6.4 | 0.010 | 0.2914 | 6.9824 |
| 6.6 | 0.012 | 0.3750 | 6.7882 |
| 6.8 | 0.020 | 0.5092 | 6.6032 |
| 7.0 | 0.024 | 0.6366 | 6.4162 |
| 7.2 | 0.030 | 0.8344 | 6.2350 |
| 7.4 | 0.042 | 1.0352 | 6.0564 |
| 7.6 | 0.052 | 1.2612 | 5.8832 |
| 7.8 | 0.076 | 1.6668 | 5.7292 |
| 8.0 | 0.084 | 1.7215 | 5.5264 |
Table 11: Values of PL at various values of log n̄/(1-n̄) and log (2 -n̄/(n̄-1)
Zn (II) + HNNCI Temp: 298 1K
μ0= 0.10 (M) KNO3 Water: Dioxane = 3:2(v/v)
| log n̄ /(1-n̄ ) | PL | log (2-n̄) / (n̄ – 1) | PL |
| -0.6424 | 8.1722 | 0.4526 | 6.8822 |
| -0.3860 | 7.9816 | -0.2626 | 6.7296 |
| -0.2212 | 7.6896 | -0.2012 | 6.5812 |
| 0.2430 | 7.3152 | -0.1628 | 6.3158 |
| 0.7024 | 7.0125 | -0.0831 | 6.2817 |
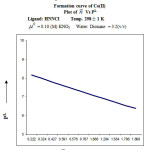 |
Figure 4a |
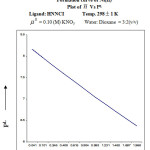 |
Figure 4b |
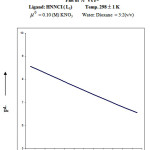 |
Figure 4c |
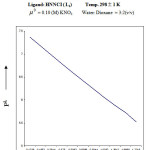 |
Figure 4d |
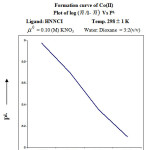 |
Figure 5a |
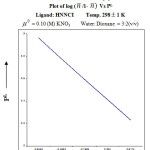 |
Figure 5b |
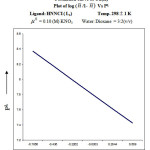 |
Figure 5c |
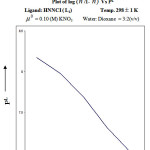 |
Figure 5d |
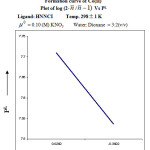 |
Figure 6aClick here to View Figure |
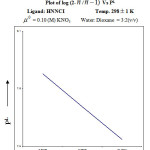 |
Figure 6b Click here to View Figure |
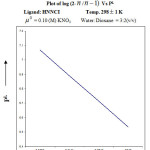 |
Figure 6c |
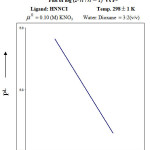 |
Figure 6d Click here to View Figure |
The values of protonation constant and stepwise stability constant obtained by different computational methods at temperatures 298 K are summarized in table no. 12
The different methods used are :-
a) Half – integral method
b) Mid – point calculation method
c) Straight line plot method.
Table 12: Values of protonation constant of ligand and stepwise stability constant of complexes of Co(II), Ni(II), Cu(II) and Zn(II) with ligand HNNCI
| SystemMetal ions | Methods |
Ligand HNNCI |
|
| log K1 log K2 | |||
| HNNCI(L1) | Abc |
10.96 – 10.96 |
|
| Co (II) | Abc |
7.56 7.58 7.62 |
6.64 6.66 6.68 |
| Ni (II) | Abc |
7.52 7.44 7.46
|
6.66 6.62 6.68 |
| Cu (II) | Abc |
6.76 6.64 6.84 |
5.76 5.04 5.78 |
| Zn (II) | Abc |
6.62 6.54 6.68 |
5.76 5.72 5.86 |
Table 13: Stepwise and over all stability constant of complex compounds of various metals with ligand HNNCI at temperature 298K
Water – Dioxane medium (v/v) = 3:2 μ0 = 0.10(M) KNO3
| System |
Ligand- MNNCI (L1) |
||
| log K1 | log K2 | log | |
| HNNCI (L1) | 10.98 | – | 10.98 |
| Co (II) | 6.76 | 5.70 | 12.46 |
| Ni (II) | 7.48 | 6.68 | 14.10 |
| Cu ( II) | 7.58 | 6.66 | 14.20 |
| Zn (II) | 6.60 | 5.78 | 12.34 |
The order of stability constant of various metals for the given ligand
HNNCI are – Cu(II) > Ni(II) > Co (II) > Zn(II)
The values of stepwise stability constants and over all stability constants are given in table no. 13
For the given ligand the stability constants of metals show the sequence
Cu(II) > Ni(II) > Co(II) > Zn(II)
This is natural order given by Irving – William. A theoretical justification of the order of stability constants follows from the consideration of the reciprocal of the ionic radii and 2nd ionization enthalpy of metal. Calvin – Bjerrum titration technique modified by Irving and Rossotti was used to determine the practical proton ligand and metal ligand stability constants at constant ionic strength maintained by using dilute KNO3 solution. Irving and Rossotti pointed out that the formation constant of metal chelates can be obtained without converting the pH – meter reading [B] to stoichiometric hydrogen ion concentration and without knowing the stiochiometric concentration of neutral salts added to maintain ionic strength. This method is valid for both aqueous and non-aqueous medium.
The nitrate (NO−3) ion has very slight complexing tendency. Therefore competition between nitrate ion and the ligand under study is of no importance.
The stability of the chelates is greatly affected by the electron density around the imino nitrogen ( – C = N – ). Higher the electron density around the nitrogen atom, stronger is the metal ligand bond.
The difference between the successive stepwise stability constant is large, which suggest that the formation of ML and ML2 chelates take place. The results obtained are in conformity of our previous studies12-15 and other workers16-17.
References
- Djebbar S. S.; Benali B.O.; Deloume J.P. Polyhedron, 1997,16, 2175.
CrossRef - Bhattacharyya P.; Parr J.; Ross A. T., Chem. Soc. Dalton, 1998, 3149.
- He L.; Gou S. H. ; Shi Q.F., J. Chem. Crystallography., 1999, 29 207.
CrossRef - Wu J.C.; Tang N.: Liu W.S.; Tan M.Y. ; Chan A.S., Chin Chem. Lett., 2001, 12757.
- Liu C. M. ; Xiong R.G.; You X. Z.; Liu Y.J.; Cheung K.K., Polyhedron,15 1996, 45651.
- Djebbar S.S.; Benali B.O.; Deloume J.P., Transit Metal Chem., 1998, 23, 443.
CrossRef - Hamada Y.J., IEEE Trans. Electron Devices, 1997, 44, 1208.
CrossRef - Brown D. H., Smith W.E., Teape J.W. et al., J. Med. Chem., 1980, 23(7), 729.
CrossRef - Srivastava R.S., Ind. J. Chem., 1990, 29, 1024 – 1026.
- Waish C., Nature, 2001, 409, 226.
CrossRef

This work is licensed under a Creative Commons Attribution 4.0 International License.
![]()
A New Edition of Web of Science
Journal Impact Factor
2022: 0.5
Five Year: 0.8
Journal is Indexed in

Cabells Whitelist
![]()


