Linear Copolymer of N-Isopropylacrylamide and 2-Hydroxyethylacrylate: Synthesis, Characterization and Monomer Reactivity Ratios
Nakan U1, Rahmetullaeva R. K2, Mun G. A2, Shaihutdinov E. M1, Yeligbaeva G. Zh1 and Moussa Negim El-Sayed3
1Kazakh National Research Technical University named after K.I. Satpayev, Almaty Republic of Kazakhstan.
2Al-Farabi Kazakh National University, AlmatyRepublic of Kazakhstan.
3University of Wolverhampton, Wolverhampton, WV1 1LY, United Kingdom.
Corresponding Author E-mail: ulantaynakan@gmail.com
DOI : http://dx.doi.org/10.13005/ojc/320505
Сopolymerization of N-isopropylacrylamide (NIPAAm) with 2-hydroxyethyl acrylate (2-HEA) carried out by solvent ethanol solution method, at 600C, using Azoisobutyronitrile (AIBN) as an initiator. The hydrophilic copolymers were characterized by elemental analysis, DSC, TGA and turbidimetric method. The results showed thermal stability increase with increase of NIPAAm in the copolymers. It was found that copolymer solutions have lower critical solution temperature (by turbidimetric analysis). The reactivity ratios of monomers were determined using linear methods like Fineman-Ross and Kelen-Tudos. The reactivity ratios of r1 and r2 were found to be 0,86, 0,72 and 1,02, 1,04 respectively.
KEYWORDS:NIPAAm; 2-HEA; LCST; Hydrophilic copolymers; Reactivity ratios
Download this article as:| Copy the following to cite this article: Nakan U, Rahmetullaeva R. K, Mun G. A, Shaihutdinov E. M, Zh Y. G, El-Sayed M. N. Linear Copolymer of N-Isopropylacrylamide and 2-Hydroxyethylacrylate: Synthesis, Characterization and Monomer Reactivity Ratios. Orient J Chem 2016;32(5). |
| Copy the following to cite this URL: Nakan U, Rahmetullaeva R. K, Mun G. A, Shaihutdinov E. M, Zh Y. G, El-Sayed M. N. Linear Copolymer of N-Isopropylacrylamide and 2-Hydroxyethylacrylate: Synthesis, Characterization and Monomer Reactivity Ratios. Orient J Chem 2016;32(5). Available from: http://www.orientjchem.org/?p=22261 |
Introduction
Among the synthetic polymers characterized by thermosensitive behavior the systems based on N-isopropylacrylamide (NIPAAm), whose homopolymerhas a lower critical solution temperature(LCST) in water, are the most studied ones. Poly(N-isopropyl acrylamide) PNIPAAm dissolves at temperature below 320C and precipitates at temperature above LCST [1, 2] due to the presence of the hydrophilic and hydrophobic groups in each monomer unit. Decrease in temperature below LCST is accompanied by the formation of hydrogen bonds between the amide groups of the polymer and water molecules, which significantly facilitates dissolution. At temperature above LCST hydrogen bonds begin to disintegrate. In contrast, hydrophobic interactions are enhanced; as a result the polymer precipitates [3]. Sol-gel transition of PNIPAAm is clearly visible to the naked eye. The results of recent studies using confocal laser microscopy scan have shown that the internal structure of PNIPAAm gel consists of continuous two-sphere structures with dense and sparse zones in the polymer network [4, 5].
Turbidimetry can be regarded as the more automated counterpart of the classical visual observation of macroscopic phase separation, although it may suffer complication arising from variation in precipitated aggregate sizes and settling of precipitates [6].
The determination of copolymer composition and reactivity ratios of the monomer is important in evaluation the specific application of the copolymer [7]. The monomer reactivity ratios determined by conventional linearization methods are not always accurate and several non-linear methods have been attempted to determine their value [8]
The present work aimed to study the preparation and characterization of poly [N-isopropylacrylamide (NIPAAm) –co– 2-hydroxy ethyl acrylate (2-HEA)] via DSC, TGA and CHN analysis. The phase transition temperature of NIPAAm-HEA copolymer aqueous solution werestudied by turbidimetric analysis. Copolymer composition was obtained from CHN analysis data monomer reactivity ratios were determined by Fineman-Ros and Kelen – Tudos methods.
Materials and Methods
Materials
N-Isopropylacrylamide (NIPAM) was purchased from TCI (Tokyo, Japan) and purified by recrystallization from n-hexane. 2-hydroxyethylacrylate (2-HEA) and Ammonium peroxodisulfate (APS) were purchased from Sigma (USA). Ethanol was purchased from Altey, Kazakhstan.
Synthesis and Characterization of Copolymers
NIPAAm is dissolved in ethanol. Then initiator is also dissolved in solution of NIPAAm ethanol under continuous stirring. 2-HEA is added to solution to form homogeneous blend. 2, 2′-Azoisobutironitrile (2.10-2M) is used to initiate radical polymerization. The resulting mixture is poured into the glass ampoule and saturated by argon for 10 minutes to remove oxygen. Thus the copolymerization is performed in hermetically sealed glass ampoules at 60oC for 40 min. After that obtained copolymer is precipitated in the mixture of hexane and ethyl acetate (1:1) twice to remove unreacted monomers and dried at vacuum until it becomes powder. Copolymer of NIPAAm with 2-HEA with various ratios of hydrophilic chains (M1=30:70, M2= 40:60, M3=50:50, M4=60:40, M5=70:30 respectively) were synthesized by solution polymerization.
Instrumentation
Glass transition temperature of samples were measured using differential scanning calorimetry (DSC), on a NETZSCH DSC200 PC, using aluminum crimped pans under N2 flow at 20 mL minute-1. The measurements were carried out between -50oC and 200oC at a heating rate of 10oC Minute-1. Thermograimetric analyzer (TGA) was recorded on TGA/SDTA851e, METTLER TOLEDO. The measurements were carried out between 30oC and 898oC at a heating rate of 10oC minute-1. Spectroturbidimetric titration of polymer solutions was carried out at l = 400 nm using «UV-2401-PC Shimadzu» (Japan) spectrophotometer. Temperature control was executed by thermoelectronic controller of curettes «CPS-240A Shimadzu» (Japan). Perkin Elmer CHN-2400 was used for elemental analysis.
Result and Discussions
Differential Scanning Calorimeter (DSC)
Glass transition temperature (Tg) which is an important property for a polymer was determined by Differential Scanning Calorimetry (DSC). DSC thermograms obtained for NIPAAm-co-2-HEA copolymers with composition ratio was M1, M3 and M5 in the temperature range -50-2000C is showed in Figure 1 and respectively, as well as table 1. According to available literature the glass transition temperature of poly(N-isopropylacrylamide) homopolymer has between 85 and 1350C maybe depending on molecular weight while poly 2-HEA has a Tg at -150C [9-12]. The poly(NIPAAm-co-2-HEA) hydrogels would exhibit a single transition between Tg of the two homopolymers. The glass transition temperature of M1 may be due to poly(2-HEA), and Tg of M3, M5 due to poly NIPAAm.
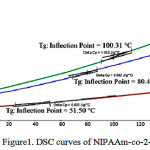 |
Figure 1: DSC curves of NIPAAm-co-2-HEA |
Thermogravimetric Analyses (TGA)
Figure 2 and table 1 summarize the TGA results of poly(NIPAAm-co-2-HEA) with composition ratio was M1, M3 and M5. These TGA’s were performed 300C to 9000C at 100C/min and using N2gas as inert atmosphere. The typical TGA thermograms show there were two decomposition stages. The first weight loss of 10.4 wt.% between 30 and 198oC for M1, 10,95 wt.% between 30 and 2270C and 10.2 wt.% between for M3 and 12,81 wt.% 30 and 221oC for M5 are attributed to the desorption of physically adsorbed water and organic molecules such as residual and impurities from solvents and moisture. TGA showed that copolymers have relatively good thermal stability up to 198°C then the degradation starts till maximum at about 300°C. Of course the temperature for maximum degradation depends on the polymer structure whether the polymer is linear or hyperbranched [13, 14]. The second weight loss occurs between 198 and 9000C. These weight loss could be attributed to the exothermic decomposition of N group and decomposition of other parts of 2-HEA. However, the initial weight loss increased and second weight loss decreased with increasing the ratio of 2-HEA in copolymer.
The maximum polymer degradation temperature (PDTmax) corresponds to the temperature at which the maximum rate of weight loss occurred and appeared at 450,439 and 4200C for M1, M3 and M5. The PDTmax increases as the ratio of 2-HEA with in copolymer structure increases.
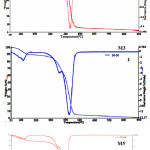 |
Figure 2: TGA curves of NIPAAm-co-2-HEA |
Table 1: Thermal properties of NIPAAm and 2-HEA
| Copolymer |
Tg, (ºC)a |
Temperature decomposition(ºC) b |
Weight loss (%)b |
Residual (%)b |
PDTmax (ºC)b |
LCST (ºC)c |
| M1 |
52,51 |
31,24-198 198-900 |
10,4 87,61 |
89,60 1,98 |
450 |
33 |
| M3 |
80,47 |
31,24-227 227-900 |
10,95 87,06 |
89,05 1,98 |
439 |
37 |
| M5 |
100,31 |
31,12-221 221-858 |
12,81 87,17 |
87,17 0 |
420 |
57 |
a: Determined from DSC Curves
b: Determined from TGA Curves
c: Determined from turbidimetric Curves
Turbidometric method
It should be note HEA homopolymer is high hydrophilic and aqueous solution of there homopolymer do not show LCST [15].
Hydrophobic and hydrophilic groups providing water solubility are part and parcel of thermosensitive polymer macromolecules. Hydrophobic interactions strengthen with temperature rise, as a result, separation into two phases occurs in linear macromolecules. The phase transition of obtained NIPAAm-2HEA copolymers (M1, M2 and M3) aqueous solutions at different temperatures was investigated by turbidimetric method. It can be seen from figure 3 (1,2,3) that the increase in the temperature leads to the rise in solution turbidity, i.e. due to temperature change initial homogeneous system separates into two phases. One of these phases is enriched with polymer, another one is depleted. This is due to the destruction of hydrogen bonds between water and copolymer molecules and the enhancement in hydrophobic interactions. At low temperature hydrophobic interactions are sufficiently strong, i.e. they enable macromolecules to be unassociated in aqueous solutions. However, as temperature rises hydrogen bonds are no longer stable and hydrophobic interactions intensify, which results in phase separation.
According to turbidimetric data, phase transition diagram in figure 3 (4) was plotted for water soluble NIPAAm-2HEA copolymers. It was revealed that the temperature at which phase transition occurs is dependent on feed composition of poly(NIPAAm-co-2HEA). The increase in NIPAAm units in the copolymer brings about the shift in LCST to lower values. Thus, it was proved that LCST is inherent to obtained linear copolymers based on NIPAAm-2HEA and the dependence of copolymer composition and its concentration on turbidity growth was investigated.
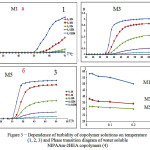 |
Figure 3: Dependence of turbidity of copolymer solutions on temperature (1, 2, 3) and Phase transition diagram of water soluble NIPAAm-2HEA copolymers (4)
|
Reactivity Ratio
Table 2 show the influence of the molar fraction of NIPAAm in the copolymer (m1), mole `fraction of NIPAAm monomer in feed (M1) and nitrogen results of elemental analysis of NIPAAm and 2-HEA comonomers depending on the copolymer composition in free radical copolymerization. The reactivity ratio was calculated using Fineman-Ross (FR) and Kelen-Tudos (KT) method. The signification parameters of FR and KT equation are presented in table 3. The reactivity ratio for NIPAAm (r1) and 2-HEA (r2) from the FR plot (Figure 4) and FT (Figure 5) plot are given in table 3. The value of r1 is less than 1 and r2 is greater than 1. r1 show that NIPAAm favors cross-propagation as opposed to homopropagation and r2 show that 2-HEA favors homopropagation over cross-propagation. r1 and r2 together show that HEA exhibits significantly higher activity in radical copolymerization compared with NIPAAm. The copolymer composition was determined elemental analysis of the copolymer. The kinetic behavior was determined by plotting the mole fraction of NIPAAm in the feed against that in the copolymer (Figure 6)
Table 2: Elemental analysis, mole fraction of monomer in feed
|
Mole fraction of NIPAAm in feed, (M1) |
Mole fraction of 2-HEA in feed, (M2) |
Mole fraction of NIPAAm in copolymers, (m1) |
Mole fraction of 2-HEA in copolymer,(m2) |
F=M1/M2 |
f= m1/m2 |
G=F(f-1) /f |
H=F2/f |
ŋ=G/(α +H) |
ζ=H/( α+H) |
| 30 | 70 | 25,68 | 74,32 | 0,43 | 0,3455 | -0,8146 | 0,5352 | -0,4108 | 0,2699 |
| 40 | 60 | 33,67 | 66,33 | 0,67 | 0,5076 | -0,6499 | 0,8844 | -0,2787 | 0,3792 |
| 50 | 50 | 41,64 | 58,36 | 1 | 0,7135 | -0,4015 | 1,4015 | 0,1409 | 0,4919 |
| 60 | 40 | 49,89 | 50,11 | 1,5 | 0,9956 | -0,0066 | 2,2599 | -0,0018 | 0,6096 |
| 70 | 30 | 58,11 | 41,89 | 2,33 | 1,3872 | 0,65 | 3,9136 | 0,1212 | 0,73 |
| α= (Hmax Hmin)1/2 =1,4473 | |||||||||
Table 3: Fineman-Ross and Kelen-Tudos parameters for the copolymer
|
Mole fraction of NIPAAm monomer in feed |
Elemental analysis |
Mole fraction of NIPAAm in copolymers* |
|||
|
С, % |
H, % |
N, % |
|||
|
NIPAAm (M1) |
NIPAAm (m1) | ||||
| 1 |
30 |
51,19 |
8,12 |
3,12 |
25 |
| 2 |
40 |
51,98 |
8,61 |
4,1 |
34 |
| 3 |
50 |
52,93 |
9,09 |
5,08 |
42 |
| 4 |
60 |
53,3 |
9,36 |
6,1 |
50 |
| 5 |
70 |
53,82 |
9,63 |
7,12 |
58 |
| *Calculated from nitrogen results in copolymers | |||||
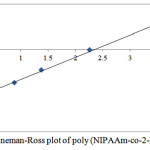 |
Figure 4: Fineman-Ross plot of poly (NIPAAm-co-2-HEA) Click here to View Figure |
Table 4: Copolymerization parameter for the NIPAAm (r1) and 2-HEA (r2)
| Methods | r1 | r2 | r1.r2 |
| Fineman –Ross (FR) | 0,86 | 1,02 | 0,88 |
| Kelen-Tudos (KT) | 0,72 | 1,04 | 0,75 |
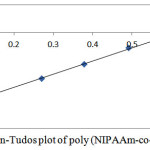 |
Figure 5: Kelen-Tudos plot of poly (NIPAAm-co-2-HEA)
|
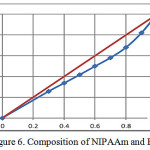 |
Figure 6: Composition of NIPAAm and HEA
|
Conclusion
Linear copolymers based on N-isopropylacrylamide (NIPAAm) and 2-hydroxyethylacrylate (HEA) having different ratio were syntheside in ethanol by free radical polymerization.
It was observed that for obtained novel linear NIPAAm-HEA copolymers exhibit lower critical solution temperature (LCST). Moreover, the cloud point of NIPAAm-HEA copolymers compared with poly-NIPAAm depends on copolymer composition and their concentration in solution. By varying these parameters, it is possible to synthesize copolymers with desired LCST, which suitable for certain applications. Tg of the copolymer increases with increasing of the ratio of NIPAAm in the copolymer. Furthermore, it was found that Tg of the copolymer increases with increasing molecular weight of the copolymer. TGA showed that copolymers have good thermal stability, especially with increasing NIPAAm. The copolymer composition wrer determined from CHN analysis data. The reactivity ratios of monomers were determined by linear methods like Fineman-Ross (r1= 0,86, r2= 1,02) and Kelen – Tudos (r1= 0,72, r2=1,04 ).
References
- Shild H.G., Prog. Polym. Sci. , 1992,17, 163-249.
- Pelton R., Adv. Colloid Interface Sci. 2000, 85, 1-33.
- Kujawa P. and Winnik F.M., Macromolecules. 2001, 34, 4130-4135.
- Zareie H.M., Kim J.D., Polymer, 2000, 41, 6723-6727.
- Hirokawa Y., Rasdug T.I., Macromolecules, 1999, 32, 7093-7099.
- Cole C., Schreiner.S.M, Priest. J.H, Monji N, and Hoffman A.S.; ACS. Symp. Ser. 1987, 350, 245.
- Pitchumani S., Rami Reddy C., Rajadurai S.; Journal of Polymer Science: Polymer Chemistry, 1982, 277–282.
- Polic A. L., Duever T. A., Penlidis A.; Journal of Polymer Science Part A: Polymer Chemistry-1998,20, 36:813.
- Sousa R.G., Magalhaes W.M., Freitas R.F.S.; Polym. Degrad. Stab, 1998, 61, 275-281.
- Allı A., Hazer B.; European Polymer Journal. ,2008, 44 (6) 1701-1723.
- Jones D.S., Brown A.F, Woolfson A.D.; J. Appl. Polym. Sci., 2003, 87, 1016-1026.
- Zhi qiang Cao, Wenguang Liu, Guixiang Ye, Xiaoli Zhao, Xiaoze Lin, Peng Gao, Kangde Yao., Macromol. Chem. Phys. , 2006,207, 2329-2335.
- Kim Y. H., Webster O. W.; 1992. Macromolecules ,2006, 25(21), 5561-5572.
- Lei Ying, E.T. Kang, K.G.; Neoh. Journal of Membrane Science ,2003, 224, 93-106.
- Mun G.A., Yermukhambetova B.B., Urkimbayeva P.I., Bakytbekov R.B., Irmukhametova G.S., Suleimenov I.E.; AASRI Procedia,2012, 3, 601-606.

This work is licensed under a Creative Commons Attribution 4.0 International License.
![]()
A New Edition of Web of Science
Journal Impact Factor
2022: 0.5
Five Year: 0.8
Journal is Indexed in

Cabells Whitelist
![]()


