Isolation Compound Anti-Obesity from the Bark Ara (Ficus Racemosa) of Aceh
Rosnani Nasution1*, Mustanir1, Marianne2 and Iswani Marzuki1
1Department of Chemistry, Faculty of Mathematic and Natural Sciences, Syiah Kuala University, Banda Aceh, Indonesia. 23111.
2Department of pharmacology, Faculty of Pharmacy, Universitas Sumatera Utara, Medan, Indonesia.
Corresponding Author E-mail : rosnani.unsyiah@gmail.com
DOI : http://dx.doi.org/10.13005/ojc/320542
The extract n-hexane and ethyl acetate obtained from plants Ficusracemosa, respectively of 68.50 g (2.28%) and 50.52 g (1.68%), were tested their antiobesity, with dose of 100, 500, 1000 and 1500 mg / kg bw of mice. The results showed that the extract n-hexane and ethyl acetate can weight loss in mice, obtained optimal dose is 1500 mg / kg bwof mice, and used as dosis of next work. Furthermore, 30 g of ethyl acetate extract were fractionated, and yielding three groups of fractions, namely fraction groups A, B and C.Testantiobesity against the fractions A, B, and C were carried out for 5 days each using three mice, can decrease mice weight of average : 2.89%; 2.57%; 0.56%, while 4.14% for positive control, whereas the negative control mice increase weight of mice as much as 4.82%. Fraction A, after separated with chromatography produce a compound suspected of β-amyrin acetate. Compounds β-amyrin acetate at a dose of 1500 mg / kg bw of mice, showed a weight loss of 2.31%. β-amyrin acetate compound was characterized by Mass Spectrometry (MS), Proton Nuclear Magnetic Resonance (1H-NMR) and Fourier Transform Infrared Spectroscopy (FT-IR).
KEYWORDS:anti-obesity; Ficusracemosa; isolation; β-amyrin acetate
Download this article as:| Copy the following to cite this article: Nasution R, Mustanir M, Marianne M, Marzuki I. Isolation Compound Anti-Obesity from the Bark Ara (Ficus Racemosa) of Aceh. Orient J Chem 2016;32(5). |
| Copy the following to cite this URL: Nasution R, Mustanir M, Marianne M, Marzuki I. Isolation Compound Anti-Obesity from the Bark Ara (Ficus Racemosa) of Aceh. Orient J Chem 2016;32(5). Available from: http://www.orientjchem.org/?p=22068 |
Introduction
Obesity (overweight) is one disease that often occurs among children, adolescents and adults. According to the International Obesity Task Force (IOTF) that more than 1.1 billion adults worldwide are overweight and 312 million are obese. Obesity is very dangerous because it can cause a wide range of other diseases such as diabetes, heart disease, stroke and certain types of cancer [1].
One of the plants that have the potential in the medical field is F. racemosa of the family Moraceae, which is used in the system of traditional medicine for diarrhea, dysentery, hemorrhoids, wound healing, skin disorders, diabetes, ulcers, impaired bile, anti bleeding, colds, antioxidants and as well as agents anticancer[2]. The results reported, suggested that F.racemosa compounds containing tannins, saponinsgluanol acetate, betasitosterol, lupeol, lupeol acetate and a-amyrinacetate[3]. Leaf extract of Ficusracemosa Linn. active as an anti-bacterial of Escherichia coli, Basilluspumilis, Bacillus subtilis, Pseudomonas aeruginosa and Staphylococcus aureus[4].
Material and Methods
Plant Material
The bark ofF. racemosa was collected in February 2015 in Aceh, Indonesia. The plant was identified at Department of Biology, University of North Sumatera, Medanense, Medan.
Animal
All experiment were carried out using breeding 4-6 week old male Swiss Webster mice chosen from animal colony of central animal research facility, University of North Sumatera, Medan. The colony was maintained under controlled condition soft temperature.
Spectroscopic Investigation
IR spectrum was found using a Perkin Elmer Spectrum One FT-IR spectrophotometers. Mass spectra were measured using a Shimadzu GC-MS QP 2010 Ultra. The 1HNMR (400 MHz), Spectrum wererecordedon a JEOL in CD3Cl.
Testing Phytochemicals
The method used for testing of phytochemicals can be found in: Phytochemical methods, Simplified Determination Method to Analyze plant [5]
Extraction And Isolation Of β-Amiryn Acetate From The Bark Of F. Racemosa
The air dried of bark of F. racemosa(3 kg) was extracted with hexane for two times in percolator and filtered. The filtrate was evaporated in vacuo to give the dark brown residue, and the yield was 68.50 g. Then the sample was also extracted withethylacetate solvent, and the yield was 50.52 g (extract of ethylacetate). All of these extract were collected separately and preserved for bioassay test and analysis. Antiobesity test results from both of the extracts, the ethyl acetate extract slightly more active from hexane extract, so the isolation and testing activities was directed at the ethyl acetate extract.
Ethylacetate Extract Fractionation
The ethyl acetate extract (30 g) was separated by column chromatography with silica gel (70-230 mesh, 150 g, Merck) as stationary phase and eluted with n-hexane gradually with ethylacetate acetate (100: 0; 98: 2; 95: 5; 90:10; 80:20), to efford 86 fractions by TLC profile.
Fractions (1-16, A) as much as 7.01g, contained terpenoid, fractions (17-34, B) as much as 9.8 g, contained steroid, and fractions (35-86, C) as much as 1.55 g, contained terpenoids. Fraction 1-16 (3 g) was further fractionated using column chromatography (70-230 mesh, 100 g, Merck) eluting with eluent system of n-hexane: ethyl acetate (98: 2; 95: 5; 90:10) to obtain a yellowish white solids were 250 mg (A4). This solid was further fractionated using column chromatography (70-230 mesh, 15 g, Merck) using a system of eluent n-hexane: ethyl acetate (98: 2; 95: 5; 90:10),to obtained a white solid (A44). Furthermore, this pure isolate was tested its antiobesity activity and characterized using 1H-NMR and FT-IR.
Antiobesity activity test
Before use, the mice were acclimatized for 7 days in laboratory conditions as well as getting enough food and drinks. After 7 days, selected mice were healthy, characterized by weight stable or increased and did not show any abnormal behavior. Having fasted for 20-24 hours , the weight of mice were weighed, then mice were divided into 5 groups, each of the groups contain three of mice, group I: obesity control (negative control is given food (pellets) without medication, no given extract or xenical), group II: treated with standard drug, xenical, was given orally at dose of 1500 mg/kg bw of mice), group III, IV, and V: treated with extract of F. racemosa, with dosis 1500 mg/kg bw of mice. Weight measurement is done by weighing the mice every day in five days [7].
Results and Discussion
Phytochemical Test Results
Phytochemical test results of fresh bark F. racemosa and the ethyl acetate extract of F. racemosa showed a class of secondary metabolites, respectively, steroids, terpenoids and saponins.
Antiobesity activity
The test results antiobesityof extract n-hexane and ethyl acetate to mice can be seen in Figure 1.
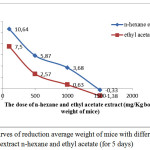 |
Figure 1: Curves of reduction average weight of mice with different doses of the extract n-hexane and ethyl acetate (for 5 days) |
Based on Figure 1 shows that mice fed an crude extract n-hexane and ethyl acetate of with a dose of 100 mg / kg bwof mice, the weight on average increased, respectively by 10.64% and 7.50% , weight is risen because a given dose of the extract is still very low. Mice were given extracts of n-hexane and ethyl acetate at a dose of 500 mg / kg bw of mice, weight of mice increased relatively minor, respectively: 5.87% and 2.57%. Mice that were fed n-hexane crude extract and ethyl acetate extract at the dose of 1000 mg / kg bwof mice, increased weight is relatively smaller, respectively 3.68% and 0.63%. Mice that were fed n-hexane crude extract and ethyl acetate extract rough at doses 1500 mg / kg bwof mice, body weight of rats was reduced by respectively 0.33% and 1.38%. So that this dosage used as a dose of work.
Further testing anti-obesity activity, carried out against a group fraction chromatography results ethyl acetate extract (fraction groups A, B, and C).The test results antiobesity fraction (A, B, C) of the mice are shown in Table 1.
Table 1: Results of testing the activity of anti-obesity of fractions A, B, and C (%)
| Fraction |
The decrease /increase of weight of mice with given fraction A, B, C for 5 days (each 3 mice) (%) |
Average total (%) |
||
|
Mice (I) |
Mice (II) |
Mice (III) | ||
| fraction A |
3.54 |
-3.03 |
-9.19 |
-2.89 |
| Fraction B |
0.16 |
-4.78 |
-3.10 |
-2.57 |
| Fraction C |
-1.61 |
-0.49 |
0.40 |
-0.56 |
| Control (+) |
-0.81 |
-5.86 |
-5.76 |
-4.14 |
| Control (-) |
4.48 |
4.84 |
5.16 |
4.82 |
Note: (+) weight gain in mice
(-) Weight loss in mice
Based on the result of a decrease / increase in the average weight of mice contained in Table 1, can be seen that all fractions A, B, and C, can reduce the body weight of mice. Fraction of A may reduce mice weight (2.89%) is greater than the fraction of B (2.57%) and the fraction C (0.56%). Positive control, xenical can lose weight of mice by an average of 4.14%, while the negative control increase the mice weight of average as much as 4.82%.
Test Antiobesity Pure Isolates (A44) On Swiss Webster Mice
A44 pure isolates can lose weight in mice as much as 2.31%, while Xenical as a positive control to lose weight as much as 4.49%, and the weight of negative control mice rose as much as 4. 31% in the same experiment.
Determination Structure A44
A44 compound, was obtained as a colourless amorphous powder fromethilacetate extract. The 1H NMR spectrum of A44 compound, measured in CDCl3, Characterization of compound A44 with 1H-NMR can be seen in Figure 2.
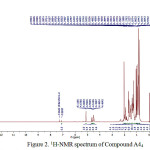 |
Figure 2:1H-NMR spectrum of Compound A44
|
1H-NMR spectrum for proton aliphatic (CH3, CH2 and CH) on triterpenoid compounds shown in chemical shifts (δH) 2 ppm, which is characteristic of proton cyclic of basic framework of triterpenoids that are not separated properly [8]. Compound A44 showed 8 C-methyl chemical shifts (δH ppm) 0.90 (3H, s, H-23); 0.97 (3H, s, H-24); 0.86 (3H, s, H-25); 1.00 (3H, s, H-26); 1.06 (3H, s, H-27); 0.84 (3H, s, H-28); 0.86 (3H, s, H-29); 0.79 (3H, s, H-30).
Acetyl group at chemical shifts (δH ppm) 2.03 (3H, s, H-32), one proton broad multiplet at 4.49,(m,1H) was ascribed to proton of C-3, due to the influence of the electronegativity of O atoms and COCH3 and presence of the olefin proton at δH shift 5.11 ppm (t, 1H), characteristics of the Δ12 (isolated double bonds, order oleanan) [2].
Furthermore, determination of structure of the compound A44 done by comparing the chemical shifts (δH) between compounds A44 with compounds β-Amyrin acetate standard [9]. Data comparison of chemical shifts (δH) compound A44 with β-Amyrinasetat compounds, can be seen in Table 2.
Table 2: Comparison of the 1H-NMR spectrum data of compound A44 (CDCl3, 500 MHz) with standard of β– amyrin acetate compound
|
Position H |
Chemical shift (δH) ppm ( J Hz) |
Position H |
Chemical shift (δH) ppm ( J Hz) |
||
|
A1 |
β– amirin asetat* |
A1 |
β– amirin asetat* |
||
|
1 |
1.28-1.35 (m) |
1.04 -1.64 (m) |
16 |
0.79-1.91 (m) |
0.79 – 1.98 (m) |
|
2 |
1.67 (m) |
1.60 – 1.88 (m) |
17 |
– |
– |
|
3 |
4.49 (t) |
4.50 (t, 8.0 Hz) |
18 |
1.91 (d) |
1.93 (d; 4.2 Hz) |
|
4 |
– |
– |
19 |
1.00-1.67 (m) |
1.00 -1.66 (m) |
|
5 |
0.84 (m) |
0.84 (m) |
20 |
– |
– |
|
6 |
1.54 (m) |
1.40 – 1.53 (m) |
21 |
1.30 (m) |
1.08 – 1.32 (m) |
|
7 |
1.38 (m) |
1.33 – 1.52 (m) |
22 |
– |
– |
|
8 |
– |
– |
23 |
0.90 (s) |
0.88 (s) |
|
9 |
1.54 (m) |
1.58 (m) |
24 |
0.97 (s) |
0.96 (s) |
|
10 |
– |
– |
25 |
0.86 (s) |
0.86 (s) |
|
11 |
1.62 (m) |
1.63 -1.80 (m) |
26 |
1.00 (s) |
0.97 (s) |
|
12 |
5.11 (t) |
5.18 ( t; 3.5 Hz) |
27 |
1.06 (s) |
1.13 (s) |
|
13 |
– |
– |
28 |
0.84 (s) |
0.83 (s) |
|
14 |
– |
– |
29 |
0.86 (s) |
0.88 (s) |
|
15 |
0.86 (m) |
0.85 – 1.76 (m) |
30 |
0.79 (s) |
0.87 (s) |
|
OCH3 |
2.03 (s) |
2.05 (s) |
|||
Table 2 shows that the compound of A44 is similiar with β-amyrin acetate standard. Based on the comparison of the data of the 1H-NMR, this compound is thought to contain the compounds β-amyrin acetate. Chemotaxonomic approach based compounds β-amyrin acetate is also present in plants A. camansi, [10], FicusretusaL.variegata[11],Dorsteniaarifolia[12], which is also a family Moraceae
The above data is reinforced with Mass Spectrometry (MS) spectrum of data, which indicate the presence of β-amyrin acetate compound.
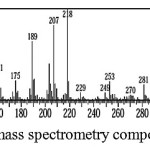 |
Figure 3: Mass spectrometry compound A44
|
From fragmentation of compound ß-amyrin acetate standar , showed molecular ion [H+] m/z:468, 218 , 207, 189 and the 69. Pattern fragmentation 218 shows the breakdown C16H25 [M+] 203 ([CH3M]+). The abundance ion at m/z 218, 203, 189, and 69 are typical for the fragmentation of ß– amyrin acetate [13].
However, the MS spectrum of compound A44 looks a molecular ion at m / z 426 which constitutes the frame of β-amirin [9, 14]. This is because the group COCH3 (m / z 43) was not seen in the data of MS. Characteristic of β-amyrin acetate compound contained in fragment the molecular ion m / z 218 as the base peak [13, 15]. The solving molecular ion β-amyrin compound [15]
Based on the results of data analysis and FT-IR spectrum compound of A44, shows the absorbance of carboxyl groups C-O (ester) at wave number 1241 cm-1. At wave number 1366 cm-1 showed absorbance C(CH3)2 (gem-dimethyl), namely the existence of two methyl groups on the same carbon. At wave number 1735 cm-1 there is absorbance of carbonyl C = O ester (R-CO2-R ‘) and the wave number 2851-2919 cm-1 there is absorbance of C-H (alkyl). Based on comparative data 1H-NMR and Mass Spectra and FT-IR of isolate A44, is suggested isolate A44 as ß-amyrin acetate, which can be seen in Figure 4.
The structure of β-amyrin acetate compound can be seen in Figure 4.
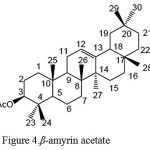 |
Figure 4: β-amyrin acetate |
Conclusion
Based on the results obtained can be concluded that the test results showed F. racemosa extract contains secondary metabolites, terpenoids and steroid group. The crude extract ethyl acetate at a dose of 1500 mg / kg bw of mice, can lose weight by 1.38% .All fractions A, B, and C, can reduce the body weight of rats. Fraction of A may reduce weight of mice as much as (2.89%) is greater than the fraction of B (2. 57%) and the fraction C (0.56%), while A44 pure isolates can lose weight in mice as much as 2.31%.
Characterization of isolates A44 with 1H-NMR, IR and mass spectra, allegedly fraction of A44 is β-amyrin acetate.
Acknowledgments
The author would like to thank the Directorate of Research and Community Service. Strengthening the Directorate General Research and development Ministry of Research, Technology and Higher Education, Indonesia.
References
- Haslam D.W, James W.P.Lancet, 2005, 366 (9492): 209-1197,
- Rawat, P.;Rawat, P.; andKumar, P. Journal Of Drug Discovery And Therapeutics, 20131 (1), 15-18
- Devaraj, K.B.; Gowda, L.R. and Prakash, V.Phytochemistry, 2008, 69(3): 647-655.
- Mandal, C.S; Saha, B.P.; Pal.M.PhytotherapyResearch ,2000, 14(4): 278–280
- Harborne, J. B. Phytochemical Methods, 1987, second edition, London EC4P4EE.
- Triplitt, C.L.,Reasner, C.A., and Isley, W.L. Diabetes Mellitus in editors Dipiro, J. T., Talbert, R.L., Yee, G.C., Matzke, G.R., Wells, B.G., Posey, L.M.Pharmacoterpy A Pathophysiologic Approach, 2005, Sixth Edition, 1335, The McGraw-Hill Companies, New York,
- Fajriaty, I.Tesis, 2014,.InstitutTeknologi Bandung, Bandung,
- Deny, R., danPuji, A. J.K.K.2013, 2(1): 7-12.
- Shan, Y..L.; Thing, C.T.; Ping, S.T.; Awang, K.; Hashim, M. N.; Nafiah, A. M. and Ahmad, K.J. Chem. Pharm. Res., 2014, 6(5):815-822,
- Nasution, R., Marianne.,Nur, H.Der PharmaChemica, 2015, 7(6):71-78.
- Sarg, M. T.; Abbas, A.F.;Taha; El-Sayed, I.Z. and Mustafa, M.A. Journal of Pharmacognosy and Phytotherapy , 2011,. 3(7), 89-100.
- Fingolo, E.C.; Santos, S.T.; Filho, V. M.D.M.and Kaplan, C. A. M. Molecules 2013, 18, 4247-4256; doi:10.3390/molecules18044247
- Fernandes, C.P., Corrêa, A.L., Lobo, F. R., Caramel, O.P., Almeida, F.B., Castro, E.S., Souza, F.C., Burth, P.BioMed Research International,2013, 1-7.
- Bahuguna, Y., Chakraborthy, G.S.World Journal of Pharmacy and Pharmaceutical Sciences, 2014, 3(10): 1168-1188.
- Sigrid, K.K.Thesis, 2009, University of Bergen, Norway.

This work is licensed under a Creative Commons Attribution 4.0 International License.
![]()
A New Edition of Web of Science
Journal Impact Factor
2022: 0.5
Five Year: 0.8
Journal is Indexed in

Cabells Whitelist
![]()


