Fabrication and Characterization of Core/shell ZnO/Gold Nanostructures" and study of their Structural and Optical Properties"
Mina Azimi1, Mirabdolah seyed Sadjadi1* and Nazanin Farhadyar2
1Department of Chemistry, Science and Research branch, Islamic Azad University, Tehran, Iran.
2Department of Chemistry,, Varamin Pishva Branch, Islamic Azad University, Varamin, Iran.
Corresponding Author E-mail: m.s.sadjad@gmail.com
DOI : http://dx.doi.org/10.13005/ojc/320522
ZnO/gold core/shellis a kind of nanostructure which due to having different surface chemistryare formed a new class of gold coated nanoparticles that will be essential for nanoelectronic,biological and catalytic application. The ZnO/gold core/shell nanostructure having novel electrical and optical properties ,and luminescence properties have been exploited for controlling antibacterial system,bio-sensing and bio-detection. In this paper, we report fabrication and characterization of ZnO/gold core/shell nanoparticles by chemical method and Turkevich citrate method.The formation of ZnO/gold nanocomposite can be observed by a change in color from white to gray precipitate.Characterization of the prepared samples was carried out by various techniques such as field emission scanning electron microscopy (FESEM), Elemental analysis (EDS) , X-ray diffraction (XRD) , photoluminescence measurement (PL) ,UV-VIS diffuse reflectance/absorption spectroscopy ,Typical transmission electron microscopy (TEM)and Fourier transform infrared (FTIR). The formation of gold layer on the ZnOsurface can be proved using the results obtained from the UV-VIS , EDS and XRD pattern.
KEYWORDS:ZnO/gold; Turkevich citrate method; synthesis; optical properties
Download this article as:| Copy the following to cite this article: Azimi M, Sadjadi M. S, Farhadyar N. Fabrication and Characterization of Core/shell ZnO/Gold Nanostructures" and study of their Structural and Optical Properties". Orient J Chem 2016;32(5). |
| Copy the following to cite this URL: Azimi M, Sadjadi M. S, Farhadyar N. Fabrication and Characterization of Core/shell ZnO/Gold Nanostructures" and study of their Structural and Optical Properties". Orient J Chem 2016;32(5). Available from: http://www.orientjchem.org/?p=21900 |
Introduction
Gold metal nanostructures such as ZnO/Au are attractive and more interested subject for using ranging from medical diagnostics to optoelectronic devices because of their localized surface plasmon resonance (SPR) emission due to visible light radiation light1,2,3,4,5,6,7. In this process SPR can be created by light induced from free electrons oscillation, leading to the strong scattering and local field enhancement in metallic nanostructures. These emission are characteristics and highly sensitive to the composition, size and morphology of the chosen metal nanostructures. To better understanding the phenomena, we attempted to synthesis of zink oxide nanoparticles via wet chemical method using zink chloride, NaOH in an appropriate amount of a surfactant, CTAB. Gold coating operation was performed by reduction of HAuC14.4H2O by NaBH4 solution. Characterization of the samples was investigated using X-ray powder diffraction (XRD) analysis, Fourier transform infrared spectroscopy (FT-IR), field emission scanning and transmission electron microscopy (FESEM& TEM), UV-Vis and photoluminescence spectroscopy (PL). The dispersive analysis of X-ray (EDAX) data was indicatively prove coexistence of Au and Zn in the prepared sample, showing decrease of Zn/O At % ratio due to the gold coating ZnO.
Experimental
Materials and Method
ZnCl2, NaOH, CTAB, HAuCl4,NaBH4and Na3C6H5O7 were purchased from merck chemical company. Solutions were prepared by dissolving appropriate amount of the compounds in double distilled water. All the other reagents in the experiments were used without further purification except ethanol which was distilled to obtain pure, dry ethanol.Conclusions Zinc oxide coated with gold nanoparticles are prepared using wet chemical method and Turkevich citrate method
Synthesis of ZnO NP
For synthesis of ZnO NP ,first 4 ml of 2M NaOH solution and 0.02mol CTAB were stirred for 30 min in room tempreture then 5ml 1M ZnCl2 solution was added drop by drop and was stirred for 1h in room tempreture.The resulting precipitate was collected, washed with distilled water and ethanol and dried at room tempreture and annealed in an oven at 120 °C for 3-5 h then was placed in furnace at 600°C for 1hour.
Synthesis of ZnO-Au NP with NaBH4
In this stage ,for coating the surface ofzinc oxidenanoparticleswithgold, First 0.1 M HAuCl4.4H2Osolution was prepared in deionized water. Then0.6 g ofZnO NPwere addedtothissolutionand were stirredfor 2 h,then The4mlof0.01 M solutionsodium borohydride (NaBH4 ) sodium was added. The colorwas changedfromwhitetoblue-gray to indicate that theformation ofgold nanoparticles. The samplewas centrifugedandwashedwithdistilled waterandethanolandwere driedat room temperature.
Synthesis of ZnO-Au NP with citrate
For coating the surface ofzinc oxidenanoparticleswithgold, First in a beaker In a flask 20m1 HAuCl4 solution (0.1%) with distilled water was brought to 50ml volume.0.041gr of zinc oxide nanoparticles was dispersed in amount of water by sonication for 10 minutes and was added to the gold solution.Solution was heated to boiling. Then 4ml sodium citrate solution was added. The color was changed from white to gray.The solution was stirred for 2 h. at room temperature until ZnOnanoparticles completely coated by gold. finally precipitate were collected and washed severel times with ethanol and distilled water, and dried at room tempreture.
Results and Discussions
Characterization of Synthesized ZnO-Au NP
FTIR Studies
The FTIR spectrum of the ZnO in the range of 4000-400 cm-1 is shown Fig. 1.a. The band located at 493.82 cm-1 is correlated to the stretching mode of Zn-O [19]. The bands at 1633.76 and 3426.19 cm-1 corresponds to the stretching and bending vibration of O-H. The stretching mode of vibration of C=O and Zn-OH are observed at 2355.18 and 942.78 cm-1respectively. The result of the FTIR spectrum of ZnO nanostructures is generally influenced by particle size and morphology. Fig. 1(b-c) The band located at 417.72 and 437.84 cm-1 are correlated to the stretching mode of Zn-O Which their intensity reduced in comparison with uncoated ZnO. The bands at 3438.36 and 3204.54 cm-1 corresponds to the stretching vibration of citrate O-H for b and c respectively .The Asymmetricstretching vibration of C=O are observed at 1611.72 and 1617.73 cm-1in fig5-b and fig5-c respectively.Thesymmetric stretching vibration of C=O is observed at 1396.67 cm-1 in fig 5-c, There is a slight change in the peaks, all of which confirms the cover by gold nanoparticles and The presence of citrate ions on the surface of the gold nanoparticles as a stabilizer agent.
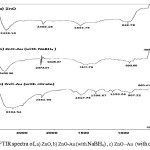 |
Figure 1: FTIR spectra of, a) ZnO, b) ZnO-Au (with NaBH4) , c) ZnO –Au (with citrate)
|
XRD analysis
The XRD pattern of the zinc oxide nanoparticles is shown in Fig.2. All of thepeaks in Figure 2a (ZnO) can be well indexed to the hexagonal structure of ZnOwith high crystallinity. No characteristic peaks of impurities, such as, CTAB , were observed, indicating the high purity of the products.. Using Debye Scherrer’s formula, the crystallite sizes of ZnO nanoparticles can be determined. The average particle size and morphology of as-synthesized zinc oxide nanoparticles are tabulated in Table1. From the figure(2a) are clearly seen the ZnO diffraction peaks )100) ، (002) ، (101) ، (102 ،( (110) ، (103) , (200), (112), (201( at 2 θ= 31.82°, 34.48°,36.30˚,47.59˚, 56.63°,62.91°,66.40°,67.98° ,69.11°, respectively . From the figure(2b,2c)indicates a additional peak at 2Ɵ = 38.22 ° corresponds to the (111) crystal plane of gold.The other two peaks in 44.48°, 64.66° for (200)and (220)crystal plans of gold are too weak and are not clear.The XRD results indicate that the as-synthesized products are core-shell materials with high crystallinity and no other crystalline impurities are observed.The average ZnOcrystallite size, calculated by Sherrer equation from the most intensive peak is peak found to be 40.53, 43.25 and 45.55 nm for the ZnO, ZnO/gold (with NaBH4) and ZnO/gold
(with citrate) samples.clear.comparsion of this peaks indicates that gold intensity in ZnO/gold (with citrate) comparatively stronger than ZnO/gold (with NaBH4 ).
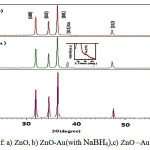 |
Figure 2: XRD spectra of: a) ZnO, b) ZnO-Au(with NaBH4),c) ZnO –Au(with citrate) |
FESEM and EDS Analysis
The surface morphology of the samples obtained by FESEM is shown in the (Figure 3). This figures shows the particle size is uniform distribution,also indicate
granularZnO nanostructures with the diameter in the range of 30-45 nm.
EDS analysis of ZnO/gold confirms the presence of Zn,O and gold, which is shown in Figure 3 . The EDS signal of gold is very uniform in the observed area, indicating the completely random distribution of gold nanoparticle on ZnO surface.As can be seen in ZnO/gold(with citrate) gold peak intensity is stronger than the ZnO/gold(withNaBH4).(Figure 4).
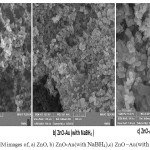 |
Figure 3: FESEM images of, a) ZnO, b) ZnO-Au(with NaBH4),c) ZnO –Au(with citrate) |
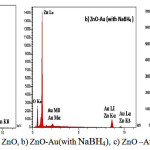 |
Figure 4: EDS of , a) ZnO, b) ZnO-Au(with NaBH4), c) ZnO –Au(with citrate) Click here to View Figure |
Transmission electron microscope (TEM) analysis
Fig-5 shows TEM images of the ZnO and ZnO/goldcore-shell nanoparticles and locates that it has dark points. From these images, formation ofZnO/goldcore/ shell nanoparticles are clear, in which the high contrastdifference between ZnO and gold is distinguishable because ofthe higher electron density of metal gold. [20-21]
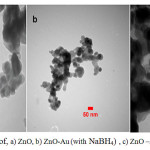 |
Figure 5: TEM image of,a) ZnO, b) ZnO-Au(with NaBH4),c) ZnO –Au(with citrate |
UV-Visible Studies
The UV-vis absorption spectrum of the ZnO and ZnO/goldsamples are shown in Fig. 6.It exhibites a strong absorption band in theUV and visible region,at about 356 nm(a) 561nm(b) 568nm (c).that confirm the presence of these nanoparticles inside the solutions .The absorption peak of ZnO nanoparticles as a semiconductor material was originated from interaction between electrons of valance band and incoming photon, which lead to excitation of these electrons to conduction band. While for ZnO/goldnanoparticl, the sharp absorption peak originated from surface plasmon resonance of electrons inside the conduction band.All the spectra have an absorption maximum at about 360 nm, which is characteristic for ZnO band gap transition[22].The surface plasmon bandof ZnO/goldnanoparticles is distinctly broadened and red-shifted.the size increase of gold particles causes ared shift of the surface plasmon band [23].Thechange of optical properties was then directed to the stronginterfacial coupling between the metal gold and semiconductorZnO parts in the new structure of nanoparticles.
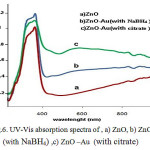 |
Figure 6: UV-Vis absorption spectra of,a) ZnO, b) ZnO-Au(with NaBH4),c) ZnO –Au(with citrate)
|
Optical Studies by Photoluminescence Spectroscopy (PL)
Figure-7 shows the PL spectra of ZnO with an excitation wavelength of 335 nm.. Figure -7 shows the PL spectra of ZnO/gold with an excitation wavelength of 409nm. Normally, in photoluminescence spectra of the zinc oxide nanoparticles observed emission bands in the visible and uv areas. Usually, Uv peak considered as characteristic of the emission of ZnO is attributed to the emission edge strips or exciton transition and emission bands in the visible region of the radiation caused by the recombination of holes with a pregnant photon ionization of defects essential as oxygen vacancies, Zn or impurities are within the network.In all sample of ZnO, uv peak in the spectrum of PL is dominant and peak intensity in the visible region is reduced. In other words, strong exciton emission show that zinc oxide nanoparticles are little deficient. With the increase the concentration of gold nanoparticles, the intensity of the visible emission band decreases.generallythe other emission at approximately 558 nm is commonly attributed to the singly ionized oxygen vacancy in ZnO which is due to the recombination between the electrons in a deep defect level or a shallow surface defect level and the holes in a valence band [24].In addition, the fact that the interfacial interaction between ZnO and gold might lead to charge variation of the gold surface is also the cause of the red shift of the gold surface plasmon band in the ZnO/goldnanoparticales mentioned above.
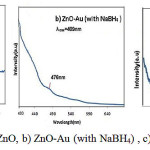 |
Figure 7: PL spectra of, a) ZnO, b) ZnO-Au (with NaBH4) , c) ZnO –Au (with citrate) |
Conclusions
Zinc oxide nanostructure were successfully synthesized via wet chemical method using cetrimonium bromide (CTAB) as a surfactant agent.
Formation of hexagonal shape of zinc oxide even in gold coated zinc oxide nanostructure was confirmed by XRD, FT-IR and FESEM investigations.
Appearance of two new different ZnO bond wavelengths at FTIR spectra instead of only one characteristic broad bond was assigned to the formation of a dumbbell like bond with a short and long size at the superficial region of gold coated ZnO.
UV-visible spectra shows Excitonic absorption peaks for ZnO nanostructure in a wavelength at around 381nm
Energy transfer through the surface plasmon resonance (SPR) of gold nanocrystallites under incident electromagnetic waves in the visible light region increasing exciton electron density in ZnO nanostructure, enhance probability of the relevant emissions
References
- J. Mater. Chem., 2010,20, 6789-6798 DOI: 10.1039/C0JM00817F Received 24 Mar 2010, Accepted 08 Jun 2010 First published online 05 Jul 2010
- Mayer, K. M. & Hafner, J. H. Localized Surface Plasmon Resonance Sensors. Chem. Rev. 111, 3828–3857 (2011).
- Rodriguez-Lorenzo, L., de la Rica, R., Alvarez-Puebla, R. A., Liz-Marzan, L. M. & Stevens, M. M. Plasmonic Nanosensors with Inverse Sensitivity by Means of Enzyme-Guided Crystal Growth. Nat. Mater. 11, 604–607 (2012).
- Zheng, Y. B., Kiraly, B., Cheunkar, S., Huang, T. J. & Weiss, P. S. Incident-Angle-Modulated Molecular Plasmonic Switches: A Case of Weak Exciton-Plasmon Coupling. Nano Lett. 11, 2061–2065 (2011).
- Willets, K. A. & Duyne, R. P. V. Localized Surface Plasmon Resonance Spectroscopy and Sensing. Annu. Rev. Phys. Chem. 58, 267–97 (2007).
- Ozbay, E. Plasmonics: Merging Photonics and Electronics at Nanoscale Dimensions. Science 311, 189–193 (2006).
- Lu, L., Luo, Z., Xu, T. & Yu, L. Cooperative Plasmonic Effect of Ag and Au Nanoparticles on Enhancing Performance of Polymer Solar Cells. Nano Lett. 13, 59–64 (2013).”
- Ismail,H.M.J. Anal.Appl. Pyrolysis.,1991,21, 315
- Link,S.;Burda,C.; Mohamed,M.B.;Nikoobakht,B.;El-Sayed,M.A.J. Phys.Chem. A.1999,103, 1165–1170
- Link, S.;Burda, C.;Nikoobakht, B.;El-Sayed, M.A. J. Phys. Chem. B.2000,104, 6152–6163
- Templeton, A.C.;Pietron, J.J.;Murray, R.W.;Mulvaney, P. J. Phys. Chem. B.2000,104, 564
- Petroski, J. M.; Wang, Z. L.; Green, T. C.; El-Sayed, M. A. J.Phys. Chem. B.1998,102,3316
- Tong, YH.; Liu, YC.;Lu, SX.; Dong, L.; Chen, SJ.; Xiao, ZY.J Sol–Gel.SciTechnol.2004,30,157–161

This work is licensed under a Creative Commons Attribution 4.0 International License.
![]()
A New Edition of Web of Science
Journal Impact Factor
2022: 0.5
Five Year: 0.8
Journal is Indexed in

Cabells Whitelist
![]()


