Effect of Zn Content on the physicochemical Characteristics and Photoactivity of ZnO supported Activated Carbon
Is Fatimah1, Septian P. Yudha2, Kurni Dwi Sopiana2 and Devi Lia Ratnasari2
2Chemistry Department, Islamic University of Indonesia Kampus Terpadu UII, Jl. Kaliurang Km 14, Sleman, Yogyakarta, Indonesia.
Corresponding Author E-mail: isfatimah@uii.ac.id
DOI : http://dx.doi.org/10.13005/ojc/320550
In the present work, synthesis of ZnO dispersed onto activated carbon (ZnO/AC) is reported. Synthesis was conducted by using impregnation method by zinc acetate as precursor at varied Zn content. A systematic characterization of ZnO/C materials was performed using XRD, SEM, gas sorption analyzer and diffuse reflectance UV-Visible spectrophotometer. Photoactivity of the materials was studied in phenol removal via photooxidation mechanism. From the study it is confirmed that ZnO dispersion give acceleration of phenol removal refer to surface area contribution. It is no linear correlation of each physical character to the photocatalytic activity.
KEYWORDS:Activated Carbon; Photocatalyst; Photooxidation; ZnO
Download this article as:| Copy the following to cite this article: Fatimah I, Yudha S. P, Sopiana K. D, Ratnasari D. L. Effect of Zn Content on the physicochemical Characteristics and Photoactivity of ZnO supported Activated Carbon. Orient J Chem 2016;32(5). |
| Copy the following to cite this URL: Fatimah I, Yudha S. P, Sopiana K. D, Ratnasari D. L. Effect of Zn Content on the physicochemical Characteristics and Photoactivity of ZnO supported Activated Carbon. Orient J Chem 2016;32(5). Available from: http://www.orientjchem.org/?p=22624 |
Introduction
Water and wastewater treatment is still the focus in environmental protection. Contamination of organic and dye compounds in aquatic system get interest refer to its potencies from several industrial activities. Several techniques were developed including adsorption, oxidation and photooxidation method. Among some methods applicable for industrial scale, in recent years photocatalytic degradation of pollutant in aquatic system became the advance technique since it can reduce the cost the treatment due to its reusability[1–3]. The main factor in the system is highly active photocatalyst and one of the potential photocatalyts can be elected, ZnO materials have attracted much attention due to their excellent optical properties and facile synthesis methods. ZnO itself has been reported to have activity for photodegradation and photooxidation of some organic molecules[4,5][6][7–9]. Similar to the photocatalytic mechanism of TiO2, the initial step in ZnOphotocatalysis involves the generation of an electron–hole pair (e−/h+), leading to the formation of hydroxyl radicals, superoxide radical anions ( O2·–), and hydroperoxy radicals (·OOH) with following equations[9]:
ZnO+hv→ZnO(h++e–)
H2O(ads)+h+→OH+H+
OH–+h+→OH
O2 + e–→O2·–
O2 + e– + H+→·OOH
Once targeted organic molecule is attacked, radicals formed will oxidize through the mechanisms. In addition to hydroxyl radicals, superoxide radical and the positive holes are species that also possible to oxidize organic contaminants present at/or near the surface. By the mechanism it is also acceptable that as the adsorption of targeted molecule play important role for further step. With the similar value of band gap energy and chemical stability respect to TiO2, the activity of ZnO can be improved by attaching onto a stable and high surface area solid such as activated carbon(AC)[3,6]. Not only by its great specific surface area and low cost, but AC also give synergistic effect on photocatalysis via the strong adsorption properties which is also the controlling factor in photocatalysis[10,11]. From previous research, it is found that the combination of some photocatalyst with AC give synergistic effects[2,12]. There are several methods developed and reported by previous researches. Beside of sol-gel method and the use of organic molecule such as hydrazine as carbon source in the preparation, composite of ZnO and activated carbon was also proposed to be formed by direct infiltration. Similar approximation was also reported for the synthesis of composite from ZnO and carbon black. By the hypothetical condition of ZnO immobilizing onto AC, we report an easy method to obtain ZnO/AC composite photocatalytic material. For photocatalytic purposes, the investigation on the effect of ZnOin At the same time, the photocatalytic efficiency of ZnO/AC composite photocatalytic material was characterized by the effect of Zn content on the photocatalytic activity. The correlation of Zn content to the physicochemical character and photocatalytic activity and also some factors affecting the photocatalytic activity were studied.
Materials and Method
Materials
Zinc acetate dehydrate and activated carbon; the main materials for catalyst preparation, and phenol as target molecule were provided by Merk-Millipore and were used without further purification.
The ZnO/AC was prepared as follows : zinc acetate dehydrate solution was mixed with activated carbon powder with continuous stirring for a night at room temperature. The concentration of zinc acetate dehydrate was set up to the theoretical Zn content of 2.5; 5.0; 7.5 an 10.0 10% wt. The sample was filtered and washed several times with distilled water until the pH values of the solution reached neutral pH, and then dried at 110 8C for 24 h in an oven. The dried sample was clacined at the temperature of 400oC and the solid obtained is designed as ZnO/AC. Refer to varied Zn content, the ZnO/SACs obtained were labeled ZnO/C-2.5; ZnO/C-5.0, ZnO/C-7.5 and ZnO/C-10.0 respectively.
Scanning electron microscope-Energy dispersive X-ray spectroscopy (SEM-EDX JEOL) was used to investigate the morphology and chemical composition of the samples. XRD analysis was performed using X-ray diffractometer (XRD, Rigaku Bench Top-10) with Ni-filtered Cu-Ka radiation. The specific surface area and pore structure of the ZnO/AC photocatalysts were measured by the Brunauer–Emmett– Teller (BET) method using a Micromeritics ASAP 2010 apparatus. Band gap energy of the materials was analyzed by using diffuse reflectance UV-Visible JASCO series. VG 220i-XL EscaLab was utilized for x-ray photoelectronespectroscopy(XPS) spectra identification.
Photocatalytic Study
Photocatalyticstudy of the photocatalysts were performed in phenol photooxidation. For photocatalytic testing a batch photoreactor with the scheme in Figure 1 was utilized. For each experiment, 0.2 g ZnO/AC photocatalyst was mixed with 500 mL of phenol solution in a batch reactor complimented with UV-lamp immersed in solution. During the test, the solution was stirred at 150 rpm. In order to evaluate the photocatalytic activity varied methods were tested involving:
Adsorption
adsorbent addition without UV expose and without H2O2 as oxidant,
Photolysis
without adsorbent, addition with UV expose and without H2O2 as oxidant
Photocatalysis
adsorbent addition with UV expose and without H2O2 as oxidant, and
Photooxidation
adsorbent addition with UV expose and H2O2 as oxidant.
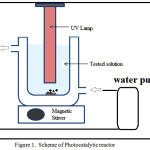 |
Figure 1: Scheme of Photocatalytic reactor |
The amount of phenol (mg/L) at each time interval was calculated according to gas chromatography (GC) analysis. A Buck Scientific Gas Chromatography instrument was used.
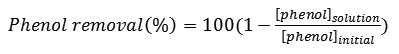
Percentage of phenol removal is calculated based on GC responses with the following equation:
Result and Discussion
Material Preparation
In order to detect the formed ZnO on AC surface, XRD analysis was performed and the data presented in Figure 2. AC show broad and low intensity peaks at around q= 21.8o and 44o as reflections of the graphitic structure of AC[13]. Except for ZnO/AC-2.5 the presence of ZnO can be detected by the peaks of the ZnO nanoparticles wurtzite single phase ZnO (JCPDS Card No. 36-1451) at the 2q of and there is no characteristic peaks of other impurities such as Zn(OH)2 detected in the diffractograms.
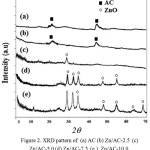 |
Figure 2: XRD pattern of (a) AC (b) Zn/AC-2.5 (c) Zn/AC-5.0 (d) Zn/AC-7.5 (e ) Zn/AC-10.0 Click here to View Figure |
Based on the maximum intensity of the peak, the average diameter of the particles calculated using Scherrer formula is around 25 nm. The SEM image (Figure 3) of the ZnO/AC samples indicates some aggregates formed on surface and the higher Zn content the more aggregates formed
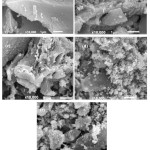 |
Figure 3: SEM Profile of (a) AC (b) Zn/AC-2.5 (c) Zn/AC-5.0 (d) Zn/AC-7.5 (e ) Zn/AC-10.0 Click here to View Figure |
The profiles data is linearly correlated with the surface profile data in Table 1 in which the calculated specific surface area, pore volume and pore radius based on N2 adsorption-desorption data in Figure 4.
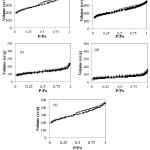 |
Figure 4: Adsorption-desorption Profile of (a) AC (b) Zn/AC-2.5 (c) Zn/AC-5.0 (d) Zn/AC-7.5 (e ) Zn/AC-10.0 Click here to View Figure |
In general, increasing Zn content contributes to the decreasing specific surface area and pore volume data and getting minimum at ZnO/AC-7.5 but then those parameter for ZnO/AC-10.0 are higher than for ZnO/AC-7.5. The trend is related to the formation of aggregates dominantly blocked the pores of activated carbon but then at the Zn percentage of 10%, ZnO aggregates create the accessible surface for adsorbate. The chemical interaction of Zn, O and C is depicted by XPS spectra of ZnO/AC-5 in Figure 5.
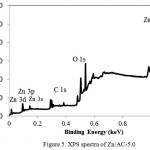 |
Figure 5: XPS spectra of Zn/AC-5.0 |
XPS survey spectra of the composite shows three main peaks as the proof of ZnO/AC composite, one peak at 532 eV corresponding to O 1s, one peak at 285 eV corresponding to C 1s, and two peaks at 1020–1045 eV corresponding to Zn 2p. High resolution scans of the XPS spectra of Zn 2p (1020.2 and 1045.3 eV) are correspond to Zn 2p3/2 and Zn 2p1/2which subhect to Zn–O bonding in ZnO. Futhermore the spectra at 0.500 and 0.506 keV are correspond to Zn LMM auger peak.
As different particle size formed as function of the Zn content, the effect of Zn content on the band gap energy is presented by DRUV-Vis spectra (Figure 6). From the spectra it can be concluded that the higher Zn content in the composite contribute to the red shift with the increasing intensity. This phenomenon is the quantization size effect which caused the longer wavelength due to large particle size. Hence the light absorption and charge separation were significantly enhanced. The same trend was reported in the synthesis of ZnOnanocomposites[14]. As effect of the formation of different particle size of ZnO, multiple band gap values are found for ZnO/AC-7.5 and ZnO/AC-10.0 (Table 1).
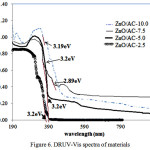 |
Figure 6: DRUV-Vis spectra of materials |
Table 1: Physicochemical character of materials
| Sample | Zn content(%) | Pore Radius (Å) | Specific surface area (m2/g) | Pore Volume (cc/g) |
| AC | n.d | 16.79 | 617.684 | 5.187x 10⁻¹ |
| ZnO/AC-2.5 | 2.57 | 17.48 | 556.644 | 4.865×10⁻¹ |
| ZnO/AC-5.0 | 5.12 | 20.71 | 322.588 | 3.341×10⁻¹ |
| ZnO/AC-7.5 | 7.80 | 24.24 | 176.631 | 2.141×10⁻¹ |
| ZnO/AC-10.0 | 9.98 | 22.24 | 205.768 | 2.288×10⁻¹ |
Photocatalytic Activity
Photocatalytic activity of the materials was tested in varied process; adsorption, photolysis, photocatalysis, and photooxidation. Figure 7 presents the different kinetic of phenol removal over varied process over ZnO/AC-5.0 compared to AC and calculated initial rate of phenol removal by prepared materials is listed in Table 2.
Table 2: Initial rate of phenol removal over varied treatment and catalyst
| Treatment | Initial rate (10-2ppm/mins) | ||||
| AC | ZnO/AC-2.5 | ZnO/AC-5.0 | ZnO/AC-7.5 | ZnO/AC-10.0 | |
| Photocatalysis | 2.23 | 36.61 | 44.64 | 41.50 | 41.14 |
| Adsorption | 2.29 | 1.88 | 1.85 | 1.78 | 1.85 |
| Photooxidation | 19.37 | 41.10 | 77.81 | 48.12 | 67.10 |
| Photolysis | 2.84 | 2.84 | 2.84 | 2.84 | 2.84 |
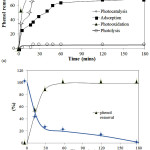 |
Figure 7: (a) Kinetic of phenol removal over varied treatments (Catalyst dosage: 5 g/L; initial concentration: 10ppm, pH = 7) (b) Phenol reduction and COD reduction (Catalyst: Zn/AC-5.0; Catalyst dosage: 5 g/L; initial concentration: 10ppm, pH = 7) (Condition: Catalyst dosage: 5 g/L; initial concentration: 10ppm, pH = 7) |
Degradation of phenol over photooxidation has highest rate as shown by rapid degradation percentage as increasing time of the treatment. In general the degradation rate over varied treatment is in following order: photooxidation>photocatalysis> adsorption> photolysis. From adsorption process it is noted that there is no signicant difference by varying photocatalyst even there is significant difference of specific surface area as main factor in adsorption. It may related to the small amount of the adsorbent. By the additional UV expose in photocatalysis the increasing phenol removal is found. It expresses the role of ZnO in attracting photon and producing the radicals. By comparing with phenol rate from photolysis process it is seen that phenol removal efficiency is encompassed and enhanced with the synergistic effect of both adsorption and photodegradation and with respect to the immobilization of ZnO on the porous structure of activated carbon[6].
In advance the addition of H2O2 as oxidant enhance the rate. Theoretically phenol degradation in solution arises as a result of electron hole-pair formation upon irradiation of the semi-conducting oxide with appropriate light. In case recombination does not occur the electron can move to the surface of the zinc oxide as photoactive agent and combine with absorbed oxygen to form the O2 radicals. The produced electrons from the interaction leads to radicals and superadicals formation by the interaction with oxygen and –OH from the solvent[15]. It has been well established that the presence of oxidant such as H2O2 in the solution will accelerate the radicals formation so the photooxidation has more sufficient reactant for phenol degradation compared to photocatalysis. From the varied photocatalyst in photocatalysis and photo-oxidation processes, it is concluded that ZnO/AC-5.0 has the best activity. The phenol removal from the solution also affects to the reduction of chemical oxygen demand(COD) as expressed in Fig.7b.
 |
Scheme 1 |
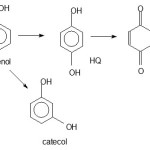
As the proof of different mechanism between photooxidation and photocatalysis is the chromatogram in Figure 8. The result of photo-oxidation and photocatalysis present the other peak as identification of products while adsorption show no other peak except phenol peak. From mass spectrometry analysis the results of photodegradation (photocatalysis and photooxidation) are identified as catechol (CAT) and hydroquinone (HQ) and benzoquione(BQ) refer to following mechanism[16,17]:
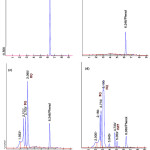 |
Figure 8: Chromatogram of (a) initial solution (b) solution from adsorption treatment (c) solution from photooxidation treatment (d) solution from photocatalysis treatment (HQ: hydroquinone, CAT : catechol, BQ: benzoquinone) Click here to View Figure |
Effect of pH
pH of solution is an important factor influencing the interaction between target molecule and also the photocatalyst. Effect of pH on initial rate of phenol degradation is depicted in Figure 9. From the curve it is concluded base solution increases the degradation rate. Even the zero poin charge of ZnO is 8.9 it is showed that at the pH lower than 8.9 for all catalyst sample the rate is not significantly different. The phenomenon is may related to the photocatalysis mechanism in that the presence of both –OH potentially accelerate the formation of radical and superadical for further oxidation step. In addition the base condition affects to catch H+ from phenol structure. Another possible reason to be confirmed is come from the possible adsorption of OH ¯ onto the surface of the photocatalyst that favors to the formation of hydroxyl radicals, resulting in increasing phenol oxidation[18].
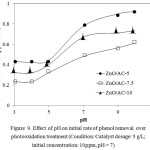 |
Figure 9: Effect of pH on initial rate of phenol removal overphotooxidation treatment (Condition: Catalyst dosage: 5 g/L; initial concentration: 10ppm, pH = 7) Click here to View Figure |
Effect of Catalyst Dosage
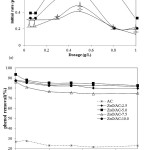 |
Figure 10: (a).Effect of catalyst dosage on initial rate of phenol removal over photooxidation treatment (b) Effect of initial concentration on initial rate of phenol removal over photooxidation treatment (Condition: Catalyst dosage: 5 g/L; pH = 7)
|
Effect of catalyst dosage to the initial rate of phenol removal can be interpreted from curve in Figure 10a. Except for ZnO/AC-2.5, the photocatalysts exhibits the similar pattern of the influence of dosage to the initial rate of phenol removal. Initial rate of phenol removal is reach maximum at 0.5g/L indicating the optimum condition of photocatalysis system at the point. The possible reason for this is that the higher dosage give lower rate because of the limitation of light expose to the solution. The lower intensity of photon the lower rate of radicals formation. However in the utilization of ZnO/AC-2.5 the dosage seems to be insignificantly contribute to the increasing initial rate. The lowest content of ZnO in the photocatalyst the lower rate of radical formation obtained.
Effect of Initial Concentration
Degradation rate of phenol decreases with increasing initial concentration as shown in Figure 10b. The trend is usually found in such organic molecule photooxidation due to generally at higher amount of phenol molecules in solution the more radicals required to make oxidation complete. In relation with the data in Table 2 and the effect of pH it is also confirmed that ZnO/AC-5 give the highest activity.
By confirmation with physicochemical character of photocatalyst what can be concluded is the activity of photocatalyst is influenced by the combination of parameters factor. The highest activity was achieved by ZnO/AC-5.0 while it has similar band gap energy value with other catalysts and it also neither the highest amount of Zn nor the highest specific surface area. The photocatalyst with the highest amount of ZnO (ZnO/AC-10) does not give the highest activity probably due to its lower specific surface area among other and has the lower band gap energy values.
Conclusion
The study presents the preparation of ZnO/ACs expressing photocatalytic activity in phenol removal by photocataysis mechanism. The dispersion give effect to reduce specific surface area of activated carbon and as higher Zn content, ZnO phase is identified. Photocatalytic testing in phenol removal revealed that the specific surface area, band gap energy and Zn content parameters are not individually related to the increasing activity but it is affected by the combination of those parameters. Further photocatalytic modeling is required to get the quantitative relationship.
References
- Bagabas,A.; Alshammari, A.; Aboud,M.F.A.; Kosslick H.; Nanoscale.res.lett., 2013, 8, 516-525.
- Andriantsiferana, C.; Mohamed, E.; Farouk, H. Delmas; Environ.Technol., 2013, 35, 1-9.
- Kyzas, G.Z.; Fu, J.; Matis, K.A.; Materials, 2013, 6,11, 312-337.
- Sobana, N.; Thirumalai, K.; Canadian Chem. Trans., 2016, 4, 77-89.
- Johar, M.A.; Afzal, R.A.; Alazba, A.A.; Manzoor, U.; Nanocomposites, 2015, 1-22.
- Muthirulan, P.; Meenakshisundararam, M.; Kannan, N.; JAdv Res., 2013, 4, 479-484.
- Pung, S.Y. ; Lee, W.P.; Aziz, A.; Int. J. Inorg. Chem., 2012, 1-9.
- Yassıtepe, E.; Yatmaz, H.C.; Öztürk, C.; Öztürk, K.; Durana, C.; J. Photochem.Photobiol. A, 2018, 198, 1-6.
- Daneshvar, N.; Salari, D., ; J.Photochem.Photobiol. A, 2004, 162, 317-322.
- Forgács, E.; Cserháti, T.; Oros, G.; Environ Int., 2014, 30, 953-971.
- Velasco, L.F.; Para,J.B.; Ania, C.O.; Appl. Surf. Sci., 2010,256, 5254-5258.
- Asiltürk, M.; Şener, Ş.; Chem.Eng.J,2012,180, 354-363.
- Zhao,J.; Yang, L.; Li, F.; Yu, R.; Jin, C.;Carbon,2008, 7, 744-751.
- Jradi,K.; Maury, C.; Daneault, C.; Appl.Sci,2015,5(4), 1164-1183.
- Sathe,P.; Myint, M.T.Z.; Dobretsov, S.; Dutta, J.; Sep.Pur.Technol., 2016, 162, 61-67.
- Grabowska,E.; Reszczyńska, J.; Zaleska, A.;Water Res., 2014, 17(46AD),5453–5471.
- Velasco,L.F.; Carmonaa, R.J.; Matos, J.; Ania, C.O.; Carbon.2015,206(73AD),206-2015.
- Soltani,R.D.C.; Rezaee, A.; Khataee,A.; Safari, M.; J. Ind. Eng.Chem., 2014,20, 1861-1868.

This work is licensed under a Creative Commons Attribution 4.0 International License.
![]()
A New Edition of Web of Science
Journal Impact Factor
2022: 0.5
Five Year: 0.8
Journal is Indexed in

Cabells Whitelist
![]()


