Validated HPTLC and Stability Indicating RP-HPLC Methods for the Simultaneous Estimation of Moxifloxacin and Dexamethasone in Bulk and Ophthalmic Dosage Form
1Sri Vasavi Institute of Pharmaceutical Sciences, Tadepalligudem - 534101, India.
2V.V. Institute of Pharmaceutical Sciences, Gudlavalleru - 521356, India.
3Bharat School of Pharmacy, Mangalpalli - 501510, India.
Corresponding Author E-mail: dralrao@gmail.com
DOI : http://dx.doi.org/10.13005/ojc/320433
Download this article as:
![]()
Novel HPTLC and stability indicating RP-HPLC methods were developed for simultaneous estimation of Moxifloxacin (MOX) and Dexamethasone (DEX) in ophthalmic dosage form. For HPTLC method, the separation was carried out on HPTLC aluminum plates using acetonitrile:water:ammonia (8:1:0.5 v/v/v) as mobile phase and developed plates were read at 266 nm. The drugs were resolved satisfactorily with Rf values of 0.09±0.01 and 0.74±0.01 for MOX and DEX, respectively. The RP-HPLC analysis is carried out on Shiseido C18 column (250 mm × 4.6 mm I.D., 5 µm), using 0.02M acetate buffer (pH is 4 adjusted with triethylamine) and acetonitrile in the ratio of 60:40 v/v with a flow rate of 1.2 m/min and the detection was carried out at 254 nm. The retention times were found to be 2.144±0.5 min and 4.732±0.5 min. for MOX and DEX respectively. Developed methods were validated as per ICH guidelines and were found to be within the limits.
KEYWORDS:Moxifloxacin; Dexamethasone; HPTLC; RP-HPLC; Validation
Introduction
Moxifloxacin (Fig. 1) is chemically 7-[(4aS,7aS)-octahydro-1H-pyrrolo[3,4-b]pyridin-6-yl]-1-cyclopropyl-6-fluoro-8-methoxy-4-oxo-1,4-dihydroquinoline-3-carboxylic acid. The bactericidal action of MOX results from inhibition of the enzymes topoisomerase II (DNA gyrase) and topoisomerase IV. DNA gyrase is an essential enzyme that is involved in the replication, transcription and repair of bacterial DNA. Topoisomerase IV is an enzyme known to play a key role in the partitioning of the chromosomal DNA during bacterial cell division1.
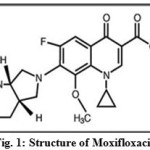 |
Figure 1: Structure of Moxifloxacin |
Dexamethasone (Fig. 2) is chemically 9-fluoro-11β,17,21-trihydroxy-16α-methylpregna-1,4-diene,3,20-dione. The antiinflammatory actions of DEX are thought to involve phospholipase A2 inhibitory proteins, lipocortins, which control the biosynthesis of potent mediators of inflammation such as prostaglandins and leukotrienes2, 3.
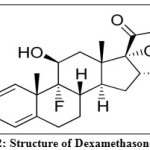 |
Figure 2: Structure of Dexamethasone |
Literature survey reveals that few analytical methods including UV4-8, HPLC9-16 and HPTLC17-19 methods are available for the estimation of MOX and DEX individually and in combination with other drugs. No HPTLC and stability indicating RP-HPLC methods are available for the simultaneous estimation of MOX and DEX. Hence, we made an attempt to develop simple HPTLC and RP-HPLC methods for the estimation of these drugs. Similarly, to establish stability indicating nature of the RP-HPLC method, forced degradation of drug substances was performed under stress conditions (peroxide, acid, base, thermal, UV and neutral hydrolysis). The proposed methods were optimized and validated as per the International Conference on Harmonization (ICH) guidelines20, 21.
Materials and Methods
Chemicals and reagents
MOX and DEX working standards were procured from Yarrow Chemicals Ltd., Mumbai. Commercially available Moxi Mep D eye drops were purchased from the local pharmacy. HPLC grade acetonitrile and methanol were purchased from Merck specialities Pvt. Ltd., Mumbai. HPLC grade water was purchased from Thermo Fisher Scientifics Ltd., Mumbai. Ammonia solution, concentrated hydrochloric acid AR grade, triethylamine, sodium hydroxide pellets purified and hydrogen peroxide 30% AR grade were procured from Merck specialties Pvt. Ltd., Mumbai.
Instrumentation and Analytical Conditions
HPTLC
HPTLC method was performed by using silica gel 60F254 precoated aluminum plates with thickness 2 mm, E-Merck, Germany were used as a stationary phase. The instrument used was CAMAG-HPTLC system comprising of CAMAG LINOMAT-V automatic sample applicator, CAMAG TLC SCANNER with CAT S planner software, CAMAG-UV cabinet and CAMAG twin trough glass chamber with stainless steel lids. The source of radiation was deuterium lamp emitting a continuous UV spectrum between 190-400 nm. The samples were spotted in the form of bands of width 8 mm with a Camag 100 µl sample syringe (Hamilton, Switzerland). A constant application rate 0.1 µl/sec was used with the space between the bands as 14.5 mm. The slit dimension was kept at 6.00 x 0.45 mm and scanning speed was 20 mm/sec.
HPLC
RP-HPLC method was performed on HPLC system (Shimadzu) consisting of binary gradient pump and UV detector (LC-20AD) was employed for analysis. Chromatographic data was acquired using Lab solutions software. Shiseido C18 column (250 mm × 4.6 mm I.D., 5 µm) was used as stationary phase.
Optimized Chromatographic Conditions
Initially different combinations of mobile phases were tried and finally obtained better separation with the mentioned mobile phase combination.
HPTLC
TLC aluminium foiled plates precoated with silica get 60F254 with thickness of 2 mm were used as stationary phase. Acetonitrile:water:ammonia in the ratio of 8:1:0.5 v/v/v solution was used as a mobile phase and the chamber was saturated for 30 min. Amount of mobile phase used was 9.5 ml per run. Sample was applied at a constant rate of 0.1 μl/sec having scan speed 20 mm/sec with 8 mm band width, the samples was separated by ascending technique. The chamber was maintained at 25±0.5ºC temperature and 50-60% relative humidity. The detection was carried out at 266 nm. UV scan showing the overlain spectrum of two drugs is shown in Fig. 3. HPTLC chromatogram showing well resolved peaks can be seen in Fig. 4.
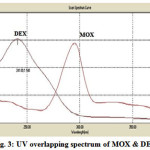 |
Figure 3: UV overlapping spectrum of MOX & DEX |
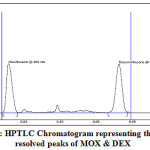 |
Figure 4: HPTLC Chromatogram representing the well resolved peaks of MOX & DEX |
HPLC
The RP-HPLC analysis is carried out using Shiseido C18 column (250 mm × 4.6 mm I.D., 5µm) as stationary phase. 0.02M acetate buffer (pH is 4 adjusted with triethylamine) and acetonitrile in the ratio of 60:40 v/v was used as a mobile phase. The flow rate of 1.2 ml/min. was fixed and the detection was carried out at 254 nm. The summary of system suitability parameters were shown in Table 1. HPLC chromatogram showing well resolved peaks can be seen in Fig. 5.
Table 1: RP-HPLC System suitability parameters
|
Parameter |
Observation* |
|
|
|
MOX |
DEX |
|
Retention time(min) |
2.144 |
4.737 |
|
No. of Theoretical plates |
4029 |
10942 |
|
Tailing Factor |
1.03 |
1.10 |
*Average of six readings
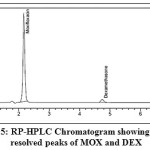 |
Figure 5: RP-HPLC Chromatogram showing well resolved peaks of MOX and DEX |
Preparation of Solutions
HPTLC
Preparation of Mox Stock Solution
MOX standard stock solution containing 100 μg/ml of MOX was prepared by dissolving 10 mg of MOX in 100 ml volumetric flask using methanol:water (50:50 v/v) as solvent.
Preparation of Mox Working Standard
3 ml of above solution was diluted in 10 ml methanol:water (50:50 v/v) to get final concentration of 30 μg/ml. 10 µl was applied as band which contains 0.3 μg/spot.
Preparation of Dex Stock Solution
DEX standard stock solution containing 1000 μg/ml of DEX was prepared by dissolving 10 mg of DEX in 10 ml volumetric flask using methanol:water (50:50 v/v) as solvent.
Preparation of Dex Working Standard
3 ml of above solution was diluted in 10 ml methanol:water (50:50 v/v) to get final concentration of 300 μg/ml. 10 µl was applied as band which contains 3 μg/spot.
HPLC
Preparation of MOX stock solution
MOX standard stock solution containing 100 μg/ml of MOX was prepared by dissolving 10 mg of MOX in 100 ml volumetric flask using water:acetonitrile in the ratio of 50:50 v/v as solvent.
Preparation of DEX stock solution
DEX standard stock solution containing 100 μg/ml of DEX was prepared by dissolving 10 mg of DEX in 100 ml volumetric flask using water:acetonitrile in the ratio of 50:50 v/v as solvent.
Preparation of MOX and DEX working standard mixture
From the above solutions, standard stock solutions were prepared in 10 ml volumetric flask and made up the volume with the mobile phase to get the concentration of 25 µg/ml of MOX and 5 µg/ml of DEX.
Procedure for Forced Degradation Study Using RP-HPLC
Degradation studies were performed in sample solutions containing 25 µg/ml of MOX and 5 µg/ml of DEX.
Acid hydrolysis
For acid degradation, 1 ml of 0.1M, 0.5M, 1M and 2M HCl were added individually to final drug solution in different volumetric flasks and they were refluxed for 1 hr. at 60°C. After 1 h these solutions were injected under optimized chromatographic conditions.
Alkaline hydrolysis
For alkali degradation, 1 ml of 0.1M, 0.5M, 1M and 2M NaOH were added individually to final drug solution in different volumetric flasks and they were refluxed for 1 hr. at 60°C. After 1 h these solutions were injected under optimized chromatographic conditions.
Oxidative degradation
For oxidative degradation, 1 ml of 1%, 3%, 5% and 10% H2O2 were added individually to final drug solution in different volumetric flasks and they were refluxed for 1 h at 60°C. After 1 hr. these solutions were injected under optimized chromatographic conditions.
Photolytic degradation
For photolytic degradation, the final drug solution was kept at a room temperature and exposed to sun light for 8 h. After 8 h, this solution was injected under optimized chromatographic conditions.
Thermal degradation
For thermal degradation, the final drug solution was kept at a temperature of 105°C for 6 hours. After 6 hr. this solution was injected under optimized chromatographic conditions.
Neutral hydrolysis
For neutral hydrolysis, the final drug concentration is refluxed for 1 hr. at 60°C. After 1 hr. this solution was injected under optimized chromatographic conditions.
The stress degradation study was conducted on 1st day, 3rd day and 5th day for the above mentioned solutions and the degradation was studied.
Method Validation
Linearity
The linearity of analytical method is its ability to elicit test results that are directly proportional to the concentration of analyte in sample within a given range.
HPTLC
From the standard stock solution, working linearity range solutions of range 10 μg/ml to 60 μg/ml for MOX and 100 μg/ml to 600 μg/ml for DEX are prepared. 10 μl solutions are spotted on TLC plate to obtain final concentration 100-600 ng/spot for MOX and 1000-6000 ng/spot for DEX. Each concentration was applied five times to the TLC plate. The plate was then developed as per the procedure.
HPLC
From the standard stock solution, working linearity range solutions for RP-HPLC method were fixed as 5-60 µg/ml and 1-12 µg/ml of MOX and DEX respectively are prepared. Twenty microliters of the prepared solutions were injected in triplicate. Linearity was evaluated by regression analysis, which was calculated by the least square regression method.
Accuracy
Accuracy may often be expressed as percentage recovery. Accuracy of the method was carried by applying the method to drug sample to which known amount of MOX and DEX standard drug powder corresponding to 80, 100 and 120 % of label claim had been added for both the methods, mixed and analyzed by running chromatogram in optimized mobile phase.
Precision
The precision of an analytical procedure expresses the closeness of measurements obtained from multiple sampling of the same homogenous sample under the prescribed conditions. Precision may be considered at three levels: repeatability, intermediate precision and reproducibility. The precision of an analytical procedure is usually expressed as the variance, standard deviation or coefficient of variation of a series of measurements.
HPTLC
Repeatability studies were performed by analysis of 300 ng/spot for MOX and 3000 ng/spot for DEX of the drugs six times in three different times on the same day. The intermediate precision of the method was checked by repeating the studies on three different days.
HPLC
Precision of RP-HPLC method were checked by analyzing the samples at different levels (50%, 100% and 150%) at three different time intervals of the same day (intra-day precision) as well as on different days (inter-day precision).
Ruggedness
The ruggedness of an analytical method is determined by analysis of aliquots from homogenous lots by different analysts using operational and environmental conditions that may differ but are still within the specified parameters of the assay. The assay was performed in different conditions, different analysts and different dates.
Robustness
The robustness was studied by evaluating the effect of small but deliberate changes in chromatographic conditions.
HPTLC
Change in mobile phase composition, e.g. acetonitrile: water: ammonia (8.1:1:0.5 v/v/v), (7.9:1:0.5 v/v/v), (8:1.1:0.5 v/v/v), (8:0.9:0.5 v/v/v) were tried and chromatograms were run. The amount of mobile phase varied over the range of ±5%, the time from spotting to chromatography and from chromatography to scanning was varied by +/-10 minutes.
HPLC
The flow rate of the mobile phase was changed from 1.1 ml/min to 1.2 ml/min and 1.3 ml/min. The ratio of the organic phase was changed by ±5%, i.e., 35%, 40%, 45% of acetonitrile. The pH of the mobile phase was changed as 3.5, 4.0 and 4.5. The effect on retention time and peak parameter were studied.
Limit of Detection (Lod)
The limit of detection (LOD) is the smallest concentration that can be detected but not necessarily quantified as an exact value. LOD is calculated from the formula; LOD=3.3σ/S
Where, σ = standard deviation of the response, S = slope of calibration curve
Limit of quantitation (LOQ)
The limit of quantitation (LOQ) is the lowest amount of analyte in the sample that can be quantitatively determined with precision and accuracy. LOQ is calculated from formula; LOQ=10σ/S
Where, σ = standard deviation of the response, S = slope of calibration curve.
Specificity
Specificity of the method was determined by means of complete separation of pure drugs in the presence of other excipients normally present in the formulation.
HPTLC
The specificity of the method was ascertained by peak purity profiling studies. Peak purity of MOX and DEX were assessed by comparing their respective spectrum at peak start (S), peak apex (M) and peak end (E) position of the spots. The specificity was noticed by the complete separation of MOX and DEX peaks. The peak purity of was assessed by comparing their respective spectra at the peak start, apex and peak end positions of the spot.
HPLC
A study to establish the interference of blank and placebo were conducted. Diluent and placebo were injected into the chromatograph in the above chromatographic conditions and the blank and placebo chromatograms were recorded.
Assay of Marketed Formulation
HPTLC
Five different batches of marketed formulations were tried for this purpose. To determine the content of MOX and DEX in the eye drops (Moxi Mep D), which contains 5 mg of MOX and 1 mg of DEX per ml, 1 ml of formulation i.e., eye drops were carefully with drawn and transferred in to a clean and dry 10 ml volumetric flask. The volume was made upto the mark using methanol:water (50:50 v/v) as solvent. The prepared solution contains 500 μg/ml of MOX and 100 μg/ml of DEX.
For the assay of DEX
10 μl of the above solution is applied as band which contains 1 μg/spot of DEX and 20 ng/spot of MOX.
For the assay of MOX
2 ml of the above solution is diluted to 10 ml solvent to get 100 μg/ml of MOX and 20 μg/ml of DEX. 1 ml of this solution is applied which contains 100 ng/spot of DEX and 20 ng/spot of MOX.
In order to have the linearity range within Beer-Lambert’s law limits, the above additional step is taken as the UV absorption of MOX is very high when compared to DEX.
HPLC
Five different batches of marketed formulations were tried for this purpose. To determine the content of MOX and DEX in the eye drops (Moxi Mep D), which contains 5 mg of MOX and 1 mg of DEX per ml, 1 ml of formulation i.e., eye drops were carefully with drawn and transferred in to a clean and dry 100 ml volumetric flask. The volume was made upto the mark using acetonitrile:water (50:50 v/v) as solvent. The prepared solution contains 50 μg/ml of MOX and 10 μg/ml of DEX. Five ml of the above solution was pipette and transferred into 10 ml volumetric flask and diluted to mark with mobile phase to obtain a final concentration of 25 μg/ml of MOX and 5 μg/ml of DEX.
Results and Discussion
HPTLC method
The proposed HPTLC method, allows a rapid and accurate quantitation of MOX and DEX in ophthalmic preparation. The response of the drugs is linear (r2=0.993 for MOX and 0.997 for DEX) over the concentration range of 100-600 ng/spot for MOX and 1000-6000 ng/spot for DEX. The linearity values were tabulated in Table 2. The results of repeatability and intermediate precision were shown in Table 3. The developed method was found to be precise as the RSD values for both the drugs were < 2% respectively as recommended by ICH guidelines. As shown in Table 4, the values showed good recoveries for both the drugs in the range of 98.03-99.07% for MOX and 98.16-100.57% for DEX respectively. The specificity studies of drugs were shown in Fig. 6.
Table 2: Linearity values of MOX and DEX
|
Method |
Parameter |
MOX |
DEX |
|
HPTLC |
Regression equation |
Y=7.672X+464.1 |
Y=935.5X+346.4 |
|
Linearity |
100-600 ng/ml |
1000-6000 ng/ml |
|
|
Correlation coefficient |
0.993 |
0.997 |
|
|
HPLC |
Regression equation |
Y=20594X+18057 |
Y=5193X+1005 |
|
Linearity |
5-60 µg/ml |
1-12 µg/ml |
|
|
Correlation coefficient |
0.998 |
0.998 |
Table 3: Precision values of MOX and DEX
|
Method |
Drug |
Concentration (µg/ml) |
Intra-day ( % RSD) |
Inter-day ( % RSD) |
System precision ( % RSD) |
|
HPTLC |
MOX |
300 ng/spot* |
1.05 |
0.64 |
1.50 |
|
DEX |
3000 ng/spot* |
0.99 |
1.16 |
0.84 |
|
|
HPLC |
MOX |
12.5 |
1.26 |
1.50 |
1.12 |
|
25 |
0.07 |
1.14 |
|||
|
37.5 |
1.56 |
0.10 |
|||
|
DEX |
2.5 |
1.28 |
0.51 |
0.41 |
|
|
5 |
0.24 |
0.07 |
|||
|
7.5 |
0.35 |
0.80 |
*Average of Six readings
Table 4: Recovery values of MOX and DEX
|
HPTLC method |
||||||
|
Drug |
Recovery |
% RSD |
||||
|
80 % |
100 % |
120 % |
80 % |
100 % |
120 % |
|
|
MOX |
98.08 |
99.07 |
99.03 |
1.14 |
0.07 |
0.10 |
|
DEX |
98.16 |
100.57 |
99.78 |
1.28 |
0.51 |
0.24 |
|
HPLC method |
||||||
|
Drug |
Recovery |
% RSD |
||||
|
50 % |
100 % |
150 % |
50 % |
100 % |
150 % |
|
|
MOX |
99.21 |
100.56 |
98.90 |
0.35 |
0.60 |
0.67 |
|
DEX |
98.54 |
100.40 |
100.15 |
0.16 |
0.55 |
0.80 |
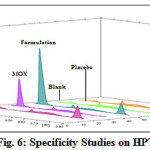 |
Figure 6: Specificity Studies on HPTLC |
The standard deviation of the peak areas was calculated for each deliberate change made and the RSD values were found to be less than 2%. The values were shown in Table 5a & Table 5b, indicated the method is robust. The LOD and LOQ were calculated using the values of slopes and intercepts of the calibration curves for both the drugs (Table 6). The experiments performed by different analysts showed the RSD values less than 2%. This indicates the method is rugged. The peak purity of MOX and DEX was determined by comparing their spectra at peak start, apex and at end positions which are with in the limits. A good correlation (r2=0.997) was obtained between the spectra of MOX and DEX sample and standard without any interferences. The digital response chromatograms were shown in Fig. 7. Experimental results show that the amount of MOX and DEX in eye drops was in good agreement with the labeled claim suggesting no interferences from other excepients. The drug content was found to be 99.60% for MOX and 101.00% for DEX respectively. The values were shown in Table 7.
Table 5a: Robustness parameters of MOX and DEX by HPTLC
|
Parameter |
MOX Peak area (S.D) |
DEX Peak area (S.D) |
MOX % RSD |
DEX % RSD |
|
| Mobile phase composition ( ±0.1 ml) | 27.39 |
34.28 |
0.88 |
1.11 |
|
| Amount of mobile phase ( ±0.5 ml) |
37.85 |
31.58 |
1.22 |
1.02 |
|
| Time from application to development( +10 min) |
22.00 |
22.39 |
0.83 |
0.66 |
|
| Time from development to scanning( +10 min) |
2.49 |
38.85 |
0.08 |
1.15 |
|
Table 5b: Robustness parameters of MOX & DEX by RP-HPLC
|
Parameter |
MOX |
DEX |
|
Rt (min) |
Rt (min) |
|
| Initial Flow |
2.14 |
4.73 |
| Flow 1.1 ml/min |
2.41 |
5.12 |
| Flow 1.3 ml/min |
2.04 |
4.28 |
| Organic phase, 10 % more (35 %) |
2.43 |
6.45 |
| Organic phase, 10 % less (45 %) |
2.09 |
3.73 |
| pH 3.5 |
2.18 |
4.64 |
| pH 4.5 |
2.24 |
4.65 |
Table 6: LOD and LOQ of MOX and DEX
|
Method |
Drug |
LOD |
LOQ |
|
HPTLC |
MOX |
8.572 ng/ml |
25.97 ng/ml |
|
DEX |
0.137 µg/ml |
0.417 µg/ml |
|
|
HPLC |
MOX |
1.09 µg/ml |
3.29 µg/ml |
|
DEX |
0.22 µg/ml |
0.67 µg/ml |
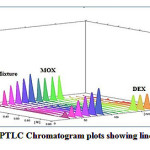 |
Figure 7: HPTLC Chromatogram plots showing linearityClick here to View Figure |
Table 7: Assay data of marketed formulation
|
Method |
Drug |
Amount labeled |
Amount found |
% Label claim |
% RSD |
|
HPTLC |
MOX |
5 mg/ml |
4.98 |
99.60 |
0.54 |
|
DEX |
1 mg/ml |
1.01 |
101.00 |
1.77 |
|
|
HPLC |
MOX |
5 mg/ml |
4.99 |
99.80 |
0.15 |
|
DEX |
1 mg/ml |
0.99 |
99.00 |
0.96 |
HPLC method
Different proportions of acetonitrile and acetate buffer were tried for selection of mobile phase. Ultimately, 0.02M acetate buffer (pH is 4 adjusted with triethylamine) and acetonitrile in the ratio of 60:40 v/v. Typical chromatogram obtained from the analysis of standard solution of MOX and DEX using the proposed method was shown. The elution order was MOX (Rt=2.144 min) and DEX (Rt=4.732 min), at a flow rate of 1.2 ml/min. The chromatogram was recorded at 254 nm.
The calibration curves for MOX and DEX were constructed in the concentration range of 5-60 µg/ml and 1-12 µg/ml of MOX and DEX respectively and the correlation coefficient for both the drugs was found to be nearer to 1. Precision was calculated as inter-day and intra-day variations for both the drugs. Percent relative standard deviations for estimation of MOX and DEX under intra-day and inter-day variations were found to be less than 2. The accuracy of proposed method was determined, indicating an agreement between the true value and found value. The LOD and LOQ were calculated using the values of slopes and intercepts of the calibration curves for both the drugs and for robustness studies in all deliberately varied conditions, percent relative standard deviations were found to be less than 2%. The experimental values obtained for the determination of MOX and DEX in ophthalmic formulation was within the claimed limits. Chromatograms of blank and placebo showed no peaks at the retention times of MOX and DEX peaks. This indicates that the diluent and placebo used in the sample preparation did not interfere in simultaneous estimation of MOX and DEX and hence the method is specific.
Stress Degradation Conditions
The following degradation results were found when MOX and DEX were subjected to,
Acid hydrolysis
MOX showed good stability in acidic conditions compared to DEX. MOX was stable in almost all acidic conditions. It showed appreciable degradation in 2M HCl. DEX show stability in 0.1M HCl, but degraded in other acidic conditions (Fig. 8).
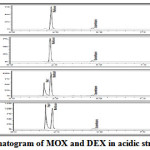 |
Figure 8: Chromatogram of MOX and DEX in acidic stress condition |
Alkaline hydrolysis
MOX showed in stability in 0.1M NaOH. But, the % degradation increased in 0.5M NaOH, 1M NaOH and 2M NaOH. Whereas, DEX showed stability in 0.1M NaOH with degradation in other basic conditions (Fig. 9).
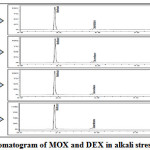 |
Figure 9: Chromatogram of MOX and DEX in alkali stress condition |
Oxidative degradation
MOX showed good stability in peroxide conditions compared to DEX. MOX was stable in 1%, 3% and 5% H2O2. It showed appreciable degradation in 10% H2O2. Both the drugs underwent degradation in appreciable amounts in all peroxide conditions except in 1% H2O2. DEX showed degradation in all peroxide conditions (Fig. 10).
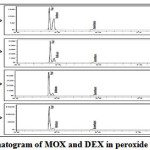 |
Figure 10: Chromatogram of MOX and DEX in peroxide stress condition |
Photolytic degradation
Both the drugs showed good stability under photolytic conditions with very less degradation. DEX showed more degradation in 3rd & 5th day compared to MOX (Fig. 11).
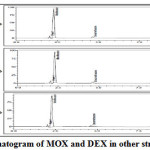 |
Figure 11: Chromatogram of MOX and DEX in other stress conditions Click here to View Figure |
Thermal hydrolysis
Both the drugs showed good stability under thermal conditions with very less degradation (Fig. 11).
Neutral hydrolysis
Both the drugs showed good stability under neutral conditions with very less degradation (Fig. 11).
The percent amount of drug degraded after degradation studies and the Rt of degradation products were given in Table 8a & Table 8b. The pattern of degradation of the drugs individually in different conditions was well portrayed in the Fig. 12.
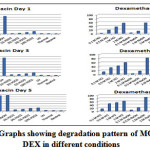 |
Figure 12: Graphs showing degradation pattern of MOX and DEX in different conditions Click here to View Figure |
Table 8. a: Forced Degradation Studies of MOX and DEX
|
Day |
MOX |
DEX |
|||||||
|
Acid Hydrolysis with HCl (%) |
|||||||||
|
0.1 M |
0.5 M |
1M |
2M |
0.1 M |
0.5 M |
1M |
2M |
||
|
Day-1 |
0.10±0.01 |
1.78±0.11 |
4.23±0.35 |
4.98±0.26 |
2.45±0.33 |
20.59±0.98 |
35.35±1.32 |
55.00±1.74 |
|
|
Day-3 |
3.80±0.09 |
4.83±0.14 |
6.88±0.37 |
9.82±0.57 |
12.95±0.59 |
33.56±0.70 |
42.78±1.03 |
61.21±0.88 |
|
|
Day-5 |
4.82±0.22 |
5.38±0.17 |
7.91±0.41 |
11.87±0.11 |
14.05±0.20 |
48.21±0.43 |
52.71±1.66 |
62.67±1.70 |
|
|
Base Hydrolysis with NaOH (%) |
|||||||||
|
0.1 M |
0.5 M |
1M |
2M |
0.1 M |
0.5 M |
1M |
2M |
||
|
Day-1 |
1.10±0.33 |
10.96±0.63 |
64.74±1.16 |
65.58±0.73 |
3.45±0.36 |
15.01±0.61 |
59.09±0.96 |
73.34±1.05 |
|
|
Day-3 |
3.87±0.39 |
13.82±0.69 |
65.82±1.04 |
66.08±0.12 |
4.16±0.37 |
17.09±0.52 |
82.59±1.08 |
99.19±0.51 |
|
|
Day-5 |
6.91±0.17 |
16.68±0.24 |
66.71±0.78 |
68.92±0.67 |
6.89±0.46 |
29.58±0.85 |
86.71±1.28 |
99.38±0.18 |
|
|
Oxidative Hydrolysis with H2O2 (%) |
|||||||||
|
1% |
3% |
5% |
10% |
1% |
3% |
5% |
10% |
||
|
Day-1 |
1.25±0.09 |
2.60±0.35 |
5.60±0.28 |
9.64±0.52 |
5.03±0.64 |
49.42±0.71 |
52.39±0.85 |
62.51±1.00 |
|
|
Day-3 |
3.68±0.12 |
4.68±0.23 |
7.51±0.29 |
11.48±0.38 |
28.38±0.27 |
51.19±1.33 |
38.36±0.75 |
75.82±0.31 |
|
|
Day-5 |
5.52±0.12 |
7.33±0.26 |
11.31±0.47 |
13.82±1.25 |
56.91±1.11 |
58.83±1.20 |
62.05±0.89 |
76.84±0.45 |
|
Table 8. b: Forced Degradation studies of MOX and DEX
|
Other Hydrolysis Methods (%) |
||||||
|
MOX |
DEX |
|||||
|
UV |
Thermal |
Neutral |
UV |
Thermal |
Neutral |
|
|
Day-1 |
1.45±0.48 |
1.49±0.17 |
0.39±0.03 |
6.94±0.13 |
0.59±0.10 |
0.29±0.38 |
|
Day-3 |
2.52±0.16 |
1.68±0.38 |
1.82±0.11 |
9.79±0.42 |
0.79±0.18 |
0.73±0.21 |
|
Day-5 |
3.09±0.43 |
2.21±0.25 |
1.37±0.62 |
15.14±0.61 |
1.92±0.37 |
1.41±0.22 |
*Average of three determinations (each condition), DEG: Degradation, SD: Standard deviation
Conclusion
The developed HPTLC and stability indicating RP-HPLC methods were developed and validated as per ICH guidelines. The standard deviation and % RSD calculated for the proposed methods are low, indicating high degree of precision of the methods. The results of the recovery studies performed show the high degree of accuracy for the proposed methods. The RP-HPLC method could selectively quantitate MOX and DEX in presence of its degradation products hence, it can be employed as a stability indicating method. From the found experimental data it can be concluded that the developed HPTLC and stability indicating chromatographic methods are accurate, precise and selective and can be employed successfully for the estimation of MOX and DEX in ophthalmic dosage form.
Acknowledgements
The authors would like to thank Anchrom Labs, Mumbai and Sri Vasavi Institute of Pharmaceutical Sciences, Tadepalligudem for providing necessary facilities to carry out the research work.
References
- Data base of Moxifloxacin HCl, compilation prepared by drug bank,http://www.drugbank.ca/drugs/DB00218
- Data base of Dexamethasone, compilation prepared by drug bank,http://www.rxlist.com/dexamethasone-drug.htm
- Data base of Dexamethasone, compilation prepared by Rx List,http://www.drugbank.ca/drugs/DB01234
- Renuka, D.N.; Prathyusha, V. Indo Amer. J. Pharm. Res., 2013, 3(7), 5055-5061.
- Singh, D.K.; Verma, R. Iran. J. Pharm. Ther., 2008, 7, 61-65.
- Chothani, D.; Bhalani, J.; Vadaliya, K.R. Inventi Rapid: Pharm Analysis & Quality Assurance, 2013, 2, 1-5.
- Bhalani, J.; Vadalia, K.; Dedania, Z.R. Inventi Rapid: Pharm Analysis & Quality Assurance, 2012, 1, 1-5.
- Dhumal, D.M.; Shirkhedkar, A.A.; Surana, S.J. Anal. Chem. Ind. J., 2013, 12(3), 15-17.
- Sireesha, K.; Prakash, K. Int. J. Pharm. Pharm. Sci., 2012, 4, 415-418.
- Dabhi, M. J. J. Chem. Pharm. Res., 2012, 4, 4462-4467.
- Prakash, K.; Sireesha, K.R. Eur. J. Anal. Chem., 2012, 7(2), 89-95.
- Shadoul, W.A.; Gad Kariem, E.A.; Adam, M.E.; Ibrahim, K.E. Int. J. Chem. Sci. Tech., 2011, 1, 60-69.
- Prakash, K.; Sireesha, K.R.; Shantha K.A. Int. J. Pharm. Pharm. Sci., 2012, 4, 505-510.
- Prakash, K.; Sireesha, K.R. J. Chem., 2012, 9, 1077-1084.
- Razzaq, S.N.; Ashfaq, M.; Khan, I.U.; Mariam, I.; Razzaq, S.S.; Azeem, W. Arab. J. Chem., 2014. In Press.
- Raja, B.; Rao, L.A. Int. J. Pharm., 2013, 3, 621-627.
- Kumar, J.K.M.; Bhanubhai, N.S.; Rathod, S.I. World J. Pharm. Pharm. Sci., 2013, 2, 593-600.
- Seid, Y.; Hymete, A.; Bekhit, A.A. Thai J. Pharm. Sci., 2012, 36, 94-99.
- Vandana, V; Chaudhary, A.K. African J. Pharm. Sci. Pharm., 2010, 1, 74.
- ICH Harmonized Tripartite Guideline, Q2(R1). Validation of analytical procedures: text and methodology. International Conference on Harmonization, Geneva. 2005, 1-13.
- ICH Harmonized Tripartite Guideline, Q1A. Guidance on stability testing: stability testing of new drug substances and new drug products. International Conference on Harmonization, Geneva. 2003, 1-10.


ISSN Online: 2231-5039

![]()


