Sensing of Acetone Vapours using Polymer Composite
S. Devikala, P. Kamaraj* and M. Arthanareeswari
Department of Chemistry, Faculty of Science and Humanities, SRM University, Kattankulathur-603 203, India.
Corresponding Author Email: kamaraj97@yahoo.co.in
DOI : http://dx.doi.org/10.13005/ojc/320461
People may develop a headache, fatigue and even narcosis when the concentration of acetone in air is higher than 10,000 ppm. Hence, detecting and measuring acetone concentrations in the workplace or human body are necessary for our safety and health. Gas sensors play vital role in detecting, monitoring and controlling the presence of hazardous and poisonous gases in the atmosphere at very low concentrations. In the present work, a thick film of composite was prepared by using PMMA and TiO2 (PMTi). Then, the composite’s gas sensing behaviour for acetone vapour was tested by measuring the resistance change of the composite at room temperature. An increase in resistance has been observed with a response time of about ten seconds. The PMMA/ TiO2 (PMTi) composites were characterized by using PXRD, FTIR and SEM. The results show that the thick film of PMTi composite can function as a very good gas sensor for acetone vapours.
KEYWORDS:PMMA; Polymer composite; gas sensor
Download this article as:| Copy the following to cite this article: Devikala S, Kamaraj P, Arthanareeswari M. Sensing of Acetone Vapours using Polymer Composite. Orient J Chem 2016;32(4). |
| Copy the following to cite this URL: Devikala S, Kamaraj P, Arthanareeswari M. Sensing of Acetone Vapours using Polymer Composite. Orient J Chem 2016;32(4). Available from: http://www.orientjchem.org/?p=18978 |
Introduction
Gas detection instruments are increasingly needed for industrial health and safety, environmental monitoring and process control. To meet this demand, considerable research into new type of sensors is underway to enhance the performance of traditional devices. Polymer ceramic composites have superior characteristics and play vital role in gas sensing applications. Composites are materials obtained by bonding two or more materials together. The characteristics of the resulting materials are not that of the components in isolation. Polymer composites which fit into particular engineering applications can be designed by selecting the correct composition and choosing the appropriate manufacturing process1. Piezoelectric ceramics have good detection and output characteristics and thus used as sensors. Pure piezoelectric ceramics are often too stiff and brittle. If piezoelectric ceramic particles are incorporated within a polymer matrix, it will result in composite sensors containing both piezoelectric and visco elastic properties. Electrically conducting organic polymers are important in sensing devices2-4. Polymers used in sensor devices either participate in sensing mechanisms or immobilize the component responsible for sensing the analyte. The emission of gaseous pollutants such as sulphur oxide, nitrogen oxide and toxic gases from related industries has become a serious environmental concern. Thus sensing devices need to be installed in such places. These devices should be cheap, reagentless and able to quantify the levels of gases in a rapid manner, at room temperature with low power consumption5. The room temperature gas sensing property is very attractive for many applications6,7. Acetone is a commonly used chemical reagent in industry, For instance it is used to dissolve plastics, purify paraffin, dehydrate tissues and for pharmaceutical applications. Several techniques have been developed to measure the concentration of acetone, such as gas/liquid chromatographic analysis, spectroscopy and sensors8-10. PMMA/CNT polymer composites 11,12 and conductive polymer composites13 have been developed as sensors.The present work reports the results of the gas sensing behavior of a sensor developed using thick film which shows a maximum response to the test gas at room temperature.
Materials used
Polymethyl methacrylate (PMMA) (Alfa Aesar), Titanium dioxide (TiO2) (Fischer Scientific, India) and Chloroform (CHCl3) (Fischer Scientific, India).All chemicals used were of Analar grade and were used as received from the supplier without further purification.
Preparation of PMTi Composites
A definite quantity of PMMA was dissolved in chloroform followed by the addition of a known quantity of TiO2 and then it was made into a paste in an agate mortar and was subjected to heat at 110 °C for 30 minutes in a hot air oven and made into a powder. PMTi composites were prepared in the following proportions of PMMA and TiO2: PMTi 1 – 9:1, PMTi 2 – 8:2, PMTi 3 – 7:3, PMTi 4 -6:4, PMTi 5 – 5:5 and PMTi 6 – 4:614.
Characterisation Techniques
The X-ray diffraction pattern (XRD) and Scanning Electron Microscopy (SEM) are the basic techniques required to find out the phase and purity of the composite materials. The XRD patterns of polymers and polymer composites were recorded using Philips X’Pert pro diffractometer. The FTIR spectrums of polymers and polymer composites were recorded using Shimadzu FTIR spectrophotometer. The SEM images of polymers and polymer composites were recorded using Hitachi Scanning Electron Microscope SU1510.
Results and Discussion
The XRD pattern for PMMA (Figure 1) show peaks at 2θ 14.50, 22.49, 29.45 and 41.41° and relative intensitites obtained for the polymer match with the JCPDS Card no. 13-0835 file, identifying it as PMMA. The average crystallite size of PMMA is determined using Xpert’ High Score plus software and it is found to be 0.1344 µm.
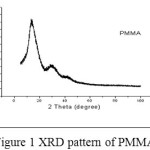 |
Figure 1: XRD pattern of PMMA |
The peak positions (2θ = 25.30 (1 0 1), 38.57 (1 1 2), 48.04 (2 0 0), 53.88 (1 0 5), 62.68 (2 0 4), 70.29 (2 2 0), 75.05 (2 1 5) and 83.16o (3 1 2) and relative intensitites obtained for TiO2 match with the JCPDS Card no. 78-2486 file, identifying it as TiO2 with anatase phase (Figure 2). The average crystallite size is found to be 0.1858µm.
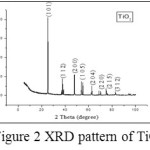 |
Figure 2: XRD pattern of TiO2 |
The XRD patterns of PMTi composites is shown in the (Figures 3(i) – (iii)). From the figures, we can say that the crystallinity of the polymer has been considerably decreased upon the addition of TiO2 and the intensity of the crystalline peaks of PMMA decreases and broadens. This reduction in crystallinity upon the addition of TiO2 is attributed to small particles of TiO2 changes the chain re-organization and facilitates for higher ionic conduction15-19. The average crystallite size is found to be 0.1465 µm.
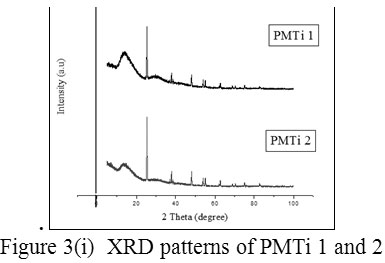 |
Figure 3: (i) XRD patterns of PMTi 1 and 2 |
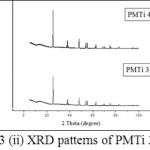 |
Figure 3: (ii) XRD patterns of PMTi 3 and 4 |
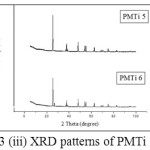 |
Figure 3: (iii) XRD patterns of PMTi 5 and 6 |
An absorption band in the range of 1500-700 cm-1 comes from the -C-O stretching vibration(1270-990 cm-1), -C-H bending vibration (1450-1350 cm-1), and CH2 rocking (810, 750 cm-1) 15. The bands at 1387 and 1456 cm-1correspond to symmetrical bending vibration and asymmetrical bending vibration of methyl group respectively (Figure 4). Broader and stronger bands in the region 1300-1000 cm-1 correspond to C-O stretching vibrations, which usually consists of two asymmetric coupled vibrations, i.e. C-C(=O)-O and O-C-C. Peak at 749 cm-1 corresponds to out of plane C-H bending20. Strong peak appearing in the region 1731 cm-1corresponds to C=O stretching vibrations (Figure 4).
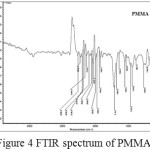 |
Figure 4: FTIR spectrum of PMMA |
In the FTIR spectrum of TiO2 , Ti–O bands in the range of 800-450 cm−1 corresponds to the stretching mode vibration of Ti–O and the peak at 511 cm−1, the characteristic of Ti-O anatase crystalline phase18. The peaks at 550 and 1479 cm-1 corresponds to the stretching vibration of Ti-O and Ti-O-Ti respectively (Figure 5).
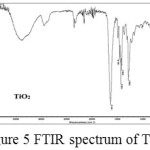 |
Figure 5: FTIR spectrum of TiO2 |
The comparison between the two spectra namely PMMA and the composite PMTireveals that the the shape and position of ester carbonyl groups (C=O stretching mode) expanded in the band (1800-1500 cm-1). The peak position for the C=O stretching (1730 cm-1) in pure PMMA shows slight shifting (1722 cm-1). The shifts in the pure PMMA and pure TiO2 indicate that some interactions have occurred. (Figure 6(i) – (iii)).
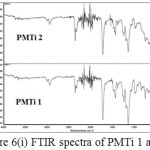 |
Figure 6: (i) FTIR spectra of PMTi 1 and 2 |
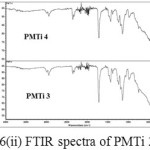 |
Figure 6: ii) FTIR spectra of PMTi 3 and 4 |
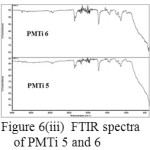 |
Figure 6: (iii) FTIR spectra of PMTi 5 and 6 |
The SEM images of PMMA and PMTi 6 are shown in the figure 7. SEM images reveal the porous nature of polymer composites. Incorporation of TiO2 into the PMMA matrix, reduces the crystallinity and alters the original polymer structure21. When the concentration of ceramic oxides are increased, dark spots are observed in the images which indicate the amorphization of the composites. The dark spot in the SEM image is due to the metal oxide particles. And the area of dark spots increases as the concentration of oxide is increased. It shows the crystallinity of the composites, which decreases as the concentration of oxide increases and it resembles the XRD pattern.
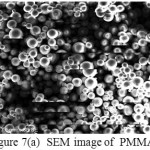 |
Figure 7:(a) SEM image of PMMA |
Response of composites to acetone vapours
The responsiveness, S, of the composites to acetone vapours can be determined from the equation,
S = Rt / Ro
Where Ro is the initial resistance of the sensor value, and Rt is the maximum steady state response value of the sensor when it was exposed to the analyte vapour. In the present study, the vapours of acetone were detected by the sensor. The response time is defined as the time required for the sample resistance variation to reach 90% of equilibrium value following a step increase in the concentration of the testing gas. The resistance, responsiveness and sensitivity of the composite-based sensor obtained from the response and recovery curves are summarized in table 1. The sensing mechanism can be explained on the basis of volume expansion and polar interaction of these vapours on the polymer composite’s surface22. The sample resistance increases in acetone ambience and reaches a saturation at a particular value and the sample resistance decreases in the air ambience. The sensing cycle is reversible upto to two cycles. The sensitivity increases with increasing concentration of TiO2 in the composite samples. The response time of the sensor is found to be 10 seconds while some recent studies report a higher response time23 and the recovery time was 900 seconds. It can be seen from the figure 8 that the response of the sensor is fast and the samples PMTi 6 shows highest sensitivity when compared to other polymer composite samples. This is due to higher proportion of in TiO2 in polymer composites. In order to validate the selectivity of the gas sensor, polymer composite plates were exposed to ammonia and ethanol vapours which do not show any response. The adsorption and desorption mechanism very well works when the sensor is exposed to acetone while the high conductivity of the sensor opts out ammonia and ethanol from sensing them. Hence, the PMTi sensor is selectively sensitive to acetone vapours24-25.
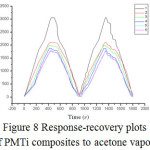 |
Figure 8: Response-recovery plots of PMTi composites to acetone vapour Click here to View Figure |
Table 1 : Sensor response of PMTi composites to acetone vapour
| PMMA/TiO2 composites | Ro MΩ (Initial resistance) | Rt MΩ (Maximum steady state resistance) | Rt/Ro (Sensitivity) |
|
PMTi 1 |
40 |
3056 |
76 |
|
PMTi 2 |
27 |
2094 |
77 |
|
PMTi 3 |
25 |
1984 |
79 |
|
PMTi 4 |
23 |
1876 |
81 |
|
PMTi 5 |
21 |
1800 |
85 |
|
PMTi 6 |
18 |
1760 |
97 |
Conclusions
A gas sensor based on PMTi has been developed and the experimental results are evaluated. The resistance of the polymer composite got extremely increased in acetone vapours and reached equilibrium over time. The addition of TiO2 to PMMA has increased the conductivity of the PMTi composites. The results have shown that PMTi composites have potential application for detecting acetone selectively at room temperature.
References
- Zhang , Z.;Fried rich, K.; Composites Science and Technology 2003, 63, 2029-2044
CrossRef - Ha Seung – Chul; Yang Yoonseok; Kim Yong Shin; Kim SooHyun; Kim Young Jun; Cho Seong Mok, Sensors and Actuators B 2005, 108, 258-264
- Fort, A.; Rocchi, M.; Serrano – santosh, N.; Vlivieri Vignoli; Pioggia, G.; Francesco, F. D.; Sensors and Actuators B 2005, 193, 111-114
- Gallazzi, M . C. J.; Tassoni, L.; Bertarelli , C.; Pioggia, G.; F.; Francesco, D.; Montoneri, E.; Sensors and Actuators B 2003, 88, 178
CrossRef - Kwang – Su Kim , Woon – Hyuk baek , Jung – Min Kim , Tae – Sik Yoon ,Hyun Ho Lee, Chi Jung Keng , Yong – Sang Kim, Sensors 2010, 10, 765
- Ong , K. G.; Zeng , K.; Grimes C. A.; IEEE Sensors J . 2002, 2, 82-88
CrossRef - Philip, B.; Abraham, J. K.; Chandra-sekhar, A.; V. K.; Varadan, Smart Mater. Struct. 2003 129, 935-939
CrossRef - Makisimovich N.; Vorotynstev V.; Nikitina N.; Kaskevich O.; Karabun P.; and Martynenko F.; Sensors and Actuators B: Chem., 1996, 36, 419-421
CrossRef - Deng C.H.; Zhang J.; Yu X .F.; Zhang W.; and Zhang X. M.; J.Chromtogr.B, 2004, 810, 269-275
CrossRef - Deng C .H.; Zhang J.; Yu X. F.; Zhang W.; and Zhang X. M.; J.Chromatogr.B, 2004, 805, 235-240
CrossRef - Feller J.F.; Lu J.; Zhang K.; Kumar B.; Castro M.; Gatt N.; Journal of Materials Chemistry, 2011, 21, 4142-9
CrossRef - Payam Molla-abbasi, Indian Journal of Science and Technology 2015, 8, 1-6
CrossRef - Soo-Keun Lee, Daeic Chang, Sang Wook Kim. Journal of hazardous materials, 2014, 268C, 110-114
CrossRef - Kamaraj, P.; Devikala, S.; and Arthanareeswari, M.; International Journal of Advanced Scientific and Technical Research, 2014, 1, 711-720
- Chen Yang, Ywi Chen, H. C.; Lin, F. C.; Chen, C. C.; Solid State Ionics, 2002, 150, 327-335
CrossRef - Kim, H. S; Kum, K. S.; Cho, I. I. W.; Woncho, B; Rhee, W. H.; Journal of Power Sources, 2003, 124, 221-224
CrossRef - Liu, Y.; Lee, J. Y.; Hong, L.; Journal of Power Sources, 2004, 129, 303-313
CrossRef - Scrosati, B.; Croce, F.; and Panero, S.; Journal of Power Sources, 2001, 100, 93-100
CrossRef - Pradeep Kumar Dubey and Bajpai, R.; Microsystem Technology, 2008, 14, 1165-1171
- Hyeon Suk Shin., Hyeseon Lee., Chi-Hyuck Jun., Young Mee Jung., and Seung Bin Kim.,Vibrational Spectroscopy, 2005, 37, 69-76
- Mriazian.;.and Bahari, A.; Pramana Journal of Physics,2012, 78, 319–331
- Rajendran, S.; and Sivakumar, P.; Physica B.; 2008, 403, 509-516
CrossRef - Philip, B; Abraham, J. K.; chandrasekhar, A.; and Vardan, V. K.; Smart Materials Structure, 2003, 12, 935-939
CrossRef - Wang, L.; Kalyanasundaram K.; Stanacevic M.; Gauma P.; Sensor letter 2010, 8, 709-712
CrossRef - Lalchand A.; Patil Lalita S.; Sonawane, Dhanashri G.; Patil, Journal of Modern Physics, 2011, 2, 1215-1221
- Devikala, S.; Kamaraj, P. Arthanareeswari, M.; .Indira Priyadharshini V.K; International Journal of Advanced Chemical Science and Applications, 2014, 2, 16-21

This work is licensed under a Creative Commons Attribution 4.0 International License.
![]()
A New Edition of Web of Science
Journal Impact Factor
2022: 0.5
Five Year: 0.8
Journal is Indexed in

Cabells Whitelist
![]()


