Relaxation Study of N-Submitted Amides with Alcohol Mixtures by Time Domain Reflectometry
A. Arunkumar1,2, K. Ramachandran3* and K. Samuvel3
1Research and Development Centre, Bharathiar University, Coimbatore-641 046, Tamilnadu, India.
2Department of Physics, Easwari Engineering College, Chennai-600089 , Tamilnadu.
3Department of Physics, Engineering and Technology, SRM University, City campus, Chennai-600026 , Tamilnadu.
Corresponding Author E-mail: kaviramach76@gmail.com
DOI : http://dx.doi.org/10.13005/ojc/320414
Article Received on :
Article Accepted on :
Article Published : 06 Aug 2016
Using Time Domain Reflectometry (TDR), dielectric relaxation studies have been carried out on binary mixtures of amides (N-methylacetamide, N,N-dimethylacetamide with alcohols (1-butanol, 1-pentanol) for various concentrations over the frequency range from 10 MHz to 10 GHz at 303 K. The Kirkwood correlation factor and excess dielectric constant properties were determined and discussed to yield information on the molecular interactions of the systems. The relaxation time is vary with the chain length of alcohols and substituted amides are noticed. The Bruggeman plot shows a deviation from linearity. This deviation was attributed to some sort of molecular interaction which may take place between the alcohols and substituted amides. The excess static permittivity and excess inverse relaxation time values vary from negative to positive for all the systems indicating the solute-solvent interaction to exist between alcohols and substituted amides for all the dynamics of the mixture.
KEYWORDS:correlation; substituted amides; viscosity
Download this article as:| Copy the following to cite this article: Arunkumar A, Ramachandran K, Samuvel K. Relaxation Study of N-Submitted Amides with Alcohol Mixtures by Time Domain Reflectometry. Orient J Chem 2016;32(4). |
| Copy the following to cite this URL: Arunkumar A, Ramachandran K, Samuvel K. Relaxation Study of N-Submitted Amides with Alcohol Mixtures by Time Domain Reflectometry. Orient J Chem 2016;32(4). Available from: http://www.orientjchem.org/?p=20172 |
Introduction
Alcohols are versatile organic liquids used in chemical industries as solvents for oils, resins and antifreeze for explosive. Amides are the simplest molecules containing a peptide linkage and a study of their hydrogen bonding ability yields insight into the nature of protein structure [1]. The dielectric relaxation study of solute-solvent mixtures in the microwave frequency range gives information about the molecular polarization of the system. This is related to formation of multimers in dipoles and their rotations. The earliest studies on the dielectric relaxation processes of mono alcohols [1-3] established that the magnitude of the primary dispersion is much greater than that of higher dispersion and has linear relaxation time which is attributed to the linear bond chain multimers [4]. The formation of a linear hydrogen bonded chain changes according to the amount of shielding of the hydroxyl group or to the steric hindrance of the alkyl groups. Addition of electron donating molecules would modify the structure packing and volume of the relaxing systems. There are many studies of the dielectric behaviour of alcohol mixture with structure breaking and structure making [5-11]. Sivagurunathan et al. [12-16] has investigated the complex formation of alkyl methacrylates with proton donors (primary alcohols) in non-polar solvents at 298 K using FTIR spectroscopic method. The complex formation has been interpreted in terms of the association equilibrium constant. Patil et al. [17] reported the dielectric parameters for aniline – alcohol mixtures using the time domain technique. Dielectric parameters for dimethylsulphoxide-alcohol and dimethylformamide – alcohol mixtures were reported by Khirade et al. [18, 19] using TDR. Chaudari and Mehrotra [20] reported the dielectric parameters for pyridine-alcohol mixtures using time domain reflectometry. The present paper reports the dielectric relaxation studies of N-methylacetamide and N,N-dimethylacetamide with alcohols mixture using Time Domain Reflectometry technique in reflection mode at 303K.
Exprimental
AR grade N-methylacetamide (NMA) and N,N-dimethylacetamide (DMA), AnalaR grade alcohols (1-butanol, 1-pentanol) were purified by standard methods [21]. The solutions were prepared at different volume percentage of N-methylacetamide and N,N-dimethylacetamide in alcohols from 0% to 100% in steps of 10%, at 303 K.
The apparatus used in this study was the Tektronix 7854 sampling oscilloscope with 7S12 TDR unit. In this apparatus, a fast rising step voltage pulse of 200mV amplitude and 25 p s rise time with repetition frequency of kHz is generated by tunnel diode and is propagated through a coaxial transmission line. The sample is placed at the end of the coaxial transmission line in a Standard Military Application (SMA) coaxial cell. The SMA cell used for this had 3.5mm outer diameter and 1.35mm effective pin length. The step pulse generated by tunnel diode and the pulse which is reflected from the sample cell were sampled by sampling oscilloscope in the time window of 5 ns. The reflected pulse without sample R1 (t) and with then sample RX (t) were digitized into 1024 points in the oscilloscope memory and then transferred to PC/XT through GPIB.
The temperature controller system with water bath and a thermostat has been used to maintain the constant temperature within the accuracy limit ±10C. The sample cell is surrounded by a heat insulating container through which the water of constant temperature using a temperature controller system is circulated. The temperature at the cell is checked using the electronic thermometer.
Data Analysis
The time dependent data were processed to obtain complex reflection coefficient spectra ρ*(ω) over the frequency range from 10 MHz to 10 GHz using Fourier transformation [22, 23] as
![]()
where p(ω) and q(ω) are Fourier transforms of (R1(t) – Rx(t)) and (R1(t) + Rx(t)), respectively, c is the velocity of light, ω is angular frequency, and d is the effective pin length.
The complex permittivity spectra ε*(ω) were obtained from reflection coefficient spectra ρ*(ω) by using the bilinear calibration method [24]. N-methylacetamide, N,N-dimethylacetamide and the respective alcohol were used as calibrating liquids. The experimental values of ε* are fitted with the Debye equation [25]
![]()
with ε0, ε∞, and τ as fitting parameters. A nonlinear least squares fit method [26] was used to determine the values of dielectric parameters.
Results and Discussion
The values of static dielectric constant (ε0), dielectric constant at high frequency (ε∞), the relaxation time (τ) and the effective Kirkwood correlation factor (geff) for binary mixtures of different concentrations (0, 10, 20, 30, 40, 50, 60, 70, 80, 90 and 100 vol. %) of alcohols
(1-butanol, 1-pentanol) with amides (NMA and DMA) at 298 K are provided in Tables 1-6.
Table 1: Dielectric data for the binary mixtures of 1-butanol with amides.
|
Volume % of 1-butanol |
NMA |
DMA |
|
ε0
|
||
|
0 |
166.57 |
38.47 |
|
10 |
162.45 |
36.99 |
|
20 |
159.52 |
32.80 |
|
30 |
151.40 |
31.55 |
|
40 |
143.29 |
30.10 |
|
50 |
135.17 |
28.99 |
|
60 |
117.05 |
23.01 |
|
70 |
98.94 |
20.28 |
|
80 |
70.82 |
18.99 |
|
90 |
43.71 |
17.33 |
|
100 |
14.59 |
14.59 |
|
e¥
|
||
|
0 |
3.78 |
2.93 |
|
10 |
3.57 |
2.84 |
|
20 |
3.35 |
2.80 |
|
30 |
2.96 |
2.75 |
|
40 |
2.78 |
2.67 |
|
50 |
2.67 |
2.56 |
|
60 |
2.48 |
2.35 |
|
70 |
2.37 |
2.26 |
|
80 |
2.31 |
2.20 |
|
90 |
2.29 |
2.18 |
|
100 |
2.75 |
2.75 |
|
τ (ps)
|
||
|
0 |
119.38 |
14.95 |
|
10 |
129.12 |
50.10 |
|
20 |
137.93 |
80.01 |
|
30 |
140.24 |
91.42 |
|
40 |
149.68 |
110.54 |
|
50 |
155.66 |
142.10 |
|
60 |
172.52 |
155.28 |
|
70 |
188.37 |
165.61 |
|
80 |
205.72 |
189.17 |
|
90 |
228.16 |
199.14 |
|
100 |
342.30 |
342.30 |
|
geff
|
||
|
0 |
0.98 |
0.97 |
|
10 |
1.46 |
1.17 |
|
20 |
1.51 |
1.29 |
|
30 |
1.55 |
1.36 |
|
40 |
1.69 |
1.50 |
|
50 |
1.72 |
1.59 |
|
60 |
1.77 |
1.75 |
|
70 |
1.88 |
1.82 |
|
80 |
1.95 |
1.89 |
|
90 |
1.98 |
1.95 |
|
100 |
2.10 |
2.10 |
Table 2: Dielectric data for the binary mixtures of 1-pentanol with amides.
|
Vol. % of 1-pentanol |
NMA |
DMA |
|
ε0
|
||
|
0 |
166.57 |
38.47 |
|
10 |
160.41 |
35.97 |
|
20 |
157.50 |
31.57 |
|
30 |
150.38 |
30.15 |
|
40 |
141.27 |
29.18 |
|
50 |
132.15 |
27.98 |
|
60 |
111.15 |
22.15 |
|
70 |
95.95 |
19.39 |
|
80 |
69.88 |
18.98 |
|
90 |
40.75 |
17.12 |
|
100 |
13.90 |
13.90 |
|
e¥
|
||
|
0 |
3.78 |
2.93 |
|
10 |
3.59 |
2.87 |
|
20 |
3.38 |
2.83 |
|
30 |
2.99 |
2.79 |
|
40 |
2.80 |
2.69 |
|
50 |
2.60 |
2.59 |
|
60 |
2.50 |
2.37 |
|
70 |
2.39 |
2.29 |
|
80 |
2.35 |
2.25 |
|
90 |
2.30 |
2.20 |
|
100 |
2.69 |
2.69 |
|
τ (ps)
|
||
|
0 |
119.38 |
14.95 |
|
10 |
135.75 |
52.11 |
|
20 |
145.79 |
82.12 |
|
30 |
150.11 |
92.45 |
|
40 |
162.67 |
112.48 |
|
50 |
170.68 |
143.15 |
|
60 |
214.29 |
156.29 |
|
70 |
225.48 |
167.65 |
|
80 |
239.18 |
190.18 |
|
90 |
330.48 |
330.54 |
|
100 |
612.71 |
612.71 |
|
geff
|
||
|
0 |
0.98 |
0.97 |
|
10 |
1.49 |
1.21 |
|
20 |
1.58 |
1.30 |
|
30 |
1.57 |
1.39 |
|
40 |
1.60 |
1.55 |
|
50 |
1.78 |
1.60 |
|
60 |
1.91 |
1.79 |
|
70 |
2.38 |
2.15 |
|
80 |
2.42 |
2.31 |
|
90 |
2.47 |
2.40 |
|
100 |
2.61 |
2.61 |
It is observed from the Tables 1-6 that, the εo, ε∞, τ, and geff values of alcohols with amides mixtures (10%, 20%, 30%, 40%, 50%, 60%, 70%, 80% and 90%) lie between the individual values of pure alcohols and amides. This result indicates the existence of molecular association between the alcohol and amide molecules. Similar results were reported by Kroeger [27] and Ritzoulis and Fidantsi [28] for DMA-alcohol mixtures. The values of εº, ε∞, τ, and geff increase as the percentage of alcohol in amides increases for all the systems. This suggests that the intermolecular association is taking place in all these systems. Similar results were reported by Khirade et al.,[18] for DMF-alcohol mixtures. It can be seen from Tables 1-6 that, the values of εo and ε∞for pure alcohols and amides and binary mixtures of alcohols with amides are in the order: 1-butanol > 1-pentanol for concentrations studied. This trend can be ascribed to the decrease of dipoles per unit volume with an increase in the size of the alcohol molecules. This observed result is in close agreement with the investigation of Patil et al., [17] for aniline with ethanol, 1-propanol, 1-butanol, 1-hexanol and 1-heptanol systems. Further, they have reported that the decreasing trend of εo and ε∞ values can be attributed to decrease in the number of dipoles in the mixture, which may lead to the decrease in the molar volume of the rotated molecule.
It is observed from the Tables 1-6 that, the values of τ for pure alcohols and amides and binary mixtures of alcohols with amides increase in the order: < 1-butanol < 1-pentanol . This indicates that the higher alkyl chain length of alcohols hinders the rotation of the molecule which leads to increasing relaxation time are noticed. This may be linearly correlated with the variations of viscosity and molecular size of the alcohols. From this result, it may be concluded that the strength of hydrogen bonding is linearly increased with chain length of alcohols. Similar conclusions were drawn by Balamurugan et al., [29] for triethylamine and pyridine with alcohols (1-hexanol, 1-heptanol and 1-octanol) systems. The alcohols with NMA have higher t values than the DMA. This may be due the variation of inductive effect in secondary and tertiary amides. Similar results were reported by Kalaivani et al., [30] for NMA and DMA with acetonenitrile systems.
The information about the solute–solvent interaction is also given by the Bruggeman factor. The effective volume of the solute gets modified by solute–solvent interactions and is best illustrated by the non-linearity of the Bruggeman formula [31].
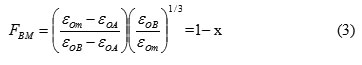
The Bruggeman factor may be used as an indicator of solute-solvent interaction. The Bruggeman plots of volume fraction of alcohol Vs Bruggemann factor (FBM) for alcohols-amides mixtures are given in Fig 1. It can be seen from these figures that FBM is not a linear function of volume fraction of alcohol. The observed results indicate the existence of an intermolecular association between O-H group of alcohol and C=O group of amide. Similar interpretations are given by Rana and Vyas [32] for aniline with alcohols.
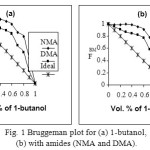 |
Figure 1: Bruggeman plot for (a) 1-butanol, (b) with amides (NMA and DMA). |
The excess parameters related to ε0 and τ provides valuable information regarding interaction between the polar-polar liquid mixtures. These properties are also useful for detection of the cooperative domain in the mixture and may evidence the formation of multimers in the mixture due to intermolecular association.
The structural information about the liquids from the dielectric relaxation parameter may be obtained using the Kirkwood correlation parameter [33]. This factor is also a parameter for obtaining information regarding orientation of electric dipoles in polar liquids. The g for the pure liquid may be obtained using the expression
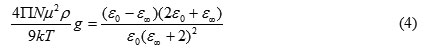
where μ is the dipole moment in the gas phase, ρ is the density at temperature T, M is the molecular weight, k is the Boltzmann constant, and N is Avogadro’s number. For the mixture of two polar liquids A and B, eq 3 is modified [34] using the following assumption:
(1) Assume that, for the mixture, geff is the effective correlation factor in the mixture. The Kirkwood equation for the mixture may be expressed as
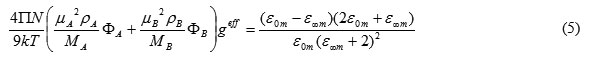
where geff is the effective Kirkwood correlation factor for a binary mixture, with фA and фB as the volume fractions of liquids A and B, respectively.
The calculated values of geff using eq(5) for all the systems at different concentrations are given in Tables 1-6. The geff value for pure amides is less than to unity, indicating the antiparallel orientation of dipoles and for alcohols, the geff values higher than unity are observed in the present study suggesting that the parallel alignment of the electric dipoles Patil et al., [17]. For mixtures, the geff values higher than one for different percentages of alcohols with amides increase with alcohol concentration recorded in the present study confirming the intermolecular association exists between alcohols and amides is significant Pieruccini and Saija [35].
The information related to solute–solvent interaction may be obtained by excess properties [36] related to the permittivity and relaxation times in the mixture. The excess permittivity εE is defined as
![]()
where X is the mole fraction and suffix m, A, B represent mixture, solute and solvent. The excess static dielectric constant may provide qualitative information about multimer formation in the mixtures as follows:
i) εE = 0 indicates the liquid A and liquid B do not interact at all.
ii) εE <0 indicates the liquid A and liquid B interact in such a way that the effective dipole moment gets reduced. The solute and solvent may form multimers leading to the less effective dipoles.
iii) εE > 0 indicates the liquid A and B interact in such a way that the effective dipole moment increases.
Similarly, the excess inverse relaxation time is defined as
![]()
where is the excess inverse relaxation time which represents the average broadening of dielectric spectra . The information regarding the dynamics of solute-solvent interaction from this excess property is as follows:
(i) = 0: There is no change in the dynamics of solute-solvent interaction.
(ii) < 0: The solute-solvent interaction produces a field such that the effective dipoles rotate slowly.
(iii) > 0: The solute-solvent interaction produces a field such that the effective dipoles rotate quickly, i.e., the field co-operate in the rotation of the dipoles.
The variation of excess permittivity (εE) with volume percentage of alcohols in amides is shown in Fig. 2. For lower alcohol region, positive deviations (εE) is noticed and are shown in Fig. 2, and this may be due to the amide molecules which may dissociate the alcohol molecules resulting in more monomeric species of alcohols and increase the total number of dipoles. In the increasing concentrations of alcohol, a negative (εE) deviation is noticed. This indicates the formation of multimer through hydrogen bonding, which leads to a decrease in total number of dipoles in the systems studied. This observation is in agreement with the results of Pawar and Mehrotra [37] for DMF with chlorobenzene mixtures.
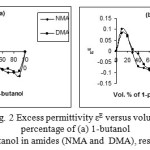 |
Figure 2: Excess permittivity εE versus volume percentage of (a) 1-butanol (b) 1-pentanol in amides (NMA and DMA), respectively. Click here to View Figure |
The variation of excess inverse relaxation time ((1/τ)E) with volume percentage of alcohols in amides are shown in Fig. 3. The (1/τ)E of these system are positive in the lower alcohol region. This indicates a fast rotation of the dipoles. This may be due to formation of monomeric structures in this system. In the alcohol rich region these (1/τ)E values are negative. This suggest that the formation of multimer through hydrogen bonding, resulting in a slow rotation of dipoles. Similar results were reported by
Helambe et al., [38] for n-nitriles-methanol systems.
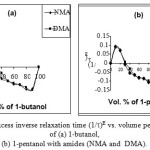 |
Figure 3: Excess inverse relaxation time (1/t)E vs. volume percentage of (a) 1-butanol, (b) 1-pentanol with amides (NMA and DMA). Click here to View Figure |
It also follows from Figs. 2-3 that the NMA-alcohol systems have higher εE and lower (1/τ)E values than that of DMA-alcohol systems because of the inductive effect of the methyl group of amides increases in the order methyl to dimethyl, and the electron contribution of the methyl group to the C-O group is significantly greater than that from the dimethyl group. Also the 1-decanol-amide systems have lower εE and higher (1/τ)E negative values than that of 1-butanol-amide, 1-pentanol-amide systems, revealing that the tendency of complex formation is stronger in 1-pentanol than that of 1-butanol. Because of steric hindrance, it is likely that long chain alcohols will have greater probability of complex formation due to head tail linkage, whereas for relatively smaller alcohols, the tendency is weakened due to switching mechanism prevalent in alcohol system [25]. Therefore, one would expect that the strongest intermolecular hydrogen bonds would be formed between the C-O group of NMA and the OH proton of 1-pentanol and the weakest between the C-O group of NMA and OH proton of 1-butanol and similar results are obtained in case of DMA-alcohols systems [15]. This is reflected in the dielectric constant, the relaxation time, the Kirkwood correlation factor, and inverse relaxation time values.
A comparative study of the plots of the systems gives some idea about the strength of the interaction in the mixtures. For the systems of alcohols with the amides considered here, the existence of the intermolecular hetero interaction is in the following order: 1-butanol <1-pentanol.
Conclusion
The dielectric constants, the relaxation times, the Kirkwood correlation factors, and inverse relaxation times for amides with alcohols mixtures of various concentrations have been reported. The dielectric parameters show systematic change with concentration and alkyl chain length alcohols and substituted amides. The excess static permittivity and excess inverse relaxation time values are negative and positive for all systems indicating that solute-solvent interaction hinders the dipole rotation in the system.
References
- J.A.Jeffrey, W.Saeriger, Hydrogen Bonding in Biological Structures, Springler, Berlin, 1991.
CrossRef - Dannhausr, W,; Bahe, L.S. J. Chem. Phys.1964 ,40, 3058
CrossRef - Grag, S.K,; Smyth, C.P. J. Phys. Chem. 1965 ,69,1924
- Dannhausr, W. J. Chem. Phys.1968 ,48,1918
CrossRef - Glaser, L.; Crossely, J.; Smyth, C.P. J. Chem. Phys. 1972 ,57,3977
CrossRef - Kumbharkane, A.C.; Puranik, S.M.; Mehrotra, S.C.; J. Pure Appl. Phys. 1992, 4, 62.
- Puranik, S.M.; Kumbharkane, A.C.; Mehrotra, S.C.; Proc. Natl. Acad. Sci. India. 1993 ,63,415
- Kumbharkane, A.C.; Puranik, S.M.; Mehrotra, S.C. J. Mol. Liq. 1992, 51, 303
- Chaudari, A.; Khirade, P.; Singh, R.; Helambe, S.N.; Narain, N.K.; Mehrotra, S.C.; J. Mol. Liq. 1999, 82, 245.
CrossRef - Helambe, S.N.; Chaudari, A; Mehrotra, S.C. J. Mol. Liq. 2000 , 84, 235
CrossRef - Rana, V.A.; Vyas, A.D. J. Mol. Liq. 2002, 102, 1-3, 379
- Sivagurunathan, P.; Dharmalingam, K.; Ramachandran, K. Z. Phys. Chem. 2005, 219, 1385
CrossRef - Sivagurunathan, P.; Dharmalingam, K.; Ramachandran, K. Spectrochim. Acta A, in press
- Sivagurunathan, P.; Dharmalingam K.; Ramachandran, K.Z. Phys. Chem. 2005, 219 ,1635
CrossRef - Sivagurunathan, P.; Dharmalingam K.; Ramachandran, K. Indian J. Pure & Appl. Phys. 2005 ,43, 905
- Sivagurunathan, P.; Dharmalingam, K.; Ramachandran, K. Indian J. Phys. 2005, 79, 1403
- Patil, S.P.; Chaudhari,; A. Lokhande, M.P.; Lande, M.K; Shankarwar, A.G. Helambe,; S.N. Arbad, B.R. ; Mehrotra, S.C. J. Chem. Eng. Data, 1999 ,44, 875
CrossRef - Khirade, P.W.; Chaudhari, A.; Shinde, J.B.; Helambe, S.N.; Mehrotra, S.C.J. Chem. Eng. Data, 1999 ,44, 879
CrossRef - Khirade, P.W.; Chaudhari, A.; Shinde, J.B.; Helambe, S.N.; Mehrotra, S.C.J. Sol. Chem. 1999, 28, 1031.
CrossRef - Chaudhari, A.; Mehrotra, S.C. Mol. Phys. 2002, 100, 3907
CrossRef - Vogal,; A.I. Text Book of Practical Organic Chemistry, 3rd edition, Longman, London, 1957
- Samulon, H. A. Proc. IRE, 1951, 39, 175
- Shannon, C. E. Proc. IRE, 1949, 37,10
- Pawar, V.P.; Mehrotra, S.C. J. Mol. Liq. 2003, 108, 95
CrossRef - Dash, S.K.; Das, J.K.; Swain, B.B. Indian J. Pure Appl. Phys. 2000 ,38, 791
- Bevington, P.R. Data Reduction and Error Analysis for the Physical Sciences, Mc Graw Hill, New York, 1969
- Kroeger, M. K.; J. Mol. Liq.,1987 ,36,101
CrossRef - Ritzoulis, G.; Fidantsi, A. J. Chem. Eng. Data, 2000 ,45, 207
CrossRef - Balamurugan, D.; Kumar, S. and Krishnan, S., J. Mol. Liq. 2005 ,122, 11
CrossRef - Kalaivani, T; Kumar, S; Krishnan, S. Indian J. Pure and Appl. Phys., 2005, 43, 542
- Bruggeman, D.A.G. Ann. Phys.1935 ,5, 636
CrossRef - Rana, V.A.; Vyas, A.D. J. Mol. Liq., 2002, 102, 1
- Kirkwood, J. G. J. Chem. Phys. 1939 ,7,911
CrossRef - Kumbharkhane, A.C.; Puranik, S.M.; Mehrotra, S.C. J. Sol. Chem. 1993,22, 219}
CrossRef - Pieruceini M.; Saija, F. J. Chem. Phys.2004 ,121, 3191
CrossRef - Tabellout, M.; Lanceleur P.; Emery, J.R. J. Chem. Soc. Faraday Trans. 1990,86, 1493
CrossRef - Pawar, V.P.; Mehrotra, S.C. J. Mol. Liq., 2002,95, 63
CrossRef - Helambe, S.N.; Chaudhari, A; Mehrotra, S.C. J. Mol. Liq., 2000, 84,235
CrossRef

This work is licensed under a Creative Commons Attribution 4.0 International License.
![]()
A New Edition of Web of Science
Journal Impact Factor
2022: 0.5
Five Year: 0.8
Journal is Indexed in

Cabells Whitelist
![]()


