Preparation and Characterization of Keratin Blended Films using Biopolymers for Drug Controlled Release Application
Biodegradable Polymers Research Unit, Department of Chemistry and Center of Excellence for Innovation in Chemistry, Creative Chemistry and Innovation Research Unit, Faculty of Science, Mahasarakham University, Maha Sarakham 44150, Thailand.
Corresponding Author E-mail : psrihanam@gmail.com
DOI : http://dx.doi.org/10.13005/ojc/320402
Download this article as:
![]()
Keratin solution was separately blended with collagen, gelatin, sericin and starch for films preparation. All the blended films had smooth surfaces without phase separation, except the keratin/starch blend film. The native keratin film showed small particles embedded in all the film surfaces that resulted in them being rough. The structure of the native keratin film changed from beta-sheet to random coil at high blend ratio of other substances. This result increased the dissolution of the films especially the keratin/starch blend. The results relate directly to the decreased thermal stability of this film. However, the changes in structure did not affect the chlorhexidine release pattern. It is possible that the interaction between the drug and blending substances, and the substances to water molecules are the main factor influencing the drug release pattern from the films.
KEYWORDS:Human hair; Keratin; Film; Biopolymer; Properties
Introduction
Studies on protein materials, such as collagen, gelatin, albumin, silk fibroin and keratin, have been increasing gradually, and have already been applied as biomaterial for many purposes1. This is due to people around the world being more aware of their environment and wishing to protect it and mainly use natural based products. For the biomedical and pharmaceutical applications, controlled delivery systems have been studied for encapsulation of the active ingredients or drugs. Many advantages, such as improvement of drug kinetics, decreased harm from an over dose or ease of use, should be obtained from this novel system2 compared to the traditional method3. From previous reports, biodegradable polymers are of wide interest 4,5. However, all suitable properties cannot be found in only one type of polymer. Therefore, blended or composite polymers are used to improve the properties of materials 6-7. Keratin is a structural protein found generally in skin, feathers, hairs, horns and nails8. It has unique biological and chemical properties, such as biocompatibility and high strength9-10. Recently, there have been many methods for the extraction of the keratin protein from original sources. Keratin can be prepared as biomaterials in many forms, including as a film 11. Unfortunately, films prepared from keratin are highly fragile and have low flexibility12. Many researchers have attempted to solve this problem by blending other polymers or substances, both natural13 and synthetic14. Among the polymers, polar materials are seen to be able to increase the flexibility and decrease the fragility of the keratin film. Saccharide, or sugar, is a polar molecule that is composed of many hydroxyl groups in its structure. Moreover, structural proteins, like collagen and its derivative gelatin, are being considering for blending with keratin because they offer excellent biological properties and highly flexible materials. In Thailand, hair is a waste material from hair salon, and there are no reports of uses for this waste or hair extract products. Therefore, a method for the extraction of keratin from Thai human hair should be studied as it could be a significant resource for keratin in the future. The aims of this work were to extract human hair keratin before using them as a substrate to prepare blend films. The properties of the blend films were compared to a native keratin film to assess the improvements in properties. Finally, all of the prepared films were studied for controlled drug release patterns using chlorhexidine diacetate (CHX) as a water-soluble model drug.
Materials and Methods
Chemicals and Materials
Human hair was collected from a local hair salon in Maha Sarakham Province, Thailand. The hair was warmed at 40 °C before being immersed in n-hexane for 12 h to remove external lipids. 2-mercapto ethanol, gelatin, hexane, NaOH, SDS and urea in analytical grade were purchased from UNIVAR, Ajax Finechem. Chlorhexidine diacetate was supplied from Maxway. Collagen peptide and tapioca starch in commercial grade were purchased from Shanghai Taoyu International Trading Co, Ltd., and Roi Et Flour Co, Ltd., respectively.
Extraction of keratin from human hair
Human hair was warmed at 40 °C before washing twice with distilled water. The hair sample was then immersed in hexane for 12 h to remove some lipids and waxes. The extraction procedure was then performed using a modification of the Shindai method15. Briefly, 10 g of hair sample was dissolved using a mixture solution of 0.8 M urea, 0.26 M SDS and 0.4 M NaOH in 100 mL distilled water at 70 °C with stirring until homogeneous dissolution. The obtained solution was then dialyzed against distilled water for three days. The % wt of keratin was found by evaporation technique. The prepared keratin solution was added into known weight of 10 mL beaker, then dried in an oven until the solution was fully evaporated. After cooling, the beaker was weighed to find remained keratin in the beaker. The weight increased was expressed as % wt of keratin by multiply with 100.
Preparation of keratin blend films
A keratin solution was mixed with a polar solution at the blend ratios of 1:1, 1:2 and 2:1 v/v with a total volume of 9 mL. The blend solutions were then poured into polystyrene plates with a diameter of 4.5 cm. The blend solutions were dried at 40 °C for three days to obtain the blend films. Moreover, keratin blend films containing chlorhexidine diacetate (CHX) were also constructed using the same method. The model drug/film matrix weight ratio was kept in constant at 0.004g/0.5g.
Morphological observation
All of the films were dehydrated and cut (~ 1cm in length) before observing their morphology using a scanning electron microscope (SEM) (JEOL, JSM-6460LV, Tokyo, Japan). The samples were sputter coated with gold for enhanced surface conductivity. Current and voltage were adjusted to give a power of 2W (3mA, 15 kV) for 3 min.
Secondary structure analysis
All of the films had investigated of their secondary structures using attenuated total reflection infrared spectroscopy (Perkin Elmer-Spectrum Gx, USA) in the spectral region of 4000-400 cm-1 at a 4 cm-1 spectral resolution and 32 scans.
Thermal properties study
The keratin and all blend films (8-10 mg) were loaded in a platinum crucible. The thermogravimetric analysis (TGA) was then performed using a TA instruments, SDT Q600 (Luken’s Drive, New Castle, DE). The samples were non-isothermally heated from 50 °C to 800 °C at a heating rate of 20 °C/min. The TGA was carried out in nitrogen with a flow rate of 100 mL/min.
Dissolution of films
A dissolution test of the keratin blend films was performed in a 0.1 mM phosphate buffer solution, pH 7.4 at 37 °C. Percentage of dissolution was calculated from equation (1). Each dissolution value was averaged from three measurements.

The final weight of the film sample was obtained after drying at 50 °C for 24 h.
Drug release study
Keratin blend films containing chlorhexidine diacetate were investigated for their release profiles in PBS buffer, pH 7.4, at 37 °C for 48 h while being shaken. At designated time intervals of the release medium was collected. The drug concentration was measured at 254 nm using a UV-Vis spectrophotometer. The percentage of drug released from the blend films was determined against a calibration curve and initial drug loading on the film.
Results and Discussion
Digital images of keratin films
The films were captured using a digital camera and are shown in Fig. 1. The films showed slightly different features in their color and texture. The color of the keratin (K) was brown and pale black, like the original color of the hair, and it was highly fragile. The keratin/collagen peptide blend films at blend ratios of 1:1 (KC1), 1:2 (KC2) and 2:1 (KC3) appeared to have a smooth texture, as did the keratin/gelatin (KG) blend films. However, the KC3 blend film was more fragile than the other blend films. For the keratin/sericin (KS) blend films, the smooth surfaces were found in all of blend ratios, but higher fragility was found for the KS3 blend film with 2:1 K/S blend ratio. The surfaces of the keratin/starch (KSt) blend films showed a higher fragility than other the blend films and were brittle in both the KSt1 (1:1 K/St blend ratio) and KSt3 (2:1 K/St blend ratio). Therefore, we chose the 1:2 keratin/blending substance blend films for further investigations. Generally, keratin is composed of different sizes of protein. This affected the texture and structural features of the keratin film. From the digital images, the keratin color was pale black and the texture appearance was brittle. This was mainly from the sulfhydryl amino acid cysteine, which was the main amino acid composing the hair 10. The texture of the keratin film was fragile and brittle due to the strong disulfide bond from the cystine molecules16. Many polar natural polymers including sericin, collagen peptide, gelatin and starch were chosen for improving the keratin texture. This was due to the polar molecules being inserted between the molecules of cysteine, and resulted in an increase in their molecule distances. The strength of the film was affected by the breakage of the disulfide or H-bond17. The keratin blended films varied in color and transparency as well as texture depending on the added molecules and ratio used. Blending with sericin resulted in a tight compact and dark film, while gelatin resulted in a homogeneous texture and yellow pale films. Usually, sericin is composed of different kinds of proteins arranged from 4-350 kDa 18-19. Therefore, the texture of the blended film should be affected by the various types of keratin and sericin proteins.
Morphological study
The morphology of the films was investigated using a SEM. Fig. 2 shows the SEM micrographs of several films. The results indicated that all of the blend films have smooth surfaces and homogeneous texture without phase separation, except the keratin/starch blend film. The last film showed round granules that were embedded and merged together to form the film’s porous texture. The native keratin films have smooth surfaces, but also some small particles covering the surface area as well as its texture. The KC and KG blend films showed similar textures. The KS blend films showed rougher and more homogeneous textures than the other blend films, even the native keratin films. Collagen is a kind of protein fiber with high content of non-polar amino acids: proline and hydroxy proline as well as glycine 20. These amino acids were concentrated on the hydrophobic regions of the fiber structure. The blend films between keratin and collagen had fragile surfaces and non-homogeneous texture. The results were related to the hypothesis that imbalanced blend ratios (1:2 and 2:1 ratios) affected the cracking of the surfaces more than the native keratin film. This is one problem of using collagen as material for cell culture, which is caused by structural instability. However, the texture of the blend films was smoother than the native film. This may be due to the interaction between the amino acids in the keratin and collagen, especially the hydrogen 21 and disulfide bonds 22. The result indicated that keratin helped to enhance the stability of the collagen structure. It is well known that gelatin is a derivative protein of hydrolyzed collagen; therefore, the amino acid composition of gelatin was mainly proline and hydroxyproline 23. Both amino acid types are related to hydrophobic regions and the strength of the protein chain24. It is not a surprise that adding gelatin could enhance the film strength and affect the fracturing of the film surfaces. However, the hydrogen bonds between the amino acids of keratin and gelatin were formed 25, they resulted in an increase in the smooth texture of the blend films, especially at low gelatin blend ratios. From previous reports, keratin composed of proteins with various molecular weights10. Therefore, the texture of its film should be rough and non-homogeneous. Sericin also composed of many protein sizes, but most amino acid components are hydrophilic molecules. In general, sericin is a glue-like protein26 that can interact well with the keratin proteins. Therefore, the molecule distance might be close and H-bonds are formed between the keratin and sericin proteins. The bonding formation resulted in a change to the texture of the blend films so that they were homogeneous. Rough surfaces were also observed when the sericin blend ratio was higher than the keratin. This was due to the sericin proteins that might have aggregated and increased their size. Increasing the molecular size may induce the film roughness. Starch is a type of polysaccharide and non-soluble in water; it is a glucose-homopolymer with α-1, 4-glycosidic bonds in the main chain and α-1, 6-glycosidic bonds in its branch27. The hydroxyl group (OH) in starch molecules can interact with the amino acids in keratin via H-bonds, and this result in an increased strength of the film. The sponge like texture might be caused due to the evaporation of water molecules that reacted with various hydroxyl groups in the starch 28.
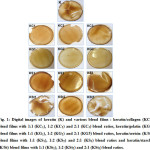 |
Figure 1: Digital images of keratin (K) and various blend films : keratin/collagen (KC) blend films with 1:1 (KC1), 1:2 (KC2) and 2:1 (KC3) blend ratios, keratin/gelatin (KG) blend films with 1:1 (KG1), 1:2 (KG2) and 2:1 (KG3) blend ratios, keratin/sericin (K/S) blend films with 1:1 (KS1), 1:2 (KS2) and 2:1 (KS3) blend ratios and keratin/starch (K/St) blend films with 1:1 (KSt1), 1:2 (KSt2) and 2:1 (KSt3) blend ratios. Click here to View Figure |
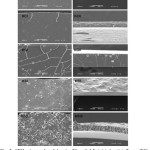 |
Figure 2: SEM micrographs of keratin (K) and 1:2 (w/w) keratin/collagen (KC), keratin/gelatin (KG), keratin/sericin (KS) and keratin/starch (KSt) blend films. Column I presents the cross section and column II presents the surface of each film (All bars = 50 mm). Click here to View Figure |
Secondary structure analysis
The secondary structure of all films was characterized using a Fourier transform infrared (FTIR) spectrophotometer. Absorption peaks were observed at amide regions including amide I (1700-1600 cm-1), amide II (1600-1500 cm-1) and amide III (1250-1150 cm-1), which are summarized in Fig. 3. The absorption of the keratin film was found at 1653, 1543 and 1233 cm-1 (Fig. 3a), while the K/S blend film showed it at 1659, 1547 and 1240 cm-1(Fig. 3b). The K/St blend film showed absorption at 1665, 1519 and 1245 cm-1 (Fig. 3c), while the K/C blend film showed absorption peaks at 1649, 1546 and 1238 cm-1 (Fig. 3d). The absorption of the K/G blend film was observed at 1649, 1544 and 1245 cm-1 (Fig. 3e). The peaks at about 1700-1600 cm-1 and 1250-1150 cm-1 are carbonyl stretching while those at 1600-1500 cm-1 are the blending vibration of N-H. All of the absorption peaks of the native keratin film were assigned to the α-helix structure 28. The peaks at 3380 cm-1 and 2920 cm-1 are hydroxyl stretching influenced by hydrogen bonding and methylene, respectively. In addition, the absorption peak at about 1000-900 cm-1 is sulfitolysis cleavage of the cysteine disulfide bond 29. The results indicated that sericin and starch showed absorption peaks at the amide I region that were higher than the native keratin film. This indicated that the keratin blended with sericin and starch resulting in a decrease in strength and the films became fragile. This may result from the high polar content of the amino acids in sericin and glucose in starch, which interacted with amino acids of keratin via hydrogen bonds and resulted in increased flexibility of the blended films30. However, the hydrogen bonding can be formed via the amino groups (-NH2) or carbonyl group (C=O) of the keratin protein and affected the disappearance of the absorption peaks at 3200-2900 cm-1. These regions might be changed after bond formation between the internal molecules of keratin and starch 31.
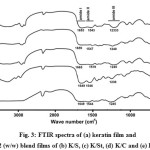 |
Figure 3: FTIR spectra of (a) keratin film and 1:2 (w/w) blend films of (b) K/S, (c) K/St, (d) K/C and (e) K/G. |
Thermal stability study
The thermal stabilities of the films are illustrated in Fig. 4-6 for the derivative thermogravimetric curves (DTG). The keratin films started to lose their weight at 84 °C, and the temperatures of maximum decomposition rate (Td,max), which were indicated by the DTG curves, were 259 and 340 °C. The K/S film lost its weight at 84 °C and had two Td,max values at 263 and 339 °C, while the K/St blend film had weight loss at 89 °C and two Td,max values at 283 and 337 °C. The K/C started to lose weight at 90 °C and had two Td,max values at 277 and 339 °C. The K/G started to lose weight at 73 °C and had Td,max values at 337 °C. At the end of the temperature scan (800 °C), the films retained about 12-18% of their initial weight.
All of the DTG curves showed small peaks lower than 100 °C. These peaks were associated with evaporation of residue moisture 32-33. Moreover, all of the films, both native and blended, had various decomposition peaks. The results indicated that each blend component consisted of various types and sizes of proteins. The remaining weight of the films was due to the carbon molecules in the protein and structures that did not decomposed even at 800 °C, which remained as ash.
The DTG curves present the Td, max of all films as being higher than 250 °C, which was responsible for destroying the crystalline regions of the proteins16. In addition, the thermal properties were affected strongly by the blending ratio, which was found by the different Td, max of each blending ratio. This means that the components in each film affected the bonding formation, especially the inter- and intra-molecular hydrogen bonds 14.
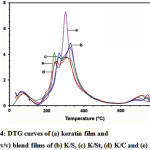 |
Figure 4: DTG curves of (a) keratin film and 1:1 (v/v) blend films of (b) K/S, (c) K/St, (d) K/C and (e) K/G. |
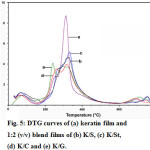 |
Figure 5: DTG curves of (a) keratin film and 1:2 (v/v) blend films of (b) K/S, (c) K/St, (d) K/C and (e) K/G. |
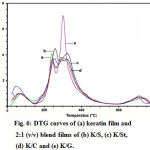 |
Figure 6: DTG curves of (a) keratin film and 2:1 (v/v) blend films of (b) K/S, (c) K/St, (d) K/C and (e) K/G. Click here to View Figure |
Dissolution of films
The dissolution of the films is indicated in Fig. 6. The results show that the lowest percentage of dissolution was for the keratin film, which started after one day of the experiment. In contrast, the K/St blend film showed the highest percentage dissolution. For the other films, the percentage of dissolution was sequentially K/S > K/C > K/G blend films.
Drug release study
The profiles of the drug release from each film are shown in Fig. 7. After the first 5 h, the release of the drug from K/G and K/C blend films was faster than the other films and gradually increased until reaching 100% after 12 h of study. Surprisingly, the K/S blend film released about 50% of the drug after 12 h and was empty within 49 h. At the end of the experiment, the K/S released drug was about 60%, while the native keratin showed the lowest release of the drug, about 15% at 49 h. The drug release profile of the blend films was studied by immersion in PBS with stirring for 49 h. This was in accordance with the dissolution of keratin, since it is composed of a high content of sulfur from the amino acid cystein 16. The disulfide (-S-S-) in the keratin structure was a main factor in the dissolution and drug release protection. The hydrophobic region of the substance could influence the dissolution of the film and drug release pattern. The collagen structure is composed of large amounts of proline and hydroxyproline with a triple helix, while the gelatin structure is a single random coil, which results in it being easy to dissolve in an aqueous solution at 40 °C 34. The percentage drug release of the K/S blend films was rapid after immersion in PBS and increased directly until the end of the experiment. The results suggest that sericin may interact with chlorhexidine model drug better than keratin and resulted in a phase separation of the film. Therefore, the solution can pass inside the film and cause the film to burst out releasing high drug content. Moreover, the K/St blend films showed the lowest drug release level. Starch is composed of various hydroxyl groups, which should interacted well with the chlorhexidine model drug and affect the release pattern of the film. However, the texture of the K/St blend film had phase separation when the ratio of starch was increased. Therefore, the structure of the blend film was not strong enough and water could be absorbed into the film 35 that causes the release of the drug inside the film. However, the drug release patterns of films varied and were different profile from their dissolution. The native keratin showed the lowest drug release level, while the keratin/collagen and keratin/gelatin blend films showed the highest percentages of drug release. This might be due to the texture of the films since the native keratin film has a denser texture than other films. In addition, the polarity of each blended polymer might influence the binding with chlorhexidine model drug. This drug is high polar and it should interact well via hydrogen bonds with the polar substances. Therefore, the drug release from the film should be diffusion at a slow rate.
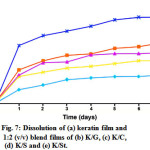 |
Figure 7: Dissolution of (a) keratin film and 1:2 (v/v) blend films of (b) K/G, (c) K/C,(d) K/S and (e) K/St. Click here to View figure |
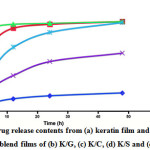 |
Figure 8: Drug release contents from (a) keratin film and 1:2 (v/v) blend films of (b) K/G, (c) K/C, (d) K/S and (e) K/St. Click here to View Figure |
Conclusions
All the films have a homogeneous texture without phase separation, except the keratin/starch blend film that had some granules covering the film. The native keratin film was composed of α-helix and random coil structures and there was a change to a higher content of random coil structures after blending with polar molecules, especially with sericin and starch. The porous K/St blend film resulted in the highest dissolution and lowest thermal stability. However, the patterns of drug release from the films were not related to the percentage of film dissolution as the K/C and K/G blend films showed rapid drug release. Therefore, the drug release profile might be affected mainly by the interaction between the drug and blend film matrix, which is directly related to the components and structures of each substance.
Future work should focus on the possibility of using other model drug to study the profile of drug release, and compare between the various keratin blend films. This is to clear about the effect of interaction between drug and carrier films.
Acknowledgements
This work was financially supported by Mahasarakham University. The authors would like to thank the Department of Chemistry, Faculty of Science, Mahasarakham University and the Center of Excellence for Innovation in Chemistry, Commission on Higher Education, Ministry of Education, Thailand for partial financial support of this work.
References
- Rouse, J.G.; Van-Dyke, M.E.; Materials. 2010, 3, 999-1010.
CrossRef - Mandal, B.B.; Priya, A.S.; Kundu, S.C.; Acta Biomater. 2009, 5, 3007-3020.
CrossRef - Biondi, M.; Ungaro, F.; Quaglia, F.; Netti, P.A.; Adv. Drug Deliver. Rev. 2008, 60, 229-242.
CrossRef - Malafaya, P.B.; Silva, G.A.; Reis, R.L.; Adv. Drug Deliver. 2007, 59, 207-233.
CrossRef - Wenk, E.; Wandrey, A.J.; Merkle, H.P.; Meinel, L.; J. Control. Release. 2008, 132, 26-34.
CrossRef - Sinha, V.R.; Trehan, A.; J. Control. Release. 2003, 90, 261-280.
CrossRef - Okhawilaia, M.; Rangkupan, R.; Kanokpanont, S.; Damrongsakkul, S.; Int. J. Biol. Macromol. 2010, 46, 544-550.
CrossRef - Meyers, M.A.; Chen, P.Y.; Lin, A.Y.M.; Seki, Y.; Prog. Mater. Sci. 2008, 53, 1-206.
CrossRef - Tanabe, T.; Okistu, N.; Tachibana, A.; Yamauchi, K.; Biomaterials. 2002, 23, 817-825.
CrossRef - Reichl, S.; Biomaterials. 2009, 30, 6854-6866.
CrossRef - Yamauchi, K.; Maniwa, M.; Mori, T.; J. Biomater. Sci., Polym. 1998, 9, 259-270.
CrossRef - Fujii, T.; Ide, Y.; Biol. Pharm. Bull. 2004, 27, 1433-1436.
CrossRef - Lee, K.Y.; Fiber Polym. 2001, 2, 71-74.
CrossRef - Vasconcelos, A.; Fredi, G.; Cavaco-Paulo, A.; Biomacromolecules. 2008, 9, 1299-1305.
CrossRef - Fujii, T.; Ogiwara, D.; Arimoto, M.; Biol. Pharm. Bull. 2004, 27, 89-93.
CrossRef - Zoccola, M.; Aluigi, A.; Tonin, C.; J. Mol. Struct. 2009, 938, 35-40.
CrossRef - Aluigi, A.; Varesano, A.; Montarsolo, A.; Vineis, C.; Ferrero, F.; Mazzuchetti, G.; Tonin, C. J. Appl. Polym. Sci. 2007, 104, 863-870.
CrossRef - Zhang, Y.Q.; Biotechnol. Adv. 2002, 20, 91-100.
CrossRef - Dash, B.C.; Biman, B.; Kundu, S.C.; J. Biotech. 2009, 144, 321-329.
CrossRef - Wang, Y.-X.; Cao, X.-J.; Process Biochem. 2012, 47, 896-899.
CrossRef - Karim, A.A.; Bhat, R.; Food Hydrocolloid. 2009, 23, 563-576.
CrossRef - Katoh, K.; Shibayama, M.; Tanabe, T.; Yamauchi, K.; J. Appl. Polym. Sci. 2004, 91, 756-762.
CrossRef - Gómez-Guillén, M.C.; Giménez, B.; López-Caballero, M.E.; Montero, M.P.; Food Hydrocolloid, 2011, 25, 1813-1827.
CrossRef - Aewsiri, T.; Benjakul, S.; Visessanguan, W.; Wierenga, P.A.; Gruppen, H.; Food Hydrocolloid. 2011, 25, 1277-1284.
CrossRef - Balaji, S.; Kumar, R.; Kakkar, P.; Ramesh, D.; Vijaya Ramesh, R.; Reddy, P.N.K.; Sehgal, P.K.; Mat. Sci. Eng. C, 2012, 32, 975-982.
CrossRef - Mandal, B.B.; Mann, J.K.; Kundu, S.C.; Eur. J. Pharm. Sci. 2009, 37, 160-171.
CrossRef - Tester, R.F.; Karkalas, J.; Qi, X.; J. Cereal Sci. 2004, 39, 151-165.
CrossRef - Church, J.S.; Poole, A.J.; Woodhead, A.L.; Vib. Spectrosc. 2010, 53, 107-111.
CrossRef - Cardamone, J.M.; J. Mol. Struct. 2010, 969, 97-105.
CrossRef - Srihanam, P.; Tessanan, W.; Pak. J. Biol. Sci. 2011, 14, 351-356.
CrossRef - Miao, M.; Li, R.; Jiang, B.; Cui, S.; Zhang, T.; Jin, Z.; Food Chem. 2014, 151, 154-160.
CrossRef - Du, C.; Jin, J.; Li, Y.; Kong, X.; Wei, K.; Yao, J.; Mat. Sci. Eng. C, 2009, 29, 62-68.
CrossRef - Mo, C.; Wu, P.; Chen, X.; Shao, Z.; Vib. Spectrosc. 2009, 51, 105-109.
CrossRef - Vlierberghe, S.V.; Schacht, E.; Dubruel, P.; Eur. Polym. J. 2011, 47, 1039-1047.
CrossRef - Flieger, P.; Kantorov, M.; Prell, H.; Rezanka, M.; Votruba, L.;Folia Microbiol. 2003, 48, 27-44.
CrossRef


![]()


