Assessment of Trace Metals in Groundwater of Jammalamadugu and Yerraguntla Areas of YSR Kadapa Dt., AP, India
Haribabu Bollikolla1*, Suresh Pulapaka1,2, Ramesh Babu Avuguddi2, Janardhana Rao Dasaripalli3 and V. V. Swamy Arza3
1Department of Chemistry, Acharya Nagarjuna University, Guntur, Andhra Pradesh-522510, India.
2Department of Chemistry, SCNR Govt. Degree College, Proddatur, Andhra Pradesh-516360, India.
3Department of Environmental Sciences, Acharya Nagarjuna University, Guntur, Andhra Pradesh-522510, India.
* Corresponding Author E-Mail: dr.b.haribabu@gmail.com
DOI : http://dx.doi.org/10.13005/ojc/320462
Ground water is the only primary source of drinking water in the study area. So, a comprehensive study has been carried out with respect to heavy metals like Arsenic, Cadmium, Chromium, Copper, Iron, Mercury, Manganese, Molybdenum, Nickel, Lead, Selenium and Zinc in ground water sources of Jammalamadugu (JMD) and Yerraguntla (YGL) areas of YSR Kadapa district, Andhra Pradesh. Ten groundwater samples from each area were collected and analyzed for trace metals by ICP-OES method. The results showed that the mean concentration level of various heavy metals in the JMD area followed the sequence: Zn > Fe > Mn > Se > Cu > Cd>Mo~ Pb > Ni > Cr > As~Hg where as in YGL area the mean concentration of heavy metals was in the order: Zn> Fe> Se> Mn> Ni> Mo> Cd> Pb> Cr> As~ Hg ~Cu. The concentration of eleven heavy metals, except cadmium, in both areas was detected within the permissible limits of WHO. The Concentration of Cadmium in 40% of samples of JMD area and 30% samples of YGL area was detected above WHO guidelines. Cadmium (Cd) is an extremely toxic industrial and environmental pollutant. Drinking water with high Cadmium levels severely irritates the stomach, leading to vomiting, diarrhea, kidney damage, osteoporosis and osteomalacia. Some of the groundwater sources are safe for drinking, but proactive measures should take to check the levels of trace metals periodically. KEYWORDS:
Groundwater; Heavy metals; ICP-OES; Cadmium; Health effect; Periodical check
Download this article as:| Copy the following to cite this article: Bollikolla H, Pulapaka S, Avuguddi R. B, Dasaripalli J. R, Arza V. V. S. Assessment of Trace Metals in Groundwater of Jammalamadugu and Yerraguntla Areas of YSR Kadapa Dt., AP, India. Orient J Chem 2016;32(4). |
| Copy the following to cite this URL: Bollikolla H, Pulapaka S, Avuguddi R. B, Dasaripalli J. R, Arza V. V. S. Assessment of Trace Metals in Groundwater of Jammalamadugu and Yerraguntla Areas of YSR Kadapa Dt., AP, India. Orient J Chem 2016;32(4). Available from: http://www.orientjchem.org/?p=20801 |
Introduction
Groundwater has been used as a source of drinking water for millions of rural and urban families in India. But unfortunately due to lack of proper groundwater quality-monitoring network and appropriate water resources management has resulted in groundwater contamination in many parts of India. Heavy metals are naturally occurring elements that have a high atomic weight and a density at least 5 times greater than that of water. Heavy metals in groundwater are toxic even at low concentrations1-3. Human activities like industry, agriculture, and solid waste disposal increase the contents of heavy metals in water, soil, air, fruits, vegetables and fish4-6. There are 35 metals that concern us because of occupational or residential exposure, of which 23 are heavy metals: antimony, arsenic, bismuth, cadmium, cerium, chromium, cobalt, copper, gallium, gold, iron, lead, manganese, mercury, nickel, platinum, silver, tellurium, thallium, tin, uranium, vanadium, and zinc7. Although small amounts of these are common in our environment and diet and some are necessary for good health, large amounts of any of them may cause acute or chronic toxicity.
Trace metals, among a wide range of contaminants, are consistently of health concern due to their toxicity potentials at very low concentrations and tendency to bio accumulate in tissues of living organisms over time8. They enter into human systems via contaminated drinking water, food and air9-11. Once in the body, the bio available form of these metals can compete with, and displace essential minerals such as zinc, copper, magnesium and calcium; and interfere with organ system function12.Toxic metals such as mercury (Hg), cadmium (Cd), arsenic(As), chromium (Cr), thallium (Tl) and lead (Pb) have no beneficial effects in humans, as such long-term exposure may cause more severe disruptions in the normal functioning of the organ systems where the metals are accumulated. Pb, for example, is associated with a wide range of negative pregnancy outcomes, including early membrane rupture and spontaneous abortion, erectile dysfunction, and contributes to cardio vascular diseases13. Metals such as As, Mn, Ti, Cd, Cr, V, Co, Cu, Fe, Pb, Ni, Zn and their compounds have been shown to be initiators or promoters of carcinogenic activity in animals. Also, Be, Sb, Al, Hg, Ni, Cd and Co can cause adverse reproductive/fertility problems14. However, as micronutrients, some trace metals such as zinc, copper, iron and manganese are required by the body in small amounts for metabolic activities. These same elements, at higher concentrations can cause adverse health effects or illness. Zinc toxicity leads to diarrhea, manganese may hamper the intellectual development of the child15, 16. Iron has been associated with genetic and metabolic diseases and, repeated blood transfusions and copper toxicity is related to several health concerns, including stomach cramps, nausea, vomiting, diarrhea, cancer, liver damage and kidney disease17. So, quality of drinking water should be tested periodically for the presence of trace metals.
In all locations of the JMD & YGL areas, the public use ground water for drinking and house hold purpose. This area is highly mineralized and contains dying industries. There might be chances to get contamination of ground water with different elements and ions. In the present study an attempt has been made to evaluate the concentration levels of heavy metals in ground water using Inductively Coupled Plasma–Optical Emission Spectrometer (ICP-OES) method18, 19
Study Area
JMD (Fig-1b) is one of the municipal towns of YSR Kadapa district in Andhra Pradesh(Fig-1a), India, which lies between 14° 83′ North and 78° 40’east with an elevation of 169 meters. The town had a population of 46,069 with a density of 1900 per square kilometer.
YGL municipal town in YSR Kadapa district (Figure-1(c)) is located in Andhra Pradesh (Figure-1(a)). The area is located at 14.63N and 78.53E coordinates with an elevation of 152 meters. This is dominantly an arenaceous consisting of conglomerate quartzite, Quartzite with shale formation of dolomitic lime stones.
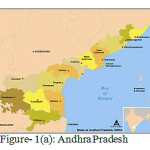 |
Figure 1(a): Andhra Pradesh |
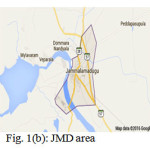 |
Figure 1(b): JMD area
|
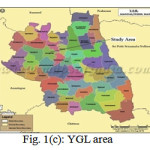 |
Figure 1(c): YGL area |
Sample collection
Ten ground water Samples of each area were collected from tube wells by random selection in clean and sterile one liter polythene containers which were thoroughly cleaned with 1:1 HNO3 rinsed several times with distilled water and dried in electric oven by following standard sample collection protocol and guidelines given in Indian Standards methods IS: 3025 (Part-1) and American Public Health Association (APHA) 22nd edition. All probable safety measures were taken at every stage, starting from sample collection, storage, transportation and final analysis of the samples to avoid or minimize contamination.
Methodology
A number of sophisticated instruments like ICP-OES, ICP-MS, AAS, UV-VIS spectrometer, Cyclic voltametry, etc. are using for the determination of heavy metals in water. Inductively Coupled Plasma – Optical Emission Spectrometer (ICP-OES) is based on emission technique. ICP – OES has additional advantages over the other techniques in terms of detection limits as well as speed of analysis19, 20. By using ICP-OES technique we can determine concentration of trace element up to 10 ppb levels21. To generate plasma, first, argon gas is supplied to torch coil, and high frequency electric current is applied to the work coil at the tip of the torch tube. Using the electromagnetic field created in the torch tube by the high frequency current, argon gas is ionized and plasma is generated. This plasma has high electron density and temperature (10000K) and this energy is used in the excitation-emission of the sample. Solution samples are introduced into the plasma in an atomized state through the narrow tube in the center of the torch tube. Twelve heavy metals were analyzed by direct aspiration of groundwater samples into ICP-OES multi analyzer system (Perkin Elmer, 7300DV) using radio frequency (RF) power of 1400 watts, plasma flow of 15 L/min and Nebulizer flow of 0.5 L/min and plasma view at axial mode. The excited atoms emit energy at a given wavelength as the electrons return to their ground state. A given element emits energy at specific wavelengths peculiar to its chemical character. The intensity of the energy emitted at that wavelength is proportional to the amount of element in the analyzed sample. Linear curve was prepared using standard solutions. The observed metal levels in the study area were compared with drinking water quality standards given by World Health Organization (WHO) 22.
Results and Discussion
Ten ground water samples from various parts of the JMD & YGL areas were collected and analyzed by using ICP-OES multi analyzer. The quantity of various metals and their statistical analysis of the analyzed samples were listed in the Tables (1-4).
Arsenic
The Arsenic concentration in the ground water samples of both areas was found in below detectable limit. The maximum acceptable limit for arsenic as per World Health Organization is 0.01mg/L. The observed concentration levels of Arsenic in the study area are within the WHO permissible limits.
Cadmium
The Cadmium concentration in the ground water samples of JMD & YGL areas was observed in the range of 0.003-0.004mg/L & 0.003-0.005mg/L respectively. The average concentration of Cadmium in the study area is more than the permissible limits of WHO guidelines. Cadmium concentration in 40% samples of JMD and 30% samples of YGL was detected above permissible limits of WHO.
Chromium
The maximum and minimum concentrations of Chromium in the study area are 0.002 mg/L and 0.001mg/L respectively. Chromium was detected in 90% samples of both areas .The observed concentration levels of Chromium in the study area are within the permissible limits of WHO guidelines.
Copper
The Copper concentration was found below detectable limit in 80% samples of JMD area and 100% samples of YGL area. The maximum permissible limit for copper as per World Health Organization is 2mg/L. The observed concentration levels of copper in the study area are within the permissible limits of WHO guidelines.
Iron
The iron concentration in the ground water samples was found in the range of 0.003 to 0.463mg/L in JMD area and 0.001 to 0.1mg/L in YGL area. Iron was reported in 90% samples of JMD area and 100% samples of YGL area. The observed concentration of iron in the study area was within the permissible limits.
Mercury
The Mercury concentration in the ground water samples of both areas was found in below detectable limit. The maximum permissible limit for Mercury in drinking water as per WHO guidelines is 0.006 mg/L. The observed concentration levels of Mercury in the study area were found below permissible limit specified by WHO.
Table 1: Heavy metal concentration in ground water samples of JMD area
| S.No. | Sample Location | As | Cd | Cr | Cu | Fe | Hg | Mn | Mo | Ni | Pb | Se | Zn |
| 1 | Marwadi veedi | <BDL | 0.003 | 0.002 | <BDL | 0.463 | <BDL | 0.008 | 0.001 | 0.002 | 0.002 | 0.018 | 0.076 |
| 2 | B.C Colony masjid | <BDL | 0.004 | 0.002 | 0.007 | 0.084 | <BDL | 0.174 | <BDL | 0.005 | 0.005 | 0.063 | 2.176 |
| 3 | Narasimhapuram | <BDL | 0.003 | 0.002 | <BDL | 0.283 | <BDL | 0.007 | 0.001 | 0.001 | 0.006 | 0.02 | 0.378 |
| 4 | Fire station | <BDL | 0.004 | 0.002 | <BDL | 0.003 | <BDL | 0.005 | 0.011 | 0.003 | 0.001 | 0.017 | 0.082 |
| 5 | Kannelur | <BDL | 0.003 | 0.002 | <BDL | 0.044 | <BDL | 0.003 | 0.002 | 0.002 | <BDL | 0.012 | 0.017 |
| 6 | LIC office | <BDL | 0.003 | <BDL | <BDL | 0.08 | <BDL | 0.022 | <BDL | 0.002 | 0.003 | 0.014 | 0.027 |
| 7 | Diguvapalle | <BDL | 0.004 | 0.002 | <BDL | 0.007 | <BDL | 0.001 | <BDL | 0.003 | 0.003 | 0.021 | 0.016 |
| 8 | Venkateswara colony | <BDL | 0.004 | 0.002 | <BDL | <BDL | <BDL | 0.001 | 0.001 | 0.002 | 0.001 | 0.014 | 0.007 |
| 9 | Bypass road | <BDL | <BDL | 0.001 | 0.001 | 0.038 | <BDL | 0.119 | 0.004 | 0.001 | 0.004 | 0.027 | 0.002 |
| 10 | Moragudi | <BDL | 0.003 | 0.002 | <BDL | 0.244 | <BDL | 0.037 | 0.001 | 0.003 | 0.002 | 0.024 | 0.023 |
BDL=Below Detection Limit
Table 2: Heavy metal concentration in groundwater samples of YGL area
| S.No. | Sample Location | As | Cd | Cr | Cu | Fe | Hg | Mn | Mo | Ni | Pb | Se | Zn |
| 1 | Vempalle road | <BDL | 0.004 | 0.002 | <BDL | 0.001 | <BDL | 0.001 | 0.003 | 0.003 | 0.001 | 0.027 | 0.005 |
| 2 | Saibaba Temple | <BDL | 0.003 | 0.002 | <BDL | 0.036 | <BDL | 0.005 | 0.004 | 0.003 | 0.001 | 0.014 | 0.005 |
| 3 | TTD Mandapam | <BDL | 0.005 | 0.001 | <BDL | 0.003 | <BDL | 0.008 | <BDL | 0.039 | 0.005 | 0.037 | 0.365 |
| 4 | Mahesh nagar | <BDL | 0.003 | 0.002 | <BDL | 0.001 | <BDL | 0.001 | <BDL | 0.002 | 0.003 | 0.03 | 0.008 |
| 5 | VNPPetrol bunk | <BDL | 0.004 | 0.002 | <BDL | 0.002 | <BDL | 0.002 | <BDL | 0.002 | <BDL | 0.031 | 0.008 |
| 6 | Bajaj Showroom | <BDL | 0.003 | 0.001 | <BDL | 0.032 | <BDL | 0.007 | <BDL | 0.002 | 0.001 | 0.025 | 0.004 |
| 7 | Yadamagudi | <BDL | 0.003 | 0.002 | <BDL | 0.01 | <BDL | 0.001 | <BDL | 0.002 | <BDL | 0.023 | 0.005 |
| 8 | Shadi khana | <BDL | 0.003 | 0.002 | <BDL | 0.071 | <BDL | 0.007 | <BDL | 0.003 | 0.003 | 0.032 | 0.017 |
| 9 | Chowdamma Temple | <BDL | 0.003 | 0.002 | <BDL | 0.1 | <BDL | 0.027 | <BDL | 0.003 | 0.001 | 0.022 | 0.01 |
| 10 | Rly Station | <BDL | <BDL | <BDL | 0.001 | 0.038 | <BDL | 0.005 | 0.002 | 0.002 | 0.003 | 0.013 | 0.384 |
BDL=Below Detection Limit
Manganese
The Manganese concentration in the ground water samples of both areas were found in the range of 0.001 to 0.174mg/L and 0.001 to 0.027mg/L respectively. 100% samples of both areas contained manganese. The concentration of manganese in all samples of the study area was reported within the permissible limits of WHO.
Molybdenum
The Molybdenum concentration in the ground water samples of JMD and YGL areas was found in the range of 0.001 to 0.011mg/L and 0.003 to 0.004mg/L respectively. 70% samples of JMD area and 20% samples of YGL area were found to contain Molybdenum. The level of manganese in the study area was detected within the permissible limits of WHO.
Nickel
All samples in JMD and YGL areas reported nickel in the range of 0.001 to 0.005mg/L and 0.002 to 0.039mg/L respectively. The maximum Permissible limit for Nickel as per World Health Organization is 0.07 mg/L. The observed concentration levels of Nickel in the study area are within the permissible limits of WHO guidelines.
Lead
90% samples of JMD area and 80% samples of YGL area were reported lead in the concentration range of 0.001 to 0.006mg/L and 0.001 to 0.005mg/L respectively. guidelines.
Table 3: Comparison of statistical data of different metals in ground water samples of JMD area
| Conc.(mg/L) | As | Cd | Cr | Cu | Fe | Hg | Mn | Mo | Ni | Pb | Se | Zn |
| Min | — | 0.003 | 0.001 | — | 0.001 | — | 0.001 | 0.003 | 0.002 | 0.001 | 0.013 | 0.004 |
| Max | — | 0.005 | 0.002 | — | 0.1 | — | 0.027 | 0.004 | 0.039 | 0.005 | 0.037 | 0.384 |
| Average | — | 0.0034 | 0.00178 | — | 0.0294 | — | 0.0064 | 0.0035 | 0.0061 | 0.00225 | 0.0254 | 0.0811 |
| SD | — | 0.00073 | 0.00044 | — | 0.03379 | — | 0.0077 | 0.0007 | 0.0115 | 0.0015 | 0.0077 | 0.1547 |
| Skewness | — | 1.5006 | -1.6198 | — | 1.1977 | — | 2.4564 | — | 3.1513 | 0.8237 | -0.399 | 1.7798 |
| Kurtosis | — | 1.4673 | 0.7346 | — | 0.7394 | — | 6.8226 | — | 9.9492 | -0.1515 | -0.492 | 1.4268 |
| Percentage of samples contain heavy metal | 0 | 90 | 90 | 0 | 100 | 0 | 100 | 20 | 100 | 80 | 100 | 100 |
| WHO limit | 0.01 | 0.003 | 0.05 | 2 | NE | 0.006 | NE | NE | 0.07 | 0.01 | 0.04 | NE |
NE= Not Established
Table 4: Comparison of statistical data of different metals in ground water samples of YGL area
| Conc.(mg/L) |
As
|
Cd
|
Cr
|
Cu
|
Fe |
Hg
|
Mn
|
Mo
|
Ni | Pb | Se | Zn |
| Min | — | 0.003 | 0.001 | 0.001 | 0.003 | — | 0.001 | 0.001 | 0.001 | 0.001 | 0.012 | 0.002 |
| Max | — | 0.004 | 0.002 | 0.007 | 0.463 | — | 0.174 | 0.011 | 0.005 | 0.006 | 0.063 | 2.176 |
| Average | — | 0.0034 | 0.0019 | 0.004 | 0.1384 | — | 0.0377 | 0.003 | 0.0024 | 0.003 | 0.023 | 0.2804 |
| SD | — | 0.0005 | 0.0003 | 0.0042 | 0.1574 | — | 0.0598 | 0.0036 | 0.0012 | 0.0017 | 0.0148 | 0.6754 |
| Skewness | — | 0.271 | -3 | — | 1.2927 | — | 1.8376 | 2.2167 | 1.071 | 0.5567 | 2.604 | 3.0125 |
| Kurtosis | — | -2.571 | 9 | — | 0.8703 | — | 4.9988 | 1.8546 | -0.643 | 7.411 | 9.2349 | |
| Percent of samples contain heavy metal | 0 | 90 | 90 | 20 | 90 | 0 | 100 | 70 | 100 | 90 | 100 | 100 |
| WHO limit | 0.01 | 0.003 | 0.05 | 2 | NE | 0.006 | NE | NE | 0.07 | 0.01 | 0.04 | NE |
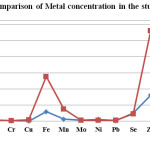 |
Figure-2 Comparison of Metal concentration in the study area |
The maximum permissible limit for Lead as per World Health Organization is 0.01mg/L. The observed concentration levels of Lead in the study area are reported within the permissible limits of WHO
Selenium
100% samples of the study area reported selenium in the range of 0.012 to 0.063mg/L and 0.013 to 0.037mg/L respectively. The maximum permissible limit for Selenium as per World Health Organization is 0.04mg/L. The observed concentration levels of Selenium in the study area are reported within the permissible limits of WHO guidelines.
Zinc
All samples in the study area were found to contain Zinc in the range from 0.002mg/L to 2.176mg/L in JMD area and 0.004 to 0.384mg/L in YGL area. The observed concentration levels of Zinc in the study area are reported within the permissible limits.
Results showed that ten and nine heavy metals were detected in one or more samples of JMD and YGL areas respectively (Figure-2). The mean concentration level of various heavy metals in the JMD area followed the sequence: Zn > Fe > Mn > Se > Cu > Cd>Mo~ Pb > Ni > Cr > As~Hg where as in YGL area the mean concentration of heavy metals was in the order: Zn> Fe> Se> Mn> Ni> Mo> Cd> Pb> Cr> As~ Hg ~Cu. The toxic metals, Arsenic and mercury, were found below detectable limit in all samples of the study area. Another toxic metal, lead was detected in 90% samples of JMD area and 80% samples of YGL area and its concentration was reported below WHO guidelines. Four heavy metals like Mn, Ni, Se, and Zn were detected in 100% of samples of JMD area and five heavy metals like Fe, Mn, Ni, Se, and Zn were reported in 100% samples of YGL area. Except Cd, all other heavy metal concentration in the study area was detected within the permissible limits of WHO guidelines. The concentration of Cadmium was detected above the permissible limits of WHO in 40% of samples of JMD area and 30% samples of YGL area. The average concentration of cadmium (0.0034mg/L) in both areas was reported above permissible limits of WHO (0.003 mg/L)
Conclusion
In the present study ten ground water samples from each area were collected and analyzed for the determination of twelve heavy metals results showed that eleven heavy metals, except cadmium, were detected within the permissible limits of WHO guidelines.
In 40% samples of JMD area and 30% samples of YGL area, Cadmium concentration was reported above permissible limits of WHO. The Cadmium is an extremely toxic industrial and environmental pollutant classified as a human carcinogen [Group1–accordingto International Agency for Research on Cancer; Group 2a-according to Environmental Protection Agency (EPA); and 1B carcinogen classified by European Chemical Agency]. Cadmium is frequently used in various industrial activities. The major industrial applications of cadmium include the production of alloys, pigments, and batteries. Cadmium exists as hydrated ions or as ionic complexes with other inorganic substances. Soluble forms migrate in water where as insoluble forms are immobile and will deposit and absorb to sediments. Drinking water with high cadmium levels severely irritates the stomach, leading to vomiting and diarrhea, and sometimes death. It will damage kidneys, cause bones to become fragile and break easily.
It is therefore suggested that the concern contaminated sources be subjected to further treatments that will reduce the concentration of this identified trace metal which is capable of posing adverse threat to health. Proactive measures should take to check the levels of trace metals periodically.
Acknowledgements
The authors are highly thankful to the authorities of Acharya Nagarjuna University, Guntur, for constant support and encouragement.
No Conflict of Interest
No Conflict of interest regarding this publication.
References
- Momodu, M. A.; Anyakora, C. A. Res. J. Envi. and Earth Sci. 2010, 2, 39-43.
- Vodela, J. K.; Renden, J. A.; Lenz, S. D.; MchelHenney, W.H.; Kemppainen, B.W. Poultry Science. 1997, 76, 1474-1492.
CrossRef - Marcovecchio, J. E.; Botte, S. E.; Freije, R. H. Handbook of Water Analysis, CRC Press, London.2007.
- Batayneh, A. T. Int. J. of the Physical Sci. 2010, 5, 997-1003.
- Abderahman, N.; Abu-Rukah, Y. Env. Geology. 2006, 49, 1116-1124.
CrossRef - Adekunle, I.; Adetunji, M.; Gbadebo, A.; Banjoko, O. Int. J.l of Env. Res. and Public Health. 2007, 4, 307- 318.
CrossRef - Ferner, D. J. eMedicine Journal. 2001, 2, 1-6.
- Ikejimba, C. C.; Sakpa, S. Int. j. of Modern Biological Res. 2014, 2, 7-15.
- Afzali, D.; Taher, M. A.; Mostafavi, A.; Mobarakehs, Z. M. Talanta. 2005, 65, 476-481.
CrossRef - Shishehbore, M. R.; Nasirizadeh, N.; Shabania, M. H.; Tabatabaee, M. Can. J. Anal. Sci. Spectr. 2005, 50, 130-136.
- Ghaedi, M.; Fathi, M. R.; Marahel, F.; Ahmadi, F. Fresen. Environ. Bull. 2005, 14, 1158-1164.
- Wu, J. L.; Zeng, H. A.; Yu, H.; Ma, L.; Xu, L. S.; Qin, B. Q. Water Resource. Manage. 2012, 12, 3601–3618.
CrossRef - US EPA 1986 U.S Environmental Protection Agency, Research Triangle Park, North Carolina.1986.
- Nriagu, J. O. Environmental Pollution. 1998, 50, 139-161.
CrossRef - Osibanjo, O.; Majolagbe, A.O. Chemistry Journal. 2012, 2(2), 79-86.
- Buschmann, J.; Berg, M.; Stengel, C.; Winkel, L.; Sampson, M. L.; Trang, P. T. K.; Viet, P.H. Environment International. 2008, 34, 756–764.
CrossRef - Fraga, C. G.; Oteiza, P. I. Toxicology. 2002, 180(1), 23-32.
CrossRef - Malik, A. A. E.; Hag Ali, D. M,; Momen, A. A.; Khalid, M. A. A. Int. J. of Multi disciplinary and Cur. res. 2015, 3, 13-22.
- Mamatha, V.; Kumar Raja, J. J. Adv. Pharm.Edu. & Res. 2013, 3, 516-523.
- Chen, F.; Xu, D. D.; Tang, X. P.; Cao, J.; Liu, Y. T.; Deng, J. Spectroscopy and Spectral Analysis. 2012, 32, 239–243.
- Venkata Subba Raju, O.; Prasad, P. M. N.; Madhusudhana Reddy, K.; Rami Reddy, Y.V. World J. of Pharmacy and Pharmaceutical Sci. 2014, 3(3), 2143-2153.
- World Health Organization., Guidelines for drinking water. 4th edition; WHO, Genev, Switzerland. (2011).

This work is licensed under a Creative Commons Attribution 4.0 International License.
![]()
A New Edition of Web of Science
Journal Impact Factor
2022: 0.5
Five Year: 0.8
Journal is Indexed in

Cabells Whitelist
![]()


