Method for The Removal of Piumbum(II) Ion from Aqueous Solutions by Corn Cobas A Natural Adsorbent and from The View Point Thermodynamics
Gholamali Haghdoost and Hossein Aghaie*
Department of Chemistry, Tehran Science and Research Branch, Islamic Azad University,Tehran, Iran.
Corresponding Author E-mail: hn_aghaie@yahoo.com
DOI : http://dx.doi.org/10.13005/ojc/320322
Article Received on : May 30, 2016
Article Accepted on : June 25, 2016
Corn cob as a low-cost adsorbent were used in the present work for the removal of toxic heavy metal Pb2+ from aqueous solutions. Bath experiments were used to determine the best adsorption conditions. The equilibrium adsorption level was determined as a function of solution pH, temperature(T), contact time(tc), initial adsorbate concentration, and adsorbent dosage. Effective removal of metal ions was demonstrated at pH values of 6. Metal adsorption onto Corn cobwas evaluated by Langmuir and Freundlich isotherms. Results indicate that the Langmuir isotherm model is the most suitable one for the adsorption process using Corn cob(R2=0.9742), thus indicating the applicability of monolayer coverage of Pb(II) ion on Corn cob surface.The relationship between thermodynamic parameters was used to predict the absorption process. According to Thermodynamic analysis, the process endothermic and natural (ΔHo=-16.2 Jmol-1 and ΔSo =- 59.71 Jmol-1 K-1).
KEYWORDS:Piumbum(II); adsorption; Thermodynamic; Corn cob
Download this article as:| Copy the following to cite this article: Haghdoost G, Aghaie H. Method for The Removal of Piumbum(II) Ion from Aqueous Solutions by Corn Cobas A Natural Adsorbent and from The View Point Thermodynamics. Orient J Chem 2016;32(3). |
| Copy the following to cite this URL: Haghdoost G, Aghaie H. Method for The Removal of Piumbum(II) Ion from Aqueous Solutions by Corn Cobas A Natural Adsorbent and from The View Point Thermodynamics. Orient J Chem 2016;32(3). Available from: http://www.orientjchem.org/?p=17955 |
Introduction
Rapid industrialization has led to increased disposal of heavy metals and radio nuclides into the environment. Lead and its compounds are toxic and present in wastewater, effluents and soils1. Lead is used in some batteries, metal plating, photographic materials, explosive manufacturing and in some other application 2. The presence of lead compounds in water may damage the kidney, nervous system, Liver, blood composition, reproductive system and brain due to its accumulation in the human body. Although individual metals exhibit specific signs of their toxicity, the following have been reported as general signs associated with cadmium, lead, arsenic, mercury, zinc, nickel, copper and aluminium poisoning: gastrointestinal (GI) disorders, diarrhoea, stomatitis, tremor, heamoglobinuria causing a rust–red colour to stool, ataxia, paralysis, vomiting and convulsion, depression, and pneumonia when volatile vapours and fumes are inhaled3.Treatment processes for metal ions removal from wastewater include precipitation, reverse osmosis, Reduction, filtration, membrane processing, ion exchange, coagulation and adsorption process 4. Adsorption technique has been developed as an efficient method for treating various wastewaters, in which activated carbons from natural resources have been used as efficient and economical adsorbents for removing heavy metal pollutants 5.The use of activated carbons to remove Pb (II) from water was proposed because of their high surface areas and active functional groups leading to a search for low-cost adsorbents in recent years. Indeed agricultural waste for example, has two advantages. First, waste material is converted to useful, value-added adsorbents. Disposal of agricultural by-products has become a major costly waste disposal problem. Second, produced activated carbons are used for removing organic chemicals and metals from wastewater 6-9. Corn cob, flamboyant pods, apricot stone, almond shell, nut shell, peach stone, oat hulls, coconut husk, coconut shell, hazelnut shell, grape seed, olive stone and Rosa cantina sp. Seeds 10-11 have been used for activated carbon productionZiziphus spina-christi is a plant that grows into a tree with thorny branches and is used as a hedge to form defensive fences for cattle. The fruit has a sweet edible pulp, the leaves are applied locally to sores, and the roots are used to cure and prevent skin diseases 12. Cedar with scientific name of Zizyphus spina christi grows in Saudi Arabia, north of Africa, and in Iran in provinces of Khuzestan, Fars, and Hormozgan. Such as: Iran. Jujube fruits are consumed fresh or processed into beverage and food. In the present study, Corn cobprepared used as an adsorbent to remove Pb (II) from aqueous solutions. The adsorption of Pb2+ ions onto Corn cobwas studied in batch equilibrium conditions. The effects of different parameters including pH, initial metal ion concentration, contact time, Corn cobdosage and temperature were investigated. Langmuir and Freundlich isotherm models were used to analyze the equilibrium data.
Experimental Apparatus and Materials
An AA 680 model atomic absorption spectrometer (Shimadzu Co.) was used for measuring the concentration of Pb2+ ion in studied solutions, a 820A model pH meter (Metrohm Co.) was used to measure pH of solutions and a thermostatic orbit incubator shaker neolab model (India) was used to measure contact time in solution. All chemical materials used in this study were of analytical grade. Corn cobprepared by chemical activation with KOH was characterized. Lead nitrate, was purchased from Merck Company.
Batch adsorption experiments
Batch adsorption experiments were carried out to determine the Pb2+ ions adsorption isotherm onto Corn coband its thermodynamic properties. Pb2+ ions stock solution (100 mg.L-1) was prepared by dissolving the appropriate quantity of Pb (NO3)2 salt in deionized water. Adsorption isotherms were obtained by using initial Pb2+ion concentration,Co, and its equilibrium concentration, Ce, at 298K.The effect of pH on the Pb2+ ions adsorption onto Corn cobwas conducted in a pH range of 4-10.The pH of solutions was adjusted by 0.1 M HCl or 0.1M NaOH solutions. For every experiment, 100ml of the solution with Pb2+ concentration of 10 mg.L-1 was mixed with 50 mg of Corn cobin a 250ml glass conical flask. The flask was shaken in a thermostatic orbit shaker at 220rpm for 60min. The mixed was filtered through a 0.45 μm membrane filter. The filtrate was measured by atomic absorption then, the adsorption percentage (%A) was determined as:
Where Co and Ce are the initial and final concentration of Pb2+ion in solution (mg L-1), respectively. qe, Amount adsorbed per unit weight of adsorbent at equilibrium (mg g-1) was calculated using the following equation:
![]()
Where mW is the mass of Corn cob(g) and V is the volume of the solution (L). To evaluate the thermodynamic properties of the adsorption process, 50 mg of Corn cobwas added into the 100 ml solution with pH of 6.0 and initial Pb2+concentration ranging from 10 mg.L-1 in every experiment. Each solution was shaken continuously for 60min 13-15.
Results and Discusston Adsorption study Surface morphology
Figures1 and 2 show the SEM images of Corn cobbefore and after adsorbents.Corn cobsurface morphology before and after the absorption process in Figure 1 and 2 is shown. It is apparent porosity of the adsorbent and is the reason for the sinking of many metal ions absorbed by the absorbent biological. By comparing Figures 1 and 2 can be said that the difference created in the image after the capture metal ions adsorbed on the surface SEM evidence is catchy.
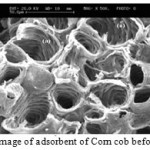 |
Figure 1: SEM image of adsorbent of Corn cob before biosorption. Click here to View Figure |
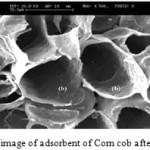 |
Figure 2: SEM image of adsorbent of Corn cob after biosorption. |
The effect of pH
Solution pH is one of the most important parameters to determine. The pH is one of most important environmental factor influencing not only site dissociation, but also the solution chemistry of the heavy metals. The pH value of the solution is an important controlling parameter in the adsorption process. 16. Table 1 and fig. 3 illustrate the effect of the pH of the solution on the adsorption percentage of Pb2+ ion adsorbed onto Corn cob. The best results were obtained at pH=6 for lead. The decrease of the adsorption percentage in acidic pH can be attributed to the repulsion between positive charge surface of Corn coband Pb2+.Increase in metal removal with increase in pH can be explained on the basis of a decrease in competition between proton and metal cations for same functional groups and by decrease in positive surface charge, which results in a lower electrostatic repulsion between surface and metal ions. Decrease in adsorption at higher pH is due to formation of soluble hydroxyl complexes.
Table 1: The effect of initial pH of the solution on the adsorption percentage (%A) of Pb2+
(Co=10 mg.L-1, WCorn cob=50 mg, T=298K, tc=60min)
| pH | 4 | 5 | 6 | 7 | 8 | 9 | 10 |
| %A | 59.2 | 64.5 | 75 | 73.2 | 71.4 | 68.5 | 65 |
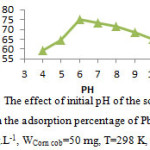 |
Figure 3: The effect of initial pH of the solution on the adsorption percentage of Pb2+ Click here to View Figure |
The effect of Corn cob dosage
The effect of Corn cobdosage on the adsorption percentage of Pb2+ ion are shown in table 2 and ploted in fig. 4. We concluded that the dosage of 50 mg of Corn cobwas the most suitable. After optimum dosage, all active sites are entirely exposed and the adsorption on the surface is saturated.
Table 2: The effect of Corn cobdosage on the adsorption percentage (%A) of Pb2+
(Co=10 mg.L-1, pH=6, T=298K, tc=60 min)
|
WCorn cob / mg |
10 | 20 | 30 | 40 | 50 | 60 |
| %A | 45 | 51 | 58.2 | 63.1 | 81.5 | 81.5 |
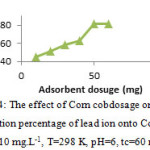 |
Figure 4: The effect of Corn cobdosage on the adsorption percentage of lead ion onto Corn cob Click here to View Figure |
The effect of temperature
Table 3 and fig. 5 show that the adsorption percentage decrease with increasing temperature. Therefore, it may be concluded that the interaction between Pb2+ ions and Corn cobis exothermic in nature. Adsorption decrease may be due to increase the electrostatic repulsion between of the Pb2+ ions.
Table 3: The effect of temperature on the adsorption percentage (%A) of Pb2+
(Co=10 mg.L-1, WCorn cob=50 mg, pH=6, tc=60 min)
| T / K | 298 | 308 | 318 | 328 | 338 | 348 |
| %A | 63 | 68 | 76 | 81.4 | 81.4 | 79 |
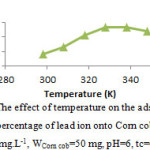 |
Figure 5: The effect of temperature on the adsorption percentage of lead ion onto Corn cob Click here to View Figure |
The effect of contact time
The effect of contact time, tc , on the adsorption percentage of Pb2+ ion onto Corn cobare shown in table 4 and ploted in fig. 6. A rather fast up take occurs during the first 50 min of the adsorption. It becomes slower as the adsorbed amount of Pb2+ ion reaches its equilibrium value. It can be seen that the adsorption process is rapid due to the availability of very active sites on the adsorbent surface at initial stage. This may be due to the special one atom layered structure of Corn cob17.At first adsorption capacity was a slow process then increases rapidly, it attains equilibrium and saturation gives constant adsorption value. The optimum contact time was obtained as 65 min.
Table 4: The effect of contact time, tc, on the adsorption percentage (%A) of Pb2+ ions
(Co=10 mg.L-1, WCorn cob=50 mg, pH=6, T=328 K)
| tc/min | 5 | 20 | 35 | 50 | 65 | 80 |
| %A | 40 | 55 | 67 | 80 | 82 | 82 |
Adsorption isotherm
Table 5: Adsorption data for Pb2+ adsorption onto Corn cob
(pH=6, tc=65 min, T=328 K, WCorn cob=50 mg)
| Parameter |
Value |
|||||
| C0 /mg L-1 | 2 | 4 | 6 | 8 | 10 | 12 |
| %A | 52 | 54.2 | 56.8 | 63.4 | 70.2 | 75.8 |
| Ce / mg L-1 | 0.96 | 1.832 | 2.6 | 2.93 | 2.98 | 2.904 |
| qe / mg g-1 | 2.08 | 4.336 | 6.8 | 10.14 | 14.04 | 18.192 |
| log Ce | -0.018 | 0.263 | 0.41 | 0.47 | 0.5 | 0.46 |
| log qe | 0.32 | 0.64 | 0.833 | 1.006 | 1.147 | 1.26 |
| 1/Ce /L mg-1 | 1.042 | 0.55 | 0.4 | 0.341 | 0.335 | 0.344 |
| 1/qe /g mg-1 | 0.481 | 0.291 | 0.15 | 0.1 | 0.07 | 0.05 |
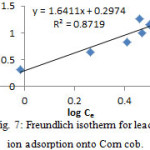 |
Figure 7: Freundlich isotherm for lead ion adsorption onto Corn cob. |
The slope and intercept of plot of 1/qe versus 1/Ce is shown in fig. 8 that were used to calculate the values of b and qm (table 6).
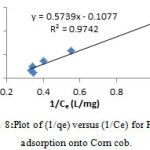 |
Figure 8: Plot of (1/qe) versus (1/Ce) for Pb+2 adsorption onto Corn cob. |
Table 6: The resultant values for the studied isotherms in connection to Pb+2 ion adsorption onto Corn cob at 298K
| Isotherm | Parameter | Value |
| Freundlich | P /(L g-1) | 2 |
| n | 0.61 | |
| R2 | 0.8719 | |
| Langmuire | b / (L mg-1) | 0.2 |
| qm /(mg g-1) | 9.3 | |
| R2 | 0.9742 |
The essential features of a Langmuir isotherm can be expressed in terms of a dimensionless constant separation factor or equilibrium parameter, RL that is used to predict if an adsorption system is favourable or unfavourable. The essential characteristic separation constant factor, RL, for the Langmuire adsorption is defined as follows:
![]()
The value of RL illustrate the shape of the isotherm to be either unfavorable (RL>1), linear (RL=1), favorable (0<RL<1) or irreversible (RL=0).
Table 7: Separation factor for the adsorption of Pb2+ onto Corn cob in terms of initial concentration of Pb2+
| Co / mg L-1 | 2 | 4 | 6 | 8 | 10 | 12 |
| RL | 0.71 | 0.6 | 0.5 | 0.4 | 0.33 | 0.3 |
The calculated RL values versus initial Pb2+ concentration are given in table 7, indicating that the Langmuire adsorption of Pb2+ onto Corn cob is favorable.
Thermodynamic Parameters
The thermodynamic parameters of adsorption process can be determined from the variation of thermodynamic equilibrium constant, Ko22-24.WhereKo is defined as follow:
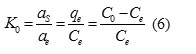
Where aad and as are the activity of adsorbed Pb2+ and the activity of Pb2+ in solution at equilibrium, respectively. The adsorption standard free energy change (ΔG0) is calculated according to:
![]()
The average standard enthalpy change (ΔHo) and the average standard entropy change (ΔSo) are obtained from the plot of equation (8):
![]()
In order to obtain the values of ΔHo and ΔSo, was plotted lnKo against 1/T (table 8, fig. 9).
Table 8: The effect of temperature on Ko values
(Co=10 mg.L-1, pH=6, WCorn cob=50 mg, tc=65 min)
| T/K | 298 | 308 | 318 | 328 | 338 | 348 |
| %A | 63 | 68 | 76 | 81.4 | 81.4 | 79 |
| K0 | 1.7 | 2.13 | 3.17 | 4.38 | 4.38 | 3.96 |
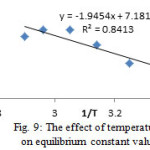 |
Figure 9: The effect of temperature on equilibrium constant values. |
The obtained values of thermodynamic parameters (ΔG0, ΔH0, ΔS0) are listed in table 9. The positive value of ΔH0 suggests that the interaction of adsorbed Pb+2 with Corn cob is an endothermic process, which is supported by the decreasing the amount of lead ion adsorption with increasing temperature. The positive value of ΔSo indicates a increased randomness and mobility at the adsorbent-solution interface during the adsorption of lead ion onto Corn cob. The negative values of ΔG0 reveals the fact that the adsorption process is spontaneous.
Table 9: Thermodynamic parameters for adsorption Pb+2 ions onto Corn cob
| T /K | ΔGo/kJmol-1 | ΔHo/Jmol-1 | ΔSo /Jmol-1 K-1 |
| 298 | -1.31 | 16.2 | 59.71 |
| 308 | -1.92 | 16.2 | 59.71 |
| 318 | -3.04 | 16.2 | 59.71 |
| 328 | -4.04 | 16.2 | 59.71 |
| 338 | -4.16 | 16.2 | 59.71 |
| 348 | -3.82 | 16.2 | 59.71 |
Conclusion
The results of this work show that Corn cobis an effective adsorbent for removal of Pb2+ ion from aqueous solution. Results showed that the Langmuir isotherm model was fitted well with adsorption data, thus indicating the applicability of monolayer coverage of Pb2+ ion on Corn cobsurface. Thermodynamic analysis showed that the adsorption process is endothermic and spontaneous in nature.
References
- Sun, S.; Wang, L.; Wang, A. Journal of Hazardous Materials. 2006,136, 930-937.
CrossRef
- Amarasinghe, B.M.W.P.K.; Williams, R.A. Chemical Engineering Journal. 2007,132, 299-309.
CrossRef - Goel, J.; Kadirvelu, K.; Rajagopal, C.; Garge, V.K. Journal of Hazardous Materials. 2005, 125, 211-220.
CrossRef - Netzer, A.; Hughes, D.E. Water Research. 1984, 18, 927-933.
CrossRef - Kadirvelu, K.; kavipriya, M.; Karthika, C.; Radhika, M.; Vennilamani, N.; Pattabhi, S. Bioresour Technol. 2003, 87, 129-132.
CrossRef - Vijayaraghavan, K.; Winnie, H.Y.N.; Balasubramanian, R. Desalination. 2011, 266, 195-200.
CrossRef - Abdul Halim, A.; Abdul Aziz, H.; Johari, M.A.M.; Ariffin, K.S. Desalination. 2010, 262, 31-35.
CrossRef
- Kilic, M.; Apaydin-Varol, E.; Putun, A.E. Journal of Hazardous Materials. 2011, 189, 397-403.
CrossRef - Matos, J.; Nahas, C.; Rojas, L.; Rosales, M. Journal of Hazardous Materials. 2011, 196, 360-369.
CrossRef - Bazargan-Lari, R.; Bahrololoom, M.E.; Nemati, A. Journal of Food, Agriculture & Environment. 2011, 9, 892-899.
- Mozammel, H.M.; Masahiro, O.; Bahattacharya, S.C. Biomass and Bioenergy. 2010, 22, 397-400.
CrossRef - George, Z.K. Journal of Hazardous Materials. 2012, 5, 1826-1840.
- Demiral, H.; Demiral, I.; Karabacakoglu, B.; Tumsek, F. Chem. Eng. Res. Des. 2011, 89, 206-213.
CrossRef - Montes-Moran, M.A.; Suarez, D.; Menendez, J.A.; Fuente, E. J. Carbon. 2004, 42, 1219-1225.
CrossRef - Srinivasan, S.; Chelliah, P.; Srinivasan, V.; Stantley, A. B.; Subramani, K. Orient. J. Chem.2016, 32(1).
- Yimenez-Reyes, M.; Solache-Rios, M. J. Hazard, Mater. 2010, 180, 297-302.
CrossRef - Wu, Y.; Zhang, S.; Guo, X.; Huang, H. Technol. 2008, 99, 7709- 7715.
- Yang, C.H. J. Colloid interface Sci. 1998, 208, 379-387
- Niwas, R.; Gupta, U.; Khan, A.A.; Vavshney, K.G. Colloids surf. 2000, A 164, 115-119.
- Hutson, N.D.; Yang, R.T. Adsorption. 1997, 3, 189-195
CrossRef - Tan, C.Q.; Xiao, D. J. Hazard. Mater. 2009, 164, 1359- 1363.
CrossRef - Barkat, M.; Nibou, D.; Chearouche, P.; Mellah, A. Chem. Eng. Process. 2009, 48, 38-47.
CrossRef - Hashemian, S.; Parsaei, Y. Orient. J. Chem. 2015, 31(1), 177-184.
CrossRef - Mohammadkhani, S.; Gholami, M.R.; M. Aghaie. Orient. J. Chem. 2016, 32(1), 591-599.
CrossRef

This work is licensed under a Creative Commons Attribution 4.0 International License.
![]()
A New Edition of Web of Science
Journal Impact Factor
2022: 0.5
Five Year: 0.8
Journal is Indexed in

Cabells Whitelist
![]()


