Adsorption Capacity of The As-Synthetic Graphene Oxide for The Removal of Alizarin Red S Dye from Aqueous Solution
Materials Chemistry Research Center, Department of Chemistry and Center of Excellence for Innovation in Chemistry, Faculty of Science, Khon Kaen University, Khon Kaen 40002, Thailand.
Corresponding Author E-mail: sakcha2@kku.ac.th
DOI : http://dx.doi.org/10.13005/ojc/320314
Download this article as:
![]()
This research was aimed to study the adsorption of Alizarin Red S (ARS) dye using graphene oxide (GO) as an adsorbent compared with bare graphite powder (BGP). For optimum conditions, the effects of the initial concentration of ARS, solution pH, adsorbent dosage, and contact time were investigated in detail. The optimum conditions for this work were consisted of 350 mg/L initial concentration of ARS with 0.02 mg adsorbent at pH 2.0. The adsorption equilibrium was completely reached within 30 min. The maximum adsorption capacity of GO was 88.50 mg/g which was higher than that of BGP (34.13 mg/g). The adsorption kinetics well fitted using a pseudo second-order kinetic model. The intraparticle diffusion model described that the intraparticle diffusion was not the only rate-limiting step. In thermodynamics diversion, changes in free energy (DG˚), enthalpy (DH˚) and entropy (DS˚) were also evaluated. The overall adsorption process was exothermic and spontaneous in nature. The adsorption isotherms for GO and BGP fit well with the Langmuir and Freundlich models, respectively. It is, therefore, evident that the as-prepared GO can be used as a high potential adsorbent for the anionic dye and it can be reused for fourth time of adsorption.
KEYWORDS:Graphene oxide; Alizarin Red S; Adsorption isotherm; Thermodynamics; Kinetics
Introduction
Textile dyeing process is an important source of an environmental pollution. One of the most problems of textile wastewater in addition to both toxic and carcinogenic nature is color effluent. Particularly, alizarin red S (ARS) is one of anionic dyes which is widely used for dyeing textile materials. The removal of ARS is crucial process from both economical and environmental points of view1. Various techniques for the removal of ARS from wastewater have been studied over the years, such as co-precipitation2, photocatalysis3, gliding arc discharge4, Fenton and Fenton like process1, electrochemical treatment5, fungal degradation6, Photocatalysis7 and adsorption8-9. Among those techniques, adsorption has been found to be promising process superior to the other techniques for dye wastewater treatment in many advantage terms including operational cost, relative simplicity of design, easier operation and insensitivity to toxic matters10. This technique is relied on interactions between adsorbent and adsorbate.
Various adsorbents that have been studied for the removal of ARS including multiwalled carbon nanotubes11, cynodon dactylon12, mentha waste13, Citrullus lanatus Peels14, mustard husk10, magnetic chitosan15, alumina16, activated clay modified by iron oxide8, activated carbon and other carbon-based materials17-19. However, new adsorbents are recently developed to possess high capacity, larger specific surface area and high selectivity because some adsorbents are still low efficiency or adsorption capacity. One of the adsorbents of choice is graphene oxide, which is a new kind of carbon-based materials that draws increasing attentions in recent years. It consists of non-specific functional groups (carbonyl, hydroxyl and epoxide) on their surface providing anchor sites for both dye and metal ion complexation20. The abundance of the functional groups on the GO surface exhibits a capability of GO for both cationic and anionic pollutants adsorption such as methylene blue20, congo red21, acridine orange22, malachite green23, methyl orange24, methyl violet, rhodamine B and orange G25 and lead26. However, our review has revealed that no research concerns on the removal of ARS by adsorption using graphene oxide as an adsorbent. Hence as a novel point of view, the use of graphene oxide for the ARS removal from aqueous solution is extensively studied.
In this study, the GO was chemically produced from graphite materials and applied to remove ARS from aqueous solution. An evaluation of its potential use as the adsorbent for ARS removal in a batch adsorption study was compared with its bare graphite. Both of Langmuir and Freundlich isotherms, adsorption kinetics and thermodynamics parameters were investigated in details to find out the adsorption capacity for ARS removal from aqueous solution.
Materials and Methods
Materials apparatus
Alizarin red S (C14H7NaO7S) was obtained from Sigma-Aldrich and each of their working solutions was prepared in deionized water. All other reagents used were of analytical reagent grade including sodium nitrate (NaNO3), sulfuric acid (H2SO4, 98%), hydrogen peroxide (H2O2, 30%), ethanol (C2H5OH), potassium permanganate (KMnO4) and synthetic graphite power (< 20 µm). Alizarin red S in the supernatant solution was determined using UV-Visible spectrophotometer (Agilent 8453, Germany) at a wavelength of 422 nm.
Preparation of graphene oxide
Graphene oxide adsorbent was prepared from graphite powder by using the optimum conditions of our previous work27 with the modified Hummers’ method28. Briefly, 3.0 g of graphite and 300 mL of 98% H2SO4 were mixed together followed by the addition portion-wise of 3.0 g of NaNO3 under constant stirring. Subsequently, a solid powder of KMnO4 (4.5%, w/v) was added to the mixture, which always controlled below 10˚C in an ice bath. The mixture was stirred for 30 min and the resulting solution was diluted by adding 200 mL of water under vigorous stirring. After that, heated to 80˚C for 6 h and to ensure completion of the reaction with KMnO4, 40 mL of 30% H2O2 was slowly added. The mixture solution was centrifuged and washed several times with deionized water until the filtrate pH reached neutral. The lyophilized precipitates were subsequently obtained.
Adsorption experiment
The adsorption experiment was carried out by using standard batch method in the aqueous suspension of graphene oxide at temperature of 30, 40, 50 and 60˚C. In this work, the experiments were performed to observe the effects of solution pH, initial concentration of adsorbate, adsorbent dosage, contact time and temperature. For the adsorption study, 25 mL of the dye solution of desired concentration and a fixed amount of graphene oxide were mixed and taken into a 125-mL conical flask. The flask was then agitated on an orbital shaker (approximately 200 rpm) under optimum conditions. After the equilibrium established, the suspension adsorbent was separated from the solutions by centrifugation for 5 min and the supernatant solution was determined spectrophotometrically at 422 nm. All experiments were conducted in triplicate under the same conditions. The adsorption capacity (qe, mg/g) of the dye at an equilibrium state was calculated using the following equation:
where Co is the initial concentration (mg/L) of the dye in solution, Ce is the dye concentration (mg/L) at the equilibrium state, V is the volume (L) of the solution, and m is the mass (g) of the adsorbent.
Desorption experiment
Desorption experiment was performed by a batch process under similar conditions using 350 mg/L dye concentration with 0.02 g adsorbent. The desorption process was carried out by shaking the dye loaded adsorbent in 25 mL of three eluents with various pH solutions including sodium hydroxide, hydrochloric and deionized water. After shaking (about 200 rpm) for 3 h at ambient temperature, the adsorbent solid was separated from the solution by centrifugation for 5 min at 5000 rpm, and then the dye concentration was determined for the desorption extent. The percentage of desorption was calculated using the following equation:
where Cdes and Cad are the desorbed and adsorbed concentration of the dye (mg/L).
Results and Discussion
Adsorption of Alizarin Red S
Effect of an initial concentration
The effect of an initial concentration for the adsorptive removal of Alizarin Red S (ARS) is very important parameter for the adsorption study because it can overcome all mass transfer restrictions of ARS between the aqueous and the solid phases, as shown in Fig. 1 showing plot of an equilibrium adsorption capacity of GO versus the initial concentration of ARS. It is clear that the adsorption capacity increases with an increasing of the initial concentration of ARS. In principle, the initial adsorbate concentration provides the necessary driving force to overcome the resistance to the mass transfer of dye between aqueous phase and solid phase of the adsorbent. In addition, the increasing of initial ARS concentration also enhanced the interactions between ARS molecules and the GO. Moreover, a variation in the extent of the adsorption may also be due to the fact that at the initial stage all active sites of the adsorbent surface are vacant and the dye concentration gradient was relatively high. The maximum adsorption capacity of this adsorbent at 350 mg/L of ARS concentration is 62.55 mg/g. A similar effect of the adsorbate concentration on the ARS removal by mustard husk was previously reported10.
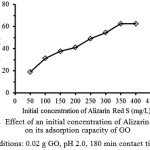 |
Figure 1: Effect of an initial concentration of Alizarin Red S on its adsorption capacity of GO (adsorption conditions: 0.02 g GO, pH 2.0, 180 min contact time and 303 K). Click here to View Figure |
Effect of pH
To determine the optimum pH of the solution for the removal of ARS, the adsorption studies were performed in a wide pH range of 1.0-8.0 as depicted in Fig. 2. The result shows that the maximum uptake of the dye at the equilibrium adsorption capacity of 70.75 mg/g was achieved at pH range of 1.0-2.0. Thereafter, the rate of adsorption decreased till pH 8.0 to be about 24.62 mg/g of the dye adsorbed. Thus, the optimum pH of the solution should be around 2.0. As reported previously, the pHpzc of GO was 4.124. Therefore, at lower pH range, the adsorption capacity of GO is higher because the sorption processed proceeds through electrostatic interactions between the positive charge of carboxylic groups on the surface (GO-COOH2+) and the anionic sulfonate groups of ARS (ARS-SO3–). So, at pH 2.0 most of their carboxylic groups were protonated at which were favorable for the adsorption of the anionic dye. On the other hand, at higher pH range, the surface of GO becomes a negative charge (-COO–), since their carboxylic groups are deprotonated and do not favor the uptake of the dye. In this study, the aqueous solution of pH 2.0 was chosen for the optimal conditions. A similar trend was observed for the biosorption of this dye sample on Citrullus lanatus Peels14 and Cynodon dactylon12.
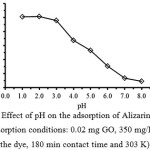 |
Figure 2: Effect of pH on the adsorption of Alizarin Red S. (adsorption conditions: 0.02 mg GO, 350 mg/L of the dye, 180 min contact time and 303 K) Click here to View Figure |
Effect of adsorbent dosage
The effect of the adsorbent dosage on the adsorption of Alizarin Red S was investigated by varying the GO from 0.02-0.20 g under other fixed conditions, as shown in Fig. 3. It is evident that the adsorption capacity of GO sorbent dramatically decreases with the increasing of the adsorbent dosage in the range of 0.02-0.04 g and then further slightly decrease. High adsorption capacity is seemed to limit with 0.02 g GO and it slightly decreases down at higher dosages. This may be attributed to the decrease in total adsorption surface area available to the counter ionic dye, resulted in an overlapping or an aggregation of the adsorption sites29. Thus, 0.02 g of GO was preferably used due to that reasonable adsorption.
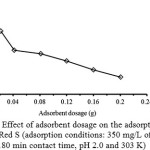 |
Figure 3: Effect of adsorbent dosage on the adsorption of Alizarin Red S (adsorption conditions: 350 mg/L of the dye, 180 min contact time, pH 2.0 and 303 K) Click here to View Figure |
Effect of contact time
To study the effect of contact time between GO adsorbent and ARS dye solution on the adsorption feature, the dye solution (350 mg/L) was treated with 0.02 g GO for various intervals of time ranging of 5-60 min with 200 rpm constant agitation. From Fig. 4, it is obviously shown that the rate of the adsorption drastically increases at the initial period of the contact time and gradually slows down with time until the equilibrium adsorption reaches its state in the range of 30-60 min. The equilibrium state was established within 30 min. At the initial stage (15 min), the rate of dye adsorption may be due to an available number of active sites on the GO surface. Their adsorption amount on the adsorbent drastically increases and is normally controlled by the diffusion process from the bulk solution to the adsorbent surface. In the final stage, the adsorption amount of the dye is likely an attachment of the controlled process due to less available sorption sites.
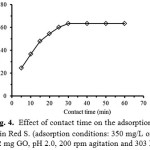 |
Figure 4: Effect of contact time on the adsorption of Alizarin Red S. (adsorption conditions: 350 mg/L of the dye, 0.02 mg GO, pH 2.0, 200 rpm agitation and 303 K) Click here to View Figure |
Thermodynamic study of the dye adsorption
In order to study the effect of temperature on the adsorption of ARS onto GO, three basic thermodynamic parameters, the Gibbs free energy change (DGº), entropy change (DSº) and enthalpy change (DHº) were calculated using the following equations:
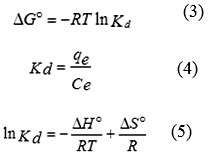
where R is the gas constant (8.314 J/mol K), T is absolute temperature in K and Kd is the equilibrium constant. qe is the amount of the dye (mg) adsorbed per gram of GO at equilibrium, Ce is the equilibrium concentration (mg/L) of the dye in solution.
The values of DSº and DHº can be calculated from the slope and the intercept of the van’t Hoff plot of ln Kd versus 1/T (Fig. 5).
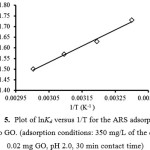 |
Figure 5: Plot of lnKd versus 1/T for the ARS adsorption onto GO. (adsorption conditions: 350 mg/L of the dye, 0.02 mg GO, pH 2.0, 30 min contact time) Click here to View Figure |
Table 1: Thermodynamic parameters of alizarin red S adsorption using graphene oxide.
| DHº (kJ/mol) | DSº (kJ/mol.K) |
DGº (kJ/mol) |
R2 |
|||
|
303 K |
313 K |
323 K |
333 K |
|||
|
– 6.30 |
– 6.40 |
– 13.61 |
– 13.90 |
– 14.16 |
– 14.33 |
0.992 |
The obtained thermodynamic parameters are shown in Table 1. Under the steady-state reaction condition, the negative DGº indicates the spontaneity of the ongoing adsorption process30. The negative value of DSº indicates a tendency to lower disorder at the solid-solution interface during the adsorption31. In addition, the negative DHº indicates that the dye adsorption using GO is the exothermic nature, the low values of DHº give clearly evidence that the interactions between the dye and its adsorbent were rather weak32. At higher temperatures the thickness of the boundary layer decreases due to the increase in tendency of the dye molecules to escape from the adsorbent surface to its bulk solution, resulting in decrease in the adsorption capacity as the temperature increases33.
Kinetic study of the dye adsorption
The kinetic adsorption data were processed to understand the nature of the adsorption phenomenon in terms of the order of the rate constant. Kinetic data were applied with both pseudo-first order kinetic model and pseudo-second-order kinetic model.
The pseudo first-order equation describes adsorption in solid-liquid systems based on the sorption capacity of solids. It has been proposed that only one ion of the dye is sorbed onto one sorption site on the GO surface. The linearized form of the pseudo first-order models can be written by following eq. (6)11, 14.
![]()
where k1 is the rate constant (L/min) of the pseudo-first order adsorption, qe and qt are the amounts of Alizarin Red S adsorbed onto adsorbent at an equilibrium (mg/g) and at time t, respectively. The values of k1 and qe are calculated from slope and intercept of the plot of log (qe-qt) versus t (Fig. 6).
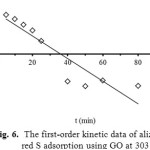 |
Figure 6: The first-order kinetic data of alizarin red S adsorption using GO at 303 K. |
The pseudo second-order rate expression has been applied for analyzing chemi-sorption kinetics from liquid solutions. From the assumption of this model, only one ion of the dye is sorbed onto two sorption sites on the GO surface. The linearized form of the pseudo second-order models can be written by following eq. (7)14, 32.
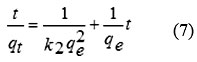
where qe and qt are the maximum adsorption capacity (mg/g) for the pseudo-second-order adsorption of alizarin red S adsorbed at an equilibrium (mg/g) at time t (min) and k2 is the rate constant of the pseudo-second-order adsorption (g/mg min). The values of k2 and qe for the pseudo-second-order adsorption were calculated from slope and the intercept of the plot of t/qt versus t (Fig. 7).
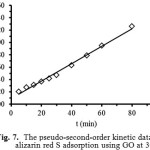 |
Figure 7: The pseudo-second-order kinetic data of alizarin red S adsorption using GO at 303 K. Click here to View Figure |
The kinetic parameters for the dye adsorption of GO at 303 K were calculated from Eqs. (6) and (7) as shown in Table 2. It is found that the pseudo-first order kinetic model is not applicable for the adsorption of ARS by GO, because it is not only correlation coefficient (R2 = 0.8422) far from unity, but also a very large difference existing between the calculated maximum adsorption capacity (qe = 45.54 mg/g) and the experimental adsorption capacity (qe,exp = 63.50 mg/g). On the other hand, for pseudo-second order kinetic model, the qe value of GO is 70.92 mg/g and the linear correlation coefficient (R2) of 0.9919 is high. Moreover, both of the calculated (70.92 mg/g) and the experimental (qe,exp 63.50 mg/g) values are close to each other. Therefore, this dye adsorption fitted well with the pseudo-second-order kinetic model.
Table 2: The kinetic parameters of alizarin red S adsorption using GO at 303 K.
| qe,exp (mg/g) | Pseudo-first order | Pseudo-second order | Intra-particle diffusion | |||
| 63.50 | qe (mg/g) | 45.54 | qe(mg/g) | 70.92 | kp (mg/g.min1/2) | 9.88 |
| k1 (min) | 0.11 | k2 (g/mg.min) | 0.15 | C (mg/g) | 10.01 | |
| R2 | 0.8422 | R2 | 0.9919 | R2 | 0.9916 | |
Adsorption mechanism
In order to gain insight into both the mechanism and rate controlling step affecting the kinetics of adsorption, the Weber’s intra-particle diffusion model was applied to the kinetic experimental section [34-35].
The kinetic results were analyzed by the intra-particle diffusion model to elucidate the diffusion mechanism. The overall rate of adsorption can be described by the following three steps including (i) film or surface diffusion where the sorbate is transported from the bulk solution to the external surface of sorbent, (ii) intra-particle or pore diffusion, where sorbate molecules move into the interior of sorbent particles, and (iii) adsorption on the interior sites of the sorbent. The intra-particle diffusion model is expressed as following Eq. (8)8, 11:
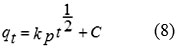
where qt is the amount of alizarin red S adsorbed at an equilibrium (mg/g) at time t, C is the intercept and kp is the intra-particle diffusion rate constant in mg/(g min1/2). The values of kp and C of the intra-particle diffusion were calculated from slope and intercept of the plot (Fig. 8) of qt versus t1/2. If the linear plot goes through the origin, it reflects that the rate limiting step is only due to the intra-particle diffusion. On the other hand, the larger the intercept is obtained, the greater the contribution of the surface sorption in the rate-limiting step36.
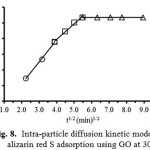 |
Figure 8: Intra-particle diffusion kinetic model of alizarin red S adsorption using GO at 303 K. Click here to View Figure |
Figure 8 shows the intra-particle diffusion for ARS adsorption using GO as an adsobent. The trend of the adsorption process is defined as three phases occurring during the adsorption process. The first portion is a transport of the dye molecules from the bulk solution onto the external surface of GO by diffusion through the boundary layer. The second one is the diffusion of the dye molecules from the external surface into the pores of the GO adsorbent. The last one is the final equilibrium stage, where the dye molecules were adsorbed on the active sites on the internal surface of the pore, and the intra-particle diffusion plot starts slowing down due to the solute concentration getting lower in the solution37. The surface adsorption mechanism was predominantly occurred within 30 min contact time. Thereafter, the diffusion route became the rate-limiting step. The intra-particle diffusion rate constant kp (mg/g min1/2) was evaluated from the slope of the second linear part of the plotting of qt versus t1/2 (Table 2). As the plot did not pass through the origin, the intra-particle diffusion was not the only rate-limiting step. Thus, there were three processes on trolling the adsorption rate but only one was the rate limiting in any particular time range. In addition, the intercept of the plot indicates the boundary layer effect. The value of C was high for GO resulting in more surface adsorption of the dye. Therefore, both surface adsorption and intra-particle diffusion mechanisms were simultaneously cooperated in the adsorption behaviors using this adsorbent.
Adsorption isotherm
For study of an adsorption isotherm, modeling of sorption isotherm data is very important point of view for predicting and comparing the adsorption performance of the adsorbent behavior. Langmuir and Freundlich models are the most frequently used to describe the adsorption isotherms.
The Langmuir model assumes that a monolayer of an adsorbate is covered on a homogenous adsorbent surface containing a finite number of the adsorption sites via uniform strategies of adsorption with no transmigration of the adsorbate taking place along the plane of the surface. This model is based on this following basic assumptions including (i) the sorption takes place at specific homogeneous site within the adsorbent; (ii) once a dye molecule occupies a site; (iii) the adsorbent has a finite capacity for the adsorbate at equilibrium, and (iv) all site are identical and energetically equivalent11. The linear form of the Langmuir isotherm is given by the following Eq. (9):
where qm is the maximum amount of dye absorbed per unit weight of adsorbent (mg/g) to form a complete monolayer covering the surface at the equilibrium state of dye concentration (mg/L), qe is the amount of dye adsorbed per unit weight of adsorbent at equilibrium, and KL is the Langmuir constant (L/mg) related to the surface affinity for the dye.
The value of qe represents a practical limiting adsorption capacity when the surface is fully covered with the dye ions. The values of qm and KL are calculated from slope and intercept of the straight line plot of Ce/qe versus Ce (Fig. 9). In addition, the essential characteristics of the Langmuir isotherm can be described by a separation factor (RL), which is given as depicted in Eq. 1015, 38-39
The value of RL indicates the shape of the Langmuir isotherm and the nature of the adsorption process. It can give an idea about the nature of adsorption equilibrium: RL > 1.0 unfavorable sorption; RL = 1.0 linear sorption; RL < 1.0 favorable sorption and RL = 0 irreversible sorption.
On the other hand, the Freundlich adsorption isotherm is also an equation that assumes a heterogeneous surface energy for which the energy term in the Langmuir equation varies as a function of a surface coverage. The application of the Freundlich equation suggests that the sorption energy exponentially decreases on completion of the sorption centers of an adsorbent. The logarithmic form of the Freundlich adsorption isotherm is expressed by the following Eq. (11)8, 30, 32:
where, KF and n are the Freundlich constant and the intensity of adsorption, respectively. The values of KF and 1/n can be obtained from a linear plot of log qe versus log Ce (Fig. 10). The 1/n value in the range of 0 and 1 is a predicting of adsorption intensity or surface heterogeneity, becoming more heterogeneous as its value gets closer to zero. In addition, the value of n varies with the heterogeneity of the adsorbent, if n < 10 and n > 1 indicating the adsorption process is favorable11.
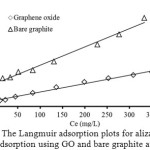 |
Figure 9:The Langmuir adsorption plots for alizarin red S adsorption using GO and bare graphite at 303 K. Click here to View Figure |
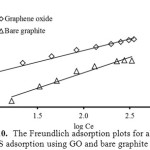 |
Figure 10: The Freundlich adsorption plots for alizarin red S adsorption using GO and bare graphite at 303 K. Click here to View Figure |
Figure 9 and Fig. 10 show the fitting plots of Langmuir adsorption and Freundlich adsorption of ARS using GO and BGP, respectively. The constant values obtained from both Langmuir and Freundlich adsorption isotherms and their correlation coefficients (R2) were calculated and are summarized in Table 3.
Table 3: Isotherm parameters and correlation coefficients calculated for the adsorption of alizarin red S using both adsorbents
| Adsorbent |
Langmuir Isotherm |
Freundlich Isotherm |
||||||
|
qmax (mg/g) |
KL |
R2 |
|
KF |
1/n |
n |
R2 |
|
| Bare graphite |
34.13 |
0.008 |
0.9861 |
0.99 |
0.60 |
1.67 |
0.9942 |
|
| Graphene oxide |
88.50 |
0.013 |
0.9918 |
5.50 |
0.45 |
2.22 |
0.9676 |
|
From Table 3, it can be concluded that for BGP, the Freundlich isotherm (R2 > 0.99) fitted the experimental results comparable to the Langmuir isotherm (R2 > 0.98). The slope 1/n provides information about surface heterogeneity and surface affinity for the solute. If a higher value of 1/n is obtained, it corresponds to the greater heterogeneity of the adsorbent surface. Furthermore, the value of n > 1 obtained from the Freundlich isotherm indicating that this process is also favorable and heterogeneous sorption. On the other hand, for GO, it can be stated that the Langmuir isotherm (R2 > 0.99) fitted the experimental results better than those of the Freundlich isotherm (R2 > 0.96) as reflected with the correlation coefficient, indicating the homogenous feature presented on the GO surface and demonstrates the formation of monolayer coverage of the dye molecule on the GO surface. Moreover, the value of RL was between 0 and 1 (RL = 0.18). This also suggests a favorable adsorption between GO and ARS dye. The maximum adsorption capacities of the dye were found to be 34.13 and 88.50 mg/g for BGP and GO, respectively.
For comparison, the maximum adsorption capacity of this dye using other adsorbents is presented in Table 4. It is evident that GO material has high adsorption capacity for the ARS removal from the aqueous solution compared with the other carbon-based adsorbents.
Table 4: Comparison of maximum adsorption capacities of alizarin red S with various carbon-based adsorbents
| Adsorbent |
qe (mg/g) |
Reference |
| Mustard husk. |
6.08 |
[10] |
| Cynodon dactylon |
16.32 |
[12] |
| Activated clay modified by iron oxide |
32.7 |
[8] |
| Chitosan coating on the surface of magnetite |
43.08 |
[15] |
| Abelmoschus esculentus Stem Powder |
75.06 |
[40] |
| Citrullus lanatus peels |
79.60 |
[14] |
| Bare graphite |
34.13 |
This work |
|
Graphene oxide |
88.50 |
This work |
Desorption of Alizarin Red S
For regeneration or reusability of adsorbent, desorption is a crucial factor for the adsorption process. If the adsorbent has higher adsorption capacity as well as better desorption property, it will reduce the overall cost of the adsorbent (Fan et al. 2012). The adsorption/desorption percentages for GO, using base solution (NaOH, pH = 8.0-12.0), DI-water (pH = 6.6) and acid solution (HCl, pH = 1.0-5.0) as the eluents (Fig. 11), are evaluated for five adsorption/desorption cycles with the same adsorbent used (Fig. 12).
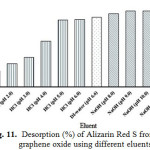 |
Figure 11: Desorption (%) of Alizarin Red S from graphene oxide using different eluents Click here to View Figure |
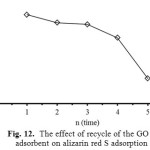 |
Figure 12: The effect of recycle of the GO adsorbent on alizarin red S adsorption Click here to View Figure |
From the results as shown in Fig. 11, the desorption percentages of ARS from GO by using HCl, DI-water and NaOH were found to be 20.1-83.9, 86.7 and 91.2-94.9, respectively. The suitable eluent desorption of ARS is base solution at pH around 9.0. It could be due to acidic nature of the functional groups on the GO surface, which is neutralized by base eluent, resulting in higher desorption event. A similar trend was observed for the desorption of ARS from Citrullus lanatus Peels14 and magnetic chitosan15. Figure 12 shows the effect of recycle on the adsorption process of ARS dye. It was found that the uptake capability of ARS using GO slightly decreased with increasing the recycle. In the first four cycles, the desorption percentage remained more than 80% and then decreased to 62.6% at the fifth of the recycle. This could be due to the fact that the positively charged carboxylic groups on the GO surface were deprotonated and the electrostatic interactions between ARS and GO became much weaker. Therefore, the GO can be reused for fourth time of the adsorption.
Conclusion
The adsorption of graphene oxide for alizarin red S removal from aqueous solution is novel reported. The optimum conditions for the adsorption were consisted of 350 mg/L initial concentration of the dye with 0.02 mg adsorbent at pH 2.0. The adsorption equilibrium was completely reached within 30 min. The maximum adsorption capacity of GO was 88.50 mg/g which was higher than that of BGP (34.13 mg/g). The adsorption kinetics well fitted using a pseudo second-order kinetic model, indicating that the overall rate of the dye uptake is controlled by an external mass transfer at the beginning step of the adsorption. The intra-particle diffusion model described that the intra-particle diffusion was not the only rate-limiting step, both surface adsorption and intra-particle diffusion mechanisms were simultaneously cooperated in the adsorption behavior using this adsorbent. Thermodynamic parameters were also evaluated, the negative DG˚ indicates the spontaneity of the ongoing adsorption process, the negative DS˚ indicates a tendency to lower disorder at the solid-solution interface during the adsorption. In addition, the negative DH˚ indicates that the dye adsorption using GO is the exothermic nature. Therefore, the overall adsorption process was exothermic and spontaneous in nature. The adsorption isotherms for GO and BGP fit well with the Langmuir and Freundlich models, respectively. It is, therefore, evident that the as-prepared GO can be used as a highly potential adsorbent for the anionic dye and it can be reused for fourth time of adsorption with high desorption percentage.
Acknowledgements
This research was financially supported by Materials Chemistry Research Center, Department of Chemistry, Center of Excellence for Innovation in Chemistry (PERCH-CIC), Faculty of Science, Khon Kaen University, Thailand, the Ministry of Science and Technology, Bangkok, Thailand.
References
- Abou-Gamra, Z.M. Eur. Chem. Bull. 2014, 3, 108-112.
- Hanif, S.; Shahzad, A. J. Nanopart. Res. 2014, 6, 2429-2443.
CrossRef - Joshi, K.M.; Shrivastava, V.S. Int. J. Environ. Sci. 2011, 2, 8-21.
- Merouani, D.R.; Abdelmalek, F.; Ghezzar, M.R.; Semmoud, A.; Adduo, A.; Brisset, J.L. Ind. Eng. Chem. Res. 2013, 52, 1471-1480.
CrossRef - Yi, F.; Chen, S. J. Porous. Mater. 2008, 15, 565-569.
CrossRef - Xu, L.; Zhu, Y.; He, X.; Han, G.; Tian, X. World J. Microbiol. Biotechnol. 2008, 24, 3097-3104.
CrossRef - Aware Dinkar, V.; Jadhav Shridhar, S.; Navgire Madhukar, E.; Athare Anil, E.; Kolhe Nitin, H. Orient. J. Chem. 2016, 32, 933-940.
CrossRef - Fu, F.; Gao, Z.; Gao, L.; Li, D. Ind. Eng. Chem. Res. 2011, 50, 9712-9717.
CrossRef - Pirillo, S.; Ferreira, M.L.; Rueda, E.H. J. Hazard. Mater. 2009, 168, 168-178.
CrossRef - Gautam, R.K.; Mudhoo, A.; Chattopadhyaya, M.C. J. Environ. Chem. Eng. 2013, 1, 1283-1291.
CrossRef - Ghaedi, M.; Hassanzadeh, A.; Kokhdan, S.N. J. Chem. Eng. Data. 2011, 56, 2511-2520.
CrossRef - Samusolomon, J.; Devaprasath, P.M. J. Chem. Pharm. Res. 2011, 3, 478-490.
- Ahmad, R.; Kumar, R. Curr. World Environ. 2008, 3, 261-268.
CrossRef - Rehman, R.; Mahmud, T. Asian J. Chem. 2013, 25, 5351-5356.
CrossRef - Fan, L.; Zhang, Y.; Li, X.; Luo, C.; Lu, F.; Qiu, H. Colloids Surf. B. 2012, 91, 1250-1257.
CrossRef - Rehman, R.; Mahmud, T.; Anwar, J.; Salman, M.; Shafique, U.; Zaman, W.Z.; Ali, F. J. Chem. Soc. Pak. 2011, 33, 228-232.
- Iqbal, M.J.; Ashiq, M.N. J. res. Sci. B. Z. Univ. 2007, 18, 91-99.
- Raut, P.A.; Dutta, M.; Sengupta, S.; Basu, J.K. Indian J. Chem. Technol. 2013, 20, 15-20.
- Velasco, U.I.; Alanís, N.C.; Gonzalez-Marcos, M.P.; Alvarez-Uriarte, J.I. J. Chem. Eng. Data. 2011, 56, 2100-2109.
CrossRef - Li, Y.; Du, Q.; Liu, T.; Peng, X.; Wang, J.; Sun, J.; Wang, Y.; Wu, S.; Wang, Z.; Xia, Y.; Xia, L. Chem. Eng. Res. Des. 2013, 91, 361-368.
CrossRef - Yan, H.; Tao, X.; Yang, Z.; Li, K.; Yang, H.; Li, A.; Cheng, R. J. Hazard. Mater. 2014, 268, 191-198.
CrossRef - Sun, L.; Fugetsu, B. Chem. Eng. J. 2014, 240, 565-573.
CrossRef - Nuengmatcha, P.; Mahachai, R.; Chanthai, S. Orient. J. Chem. 2014, 30, 1463-1474.
CrossRef - Yang, Z.; Ji, S.; Gao, W.; Zhang, C.; Ren, L.; Tjiu, W.W.; Zhang, Z.; Pan, J.; Liu, T. J. Colloid Interface Sci. 2013, 408, 25-32.
CrossRef - Ramesha, G.K.; Vijaya Kumara, A.; Muralidhara, H.B.; Sampath, S. J. Colloid Interface Sci. 2011, 361, 270-277.
CrossRef - Shojai, M.; Moghimi, A. Orient. J. Chem. 2015, 31, 85-94.
CrossRef - Nuengmatcha, P.; Mahachai, R.; Chanthai, S. Asian J. Chem. 2014, 26, 1321-1323.
CrossRef - Hummers, W.S.; Offeman, R.E. J. Am. Chem. Soc. 1958, 80, 1339.
CrossRef - Akar, E.; Altinişik, A.; Seki, Y. Ecol. Eng. 2013, 52, 19-27.
CrossRef - Mittal, A.; Thakur, V.; Gajbe, V. Environ. Sci. Pollut. Res. 2013, 20, 260-269.
CrossRef - Hadavifar, M.; Bahramifar, N.; Younesi, H.; Li, Q. Chem. Eng. J. 2014, 237, 217-228.
CrossRef - Vijayakumar, G.; Tamilarasan, R.; Dharmendirakumar, M. J. Mater. Environ. Sci. 2012, 3, 157-170.
- Saha, P.; Chowdhury, S.; Gupta, S.; Kumar, I. Chem. Eng. J. 2010, 165, 874-882.
CrossRef - Hameed, B.H.; Mahmoud, D.K.; Ahmad, A.L. J. Hazard. Mater. 2008, 158, 65-72.
CrossRef - Weber Jr, W.J.; Morris, J.C. J. Sanit. Eng. Div. Proceed. Am. Soc. Civil Eng. 1963, 89, 31-60.
- Vadivelan, V.; Kumar, K.V. J. Colloid Interface Sci. 2005, 286, 90-100.
CrossRef - Tang, H.; Zhou, W.; Zhang, L. J. Hazard. Mater. 2012, 209(210), 218-225.
CrossRef - Gupta, V.K.; Pathania, D.; Agarwal, S. Environ. Sci. Pollut. Res. 2013, 20, 2632-2644.
CrossRef - He, J.; Hong, S.; Zhang, L.; Gan, F.; Ho, Y.S. Fresenius Environ. Bull. 2010, 19, 2651-2656.
- Rehman, R.; Abbas, A.; Murtaza, S.; Anwar, J.; Mahmud, T.; Akbar, S. J. Chem. Soc. Pak. 2013, 35, 443-448.
Accepted on: June 18, 2016


![]()


