A Simple Colorimetric Procedure for Differentiating Anions Using Flower Pigments from Anthurium andreanum
Maynard O. Galingana and Voltaire G. Organo*
Department of Physical Sciences and Mathematics, College of Arts and Sciences, University of the Philippines, Manila, Philippin
Corresponding Author E-mail: vgorgano@up.edu.ph;
DOI : http://dx.doi.org/10.13005/ojc/320308
Article Received on : April 16, 2016
Article Accepted on : May 25, 2016
Article Published : 21 May 2016
A simple, “green” and colorimetric approach in differentiating various anions is presented. Acidified ethanolic extracts from flowers of Anthurium andreanum undergo color changes in the presence of HSO4-, CH3COO-, C6H5COO-, HCO3-, CO32-, HPO42- and PO43- anions in aqueous solutions. Anionic acid-base conjugate pairs such as HCO3- and CO32-, HSO4- and SO42-, and phosphates H2PO4-, HPO42-, and PO43- can also be discriminated from each other. Visible spectroscopic analysis indicates possible structural changes in pigments due to pH change of solution as a consequence of the basic property of anions.
KEYWORDS:colorimetric;Anthurium andreanum extracts;anion recognition;flower pigments
Download this article as:| Copy the following to cite this article: Galingana M. O, Organo V. G. A Simple Colorimetric Procedure for Differentiating Anions using Flower Pigments from Anthurium andreanum. Orient J Chem 2016;32(3). |
| Copy the following to cite this URL: Galingana M. O, Organo V. G. A Simple Colorimetric Procedure for Differentiating Anions using Flower Pigments from Anthurium andreanum. Orient J Chem 2016;32(3). Available from: http://www.orientjchem.org/?p=16258 |
Introduction
Interest in anion recognition has grown in recent years. This can be attributed to its significance in biological, chemical and industrial systems.1,2 Anion sensors being developed are generally composed of a recognition unit and a signalling unit.3 For example, anions can bind to a positive site in the host molecule through electrostatic interaction. Anions can also interact to its receptor via hydrogen bonding containing structural moieties such as amide,4 urea,5 thiourea,6,7 hydroxyl,8 sulfonamide,9,10 pyrrole11,12 and indole.13,14 The interaction between the recognition unit and the anion significantly affects the signalling unit, leading to changes in color, fluorescence and/or electrochemical properties of the chemosensor.3 It is believed that anion detection depends on a number of factors, namely, basicity of the anion, geometry and solvent effects.15
While these synthetic chemosensors provide good selectivity, such approaches require expensive materials and lengthy procedures for its synthesis. Moreover, anion sensing is usually performed in aprotic solvents because protic solvents can compete with the interaction between the receptor and the anion.16 The use of these organic solvents however poses serious health and environmental concerns.
On the other hand, natural pigments can be utilized as green alternatives for molecular and ion recognition. Recently, Hart well17 has cited several studies involving the use of plant-based reagents for analyses of metal ions, alcohols, formaldehyde, and H2O2, among others. Such approaches have been found suitable in teaching chemical analyses, especially in schools with limited financial resources.
The most common among these Nature-based reagents are pigments found in flower extracts. These plant-based reagents have been commonly used as acid-base titration indicators.18–20 Other laboratory experiments have used flower pigments to demonstrate basic properties of common household chemicals such as baking soda and ammonia. However, application of flower pigments for anion analysis is unprecedented to the best of our knowledge. This study attempts to differentiate anionic species based on their ability to act as bases in aqueous solution through their response to a flower-based pH indicator. The method presented here is simple, cheap and environment-friendly.
Materials and Methods
Sodium salts of NO3–, SO42-, F–, I–, CH3COO– (OAc–), C6H5COO– (BzO–), HCO3–, CO32-, H2PO4–, HPO42- and PO43- and potassium salts of SCN–, HSO4–, Cl– and Br– used in this study were of analytical grade and the solutions were prepared with distilled water.
Fifty grams of flower petals from Anthurium andreanum were washed with distilled water, macerated or soaked in acidified ethanol (0.1% v/v HCl), refrigerated for 1 day and filtered. Qualitative tests were performed to confirm the presence of anthocyanins, according to published procedures.21 Two-milliliter aqueous solutions of anion salts, each having a concentration of 0.010 M, were prepared in separate vials. One milliliter of the flower extract was added to each vial. A separate vial which only contains the flower extract served as control. The mixtures were then shaken and color changes were noted. The absorption spectra of all mixtures were generated from 700 nm to 300 nm through Hitachi U-2900 spectrophotometer. The pH of the solutions prior to addition of the extract was measured using Hanna Instruments HI 98103 Checker pH meter.
Results and Discussion
Several studies have been conducted utilizing pigments from flowers as pH indicators.22 Pigments such as anthocyanins are known to be influenced by changes in pH, producing varied colors from red to blue to yellow.23 For example, the red-colored flavyliun cation is the predominant species at pH 1, while the blue quinoidal species predominates at pH 4. Depending on the pH of the solution, phenolic hydroxyl groups in the anthocyanin rings are protonated or deprotonated, shifting the equilibrium towards the corresponding anthocyanin form as flavylium cation, quinoidal base, carbinol pseudobase or chalcone.24 Colors of the pigments may also vary depending on the substituents and presence of hydroxyl or alkoxy groups on the aromatic rings of anthocyanins.25
Anions can act as Arrhenius or Bronsted-Lowry bases which can alter the pH of a solution or directly deprotonate phenolic groups of pigments, and consequently, change the color of pigments. Thus, anions can be differentiated indirectly from each other according to its base strength (Kb). In this study, flower extracts from Anthurium andreanum have been applied as a source of pigments which can be used as potential reagent for differentiating anions in aqueous solution. Qualitative analysis of the anthurium extract has confirmed the presence of anthocyanins. Previous studies have identified these pigments as glycosylated anthocyanin derivatives such as pelargonidin and cyanidin 3-rutinoside.26 These pigments have acidic phenolic groups which can
potentially interact with basic anions and cause color changes.
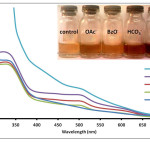 |
Figure 1: Absorption spectra of Anthurium flower extracts upon addition of 0.010 M aqueous solutions of OAc–, BzO–, HCO3–, and CO32- anions. Insert: Visual color changes of solutions containing flower extracts and corresponding anions. Click here to View figure |
Fig. 1. Absorption spectra of Anthurium flower extracts upon addition of 0.010 M aqueous solutions of OAc–, BzO–, HCO3–, and CO32- anions.Insert: Visual color changes of solutions containing flower extracts and corresponding anions.
Results show that solutions containing OAc–, BzO–, HCO3–, and CO32- changed color after mixing with anthurium extract (Fig. 1 insert). Color of the pigments changed from maple to brown. It was also observed that at the same concentration, OAc–, BzO–, HCO3– and CO32- differ from one another through varying intensities of brown color. Absorbance spectra of the solutions showed a slight increase in absorbance at 500 nm for BzO– and at 500-600 nm for OAc– anion compared to the control solution (Fig. 1). Interestingly, the solution treated with CO32- exhibited a color change from maple to dark brown compared to its conjugate acid, HCO3– which produced a lighter brown color. Solutions containing HCO3– or CO32- exhibited a higher absorbance at lmax = 330 nm, 500 nm and 600 nm compared to the extract solution and to solutions containing OAc– and BzO– anions. Narciso27 observed a similar increase in absorbance at these wavelengths when the extract is subjected to alkaline pH. It was noted that solutions of anions were found to increase from pH 7 for BzO– and OAc– anions to pH 9 for HCO3– and pH 11 for CO32-. This change in solution pH may be responsible for the color change since flower pigments are affected by pH.24 On the other hand, anions can also interact directly with pigments in the anthurium extract via acid-base reaction (Fig. 2). It has been shown previously28 that OAc– can provide structural information on several flavonoids by acting as a Bronsted-Lowry base against strongly acidic phenolic hydroxyl groups. Thus, anions such as BzO–, HCO3– and CO32- can also react with anthurium pigments in a similar manner. The observed color change can be correlated to the anion’s base strength. According to literature,29 the base strength of the anions is arranged in the following order: BnO– < OAc– < HCO3– < CO32-. This pattern corresponds well with the increasing intensity of brown color and the corresponding increase in absorbance from 300 nm to 600 nm.
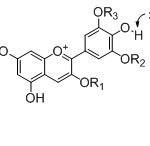 |
Figure 2: Proposed interactions between anthurium pigments (anthocyanins) and anions. Click here to View figure |
Fig. 2. Proposed interactions between anthurium pigments (anthocyanins) and anions.
Another interesting result was noted when flower extracts were treated
separately with the conjugate pairs, HSO4– and SO42-. It was observed that HSO4– was able to change the color of the extract from maple to cherry red. SO42- anion, however, did not result in a color change. Absorption spectra of the solution containing SO42- showed a slight increase in absorbance compared to the control solution (Fig. 3). This difference however was not significant enough to be detected by the naked eye. On the other hand, formation of an absorption band at 510 nm exhibited by the HSO4–-containing solution is consistent with the observed color change. It was also noted that similar weak bases such as F–, NO3–, SCN–, Cl–, Br– and I– did not cause a color change of the pigments as shown in Fig. 4. Compared to other oxy-anions such as HCO3–, H2PO4– and HPO42-, only HSO4– has shifted the color of the flower extract to a reddish color. This color change is also produced when the anthurium extract is placed in slightly acidic pH.27 It has been noted that the HSO4– solution has an acidic pH prior to addition of the flower extract. In contrast, solutions of the halides, NO3–, SCN– and SO42- were found to have pH 5-6. Hence, it is possible that HSO4– may have acted as a Bronsted-Lowry acid instead of a base. The absorption band produced at 510 nm can be attributed to the formation of flavylium cation.30 The flavylium cation produces an orange to purple color and exists predominantly at lower pH. Furthermore, HSO4– anion is a relatively stronger acid compared to HCO3–, HPO42- and H2PO4–. This may account for the selective recognition of HSO4– by anthurium pigments.
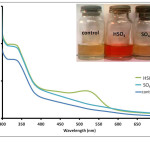 |
Figure 3: Absorption spectra of Anthurium flower extracts upon addition of 0.010 M aqueous solutions of HSO4–, and SO42- anions. Insert: Visual color changes of solutions containing flower extracts and corresponding anions. Click here to View figure |
Fig. 3. Absorption spectra of Anthurium flower extracts upon addition of 0.010 M aqueous solutions of HSO4–, and SO42- anions. Insert: Visual color changes of solutions containing flower extracts and corresponding anions.
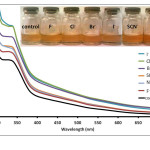 |
Figure 4: Absorption spectra of Anthurium flower extracts upon addition of 0.010 M aqueous solutions of F–, Cl–, Br–, I–, NO3–, and SCN– anions. Insert: Visual color changes of solutions containing flower extracts and corresponding anions. Click here to View figure |
Fig. 4. Absorption spectra of Anthurium flower extracts upon addition of 0.010 M aqueous solutions of F–, Cl–, Br–, I–, NO3–, and SCN– anions.Insert: Visual color changes of solutions containing flower extracts and corresponding anions.
Anthurium pigments were also able to distinguish the different ionic phosphate species PO43-, HPO42- and H2PO4–. Solution containing PO43- changed the pigment color to dark violet while HPO42- produced a dark brown solution. On the other hand, H2PO4– did not result in a color change with the flower extract. Absorption spectra for solutions treated with various ionic phosphate species are shown in Fig. 5. H2PO4– caused an
increase in absorbance compared to the extract solution. This however did not result in a color change via visual inspection. On the other hand, a broad band from 460-590 nm, which may be a product of several overlapping bands, was observed for HPO42--treated solution. Presence of PO43- anions also led to spectral changes similar to that for HPO42- but with higher absorbances at shorter wavelengths (below 590 nm). Ability of the pigments to distinguish the different ionic phosphate species can also be attributed to the basic properties of these anionic species. Likewise, the pH of the solution also increased from pH 6 to pH 12 for H2PO4– to PO43-. This corresponds well with the observed color change of the pigment towards basic solution.27
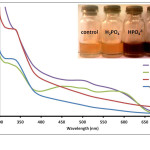 |
Figure 5: Absorption spectra of Anthurium flower extracts upon addition of 0.010 M aqueous solutions of H2PO4–, HPO42-, and PO43- anions. Insert: Visual color changes of solutions containing flower extracts and corresponding anions. Click here to View figure |
Fig. 5. Absorption spectra of Anthurium flower extracts upon addition of 0.010 M aqueous solutions of H2PO4–, HPO42-, and PO43- anions. Insert: Visual color changes of solutions containing flower extracts and corresponding anions.
Conclusion
This study has shown that pigments in the flowers of Anthurium andreanum can be employed in differentiating anions in aqueous solvent. Anthurium pigments undergo various color changes in the presence of equimolar concentrations of HSO4–, OAc–, BzO–, HCO3–, CO32-, HPO42- and PO43- anions. The pigments are particularly useful in differentiating anion acid-base conjugate pairs like HSO4–/SO42-, HCO3–/CO32-, and inorganic phosphate species H2PO4–, HPO42- and PO43-. The study also demonstrates the general utility of natural pigments as reagents for colorimetric anion recognition based on its basic properties. This approach is simple, cheap, and applies principles of Green Chemistry. The method presented here also allows for naked-eye, colorimetric qualitative analysis of various anions, and therefore does not require any sophisticated equipment. Hence, this approach can be used as a simple experiment in any educational setting to teach chemistry concepts such as acid-base reactions, base strength, ionic equilibrium and chemical analysis of anions.
References
- Gale, P. A.; Busschaert, N.; Haynes, C. J. E.; Karagiannidis, L. E.; Kirby, I. L. Chem. Soc. Rev. 2014, 43, 205–241.
CrossRef - Gale, P. A. Chem. Soc. Rev. 2010, 39, 3746–3771.
CrossRef - Martínez-Máñez, R.; Sancenón, F. Chem. Rev. 2003, 103, 4419–4476.
CrossRef - Brooks, S. J.; Gale, P. A.; Light, M. E. Chem. Commun. 2006, 4344–4346.
CrossRef - Amendola, V.; Fabbrizzi, L.; Mosca, L. Chem. Soc. Rev. 2010, 39, 3889–3915.
CrossRef - Misra, A.; Shahid, M.; Dwivedi, P. Talanta 2009, 80, 532–538.
CrossRef - Nie, L.; Li, Z.; Han, J.; Zhang, X.; Yang, R.; Liu, W.-X.; Wu, F.-Y.; Xie, J.-W.; Zhao, Y.-F.; Jiang, Y.-B. J. Org. Chem. 2004, 69, 6449–6454.
CrossRef - Hijji, Y. M.; Barare, B.; Zhang, Y. Sensors Actuators, B Chem. 2012, 169, 106–112.
CrossRef - Fuentes de Arriba, Á. L.; Turiel, M. G.; Simón, L.; Sanz, F.; Boyero, J. F.; Muñiz, F. M.; Morán, J. R.; Alcázar, V. Org. Biomol. Chem. 2011, 9, 8321–8327.
CrossRef - Shang, X.-F.; Lin, H.; Lin, H.-K. J. Fluor. Chem. 2007, 128, 530–534.
CrossRef - Zhang, Y.; Yin, Z.; Li, Z.; He, J.; Cheng, J. P. Tetrahedron 2007, 63, 7560–7564.
CrossRef - Cho, W.-S.; Sessler, J. L. In Functional Synthetic Receptors; Wiley-VCH Verlag GmbH & Co. KGaA, 2005; pp. 165–256.
- Lv, Y.; Guo, Y.; Xu, J.; Shao, S. J. Fluor. Chem. 2011, 132, 973–977.
CrossRef - Gale, P. A. Chem. Commun. (Camb). 2008, 4525–45
CrossRef - Beer, P. D.; Gale, P. A. Angew. Chem. Int. Ed. Engl. 2001, 40, 486–516.
CrossRef - Kubik, S. Chem. Soc. Rev. 2010, 39, 3648–3663.
CrossRef - Kradtap Hartwell, S. Chem. Educ. Res. Pract. 2012, 13, 135.
CrossRef - Gupta, P.; Jain, P.; Kumar Jain, P. J. Chem. Pharm. Res. 2012, 4, 4957–4960.
- Vankar, P. S.; Bajpai, D. Electron. J. Environ. Agric. Food Chem. 2010, 9, 875–884.
- Gupta, P.; Jain, P.; Jain, P. K. Int. J. Pharm. Technol. 2012, 4, 5038–5045.
- Nielson, L. R.; Harley, S. M. J. Biol. Educ. 1996, 30, 88.
CrossRef - Mohd, P.; Khan, A.; Farooqui, M. J. Adv. Sci. Res. 2011, 2, 20–27.
- Castaneda-Ovando, A., Pacheco-Hernandez, M. D., Paez-Hernandez, M. A., Rodriguez, J. A., Galan-Vidal, C. A. Food Chem. 2009, 113, 859–871.
CrossRef - Wrolstad, R. E.; Durst, R. W.; Lee, J. Trends Food Sci. Technol. 2005, 16, 423–428.
CrossRef - Gonnet, J.-F. Colour effects of co-pigmentation of anthocyanins revisited—1. A colorimetric definition using the CIELAB scale. Food Chemistry, 1998, 63, 409–415.
CrossRef - Li, C.; Yang, G.; Huang, S.; Lü, D.; Wang, C.; Chen, J.; Yin, J. J. Hortic. Sci. Biotechnol. 2013, 88, 208–215.
CrossRef - Narciso, K. S. M. pKa Determination of Free and Immobilized Acid-Base Indicators Extracted from Agpanthus praecox, Anthurium andreanum, and Dianthus caryophyllus, University of the Philippines, Manila, 2012.
- Horowitz, R. M.; Jurd, L. J. Org. Chem. 1961, 26, 2446–2449.
CrossRef - Perrin, D. D. Pure Appl. Chem. 1969, 20, 133–236.
CrossRef - Giusti, M. M.; Wrolstad, R. E. Curr. Protoc. Food Anal. Chem. 2001, 1–13.

This work is licensed under a Creative Commons Attribution 4.0 International License.
![]()
A New Edition of Web of Science
Journal Impact Factor
2022: 0.5
Five Year: 0.8
Journal is Indexed in

Cabells Whitelist
![]()


