Visible Spectrophotometric determination of Chlorpheniramine maleate and Diphenhydramine hydrochloride in raw and dosage form using Potassium permanganate
Department of Pharmaceutical Chemistry, College of Pharmacy Jazan University, Alrawda Dist, Jazan, Saudi Arabia-82726.
Corresponding author Email: barrati99@hotmail.com
DOI : http://dx.doi.org/10.13005/ojc/320214
Download this article as:
![]()
Two simple, rapid and sensitive spectrophotometric methods developed for Chlorpheniramine Maleate (CPM) and Diphenhydramine Hydrochloride (DPH) determination in pure and pharmaceutical preparation using Potassium Permanganate. The solvent system used was potassium permanganate. The method developed by adding a known amount of permanganate to CPM and DPH in acid and alkaline medium, the unreacted permanganate was determined at 550 nm; method A and bluish green colour of Manganate at 610 nm; method B. In method A decrease in absorbance or method B increase in absorbance as concentrations of CPM and DPH was measured. Beer’s law was obeyed at a range of 2.5 to 20 μg / ml in both the methods A and B. The method was validated as per International Council for Harmonisation guideline. The proposed methods were effectively used for the determination of CPM and DPH in commercially available syrup. The average percentages of recoveries of CPM were 99.20 ± 1.29% (method A), 100.6% ± 1.43% (method B); DPH 98.50 ± 1.29% (method A) and 100.20 ± 1.43% (method B). The methods were efficiently validated and used for quantitative determination of Chlorpheniramine maleate and Diphenhydramine Hydrochloride in pure and syrup preparations.
KEYWORDS:Chlorpheniramine Maleate; Diphenhydramine Hydrochloride; Potassium Permanganate; UV and method validation
Introduction
Diphenhydramine hydrochloride, DPH, (2-(diphenylmethoxy)-N,N-dimethylethylamine hydrochloride) Figure 1, is one among the best drug in its class in many country’s market and belongs to the first generation antihistaminic agents. DPH is used as anti-allergic and antiemetic drug found in many pharmaceutical formulations [1-2]. Usually it is administered through oral route as tablet or syrup formulations. Chlorpheniramine Maleate (CPM), chemically named as 3-(4-chlorophenyl)-N,N-dimethyl-3-pyridin-2-yl propan-1-amine Figure 2 is also an antihistamine agent, used to treat common cold and other allergic conditions. CPM binds to H1 histamine receptor, which blocks the histamine action, which leads to relief of the negative symptoms. Different methods are available for the determination of DPH and CPM in raw as well as in pharmaceutical preparations including titrimetric analysis [3-5], electrochemical analysis, chromatographic and spectrophotometric methods [6-17].
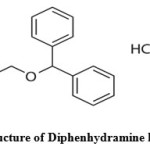 |
Figure 1: Structure of Diphenhydramine hydrochloride Click here to View figure |
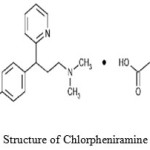 |
Figure 2: Structure of Chlorpheniramine maleate Click here to View figure |
Most of the mentioned methods have many interfering substances, high cost and are time-consuming. Potassium permanganate is widely used for spectrophotometric determination of drugs [18-20]. This approach provides simple and fast methods for the estimation of drugs.
Material and methods
Apparatus
UV-visible spectrophotometer, Shimadzu, mode: UV-1800, fixed bandwidth (2 nm) and 1 cm quartz cell used for absorbance and spectral measurements. Electronic balance, AEA dam, model: PEL-303 and sonicator were used in this study.
Reagents and Standards
Pharmaceutical grade CPM and DPH certified to be 99.85 % and 99.97% pure powder were purchased from Adwia Pharmaceuticals (Cairo, Egypt). Amydramine-II syrup (Julphar Gulf Pharmaceutical Industries, U.A.E.) containing 12.5 mg /5 ml of DPH were procured from Saudi Arabia local pharmacy shop. Piriton syrup containing 2 mg /5 ml of CPM (GlaxoSmithKline Consumer Healthcare, UK) was also purchased from Saudi Arabia local pharmacy. Distilled, de-ionized water was used. All the chemicals used in the project are analytical grade. All the stock solutions were wrapped by aluminum paper to protect from light. All standard solutions were prepared and diluted with distilled water.
Potassium permanganate (0.6 mg/ml)
The 0.002M solution was prepared by 79.00 mg of KMnO4 (EC label, Germany) dissolved in minimum volume of water and diluted to 250.0 ml volumetric flask with distilled water. Then the solution was standardized by H A Bright’s method. The resulting solution was then diluted by water to achieve 0.6 mg/mL working concentration for method A. A separate 0.2 % aqueous solution was prepared for method B.
Sulphuric acid (0.1 and 2 M)
Concentrated Sulphuric acid was diluted appropriately with water prepares the required concentrations.
Sodium hydroxide (1M)
Sodium hydroxide (4.0 g) was dissolved in 100 ml of distilled water.
Standard CPM and DPH solution
50 mg of raw CPM and DPH were weighed separately and dissolved in 100 mL of 0.1 M H2SO4 in volumetric flasks to get standard stock solution (0.5 mg/ mL). The solutions were subsequently diluted to 50 μg / mlof CPM and DPH for method A. 20 mg of CPM and DPH were weighed separately and dissolved in 5 ml of 0.5M acetic acid and the volume was made up to 100 ml using NaOH solution. The solutions thus obtained were diluted to achieve a concentration of 20 μg/ ml with water to be used for method B.
Preparation of standard solutions
Method A
Aliquots of standard CPM and DPH solutions (20 μg / mL) in the range of 1-5 ml were precisely pippetted out and delivered to a series of 25.0 mL volumetric flasks, the volume was adjusted to 5.0 ml with 0.1M H2SO4. 2 ml of 0.1M H2SO4 was also transferred to every flask followed by 1.0 ml of 0.6 mg / mL KMnO4 solution. The content in the flask was stirred properly and left aside for 15 min before diluting with water up to the mark. At 550nm the absorbance was measured for each drug against blank.
Method B
Known volumes of standard CPM and DPH solution (1.0 -5.0 ml) were accurately delivered to series of 25.0 ml volumetric flasks, the volumes were adjusted by water to 5.0 ml. 1 ml of 1 M NaOH and 0.2 % KMnO4 solutions were added to all flasks. Then it was mixed and put aside for 15 min with shaking occasionally. Then, water was added up to the mark and at 610 nm absorbance was measured for each drug against blank. Calibration curve were made by plotting decreasing absorbance in method A and increasing absorbance in method B against the concentrations of CPM and DPH. The respective calibration curves were used to determine the concentration of samples or the regression equation was used to know the unknown concentrations.
Procedure for Syrup
A volume of 31.2 ml containing 12.5 mg of CPM and 5.0 ml containing 12.5 mg of DPH was measured in two 100.0 ml flask and mixed with 60 ml 0.1M H2SO4, shaken for 25 min and then 0.1M H2SO4 was added up to the mark and the solution were filtered by Whatman filter paper No 42. First 10 ml of the filtrates were discarded and the next portions (200 μg/ mL CPM and DPH) were diluted with 0.1M H2SO4 to achieve a concentration of 20 μg/ ml. The determination done by using the method A. For method B, a 15.0 ml solution containing 6 mg CPM and 5.0 ml containing 12.5 mg of DPH were accurately measured into a 100 ml flask. Then the syrup was extracted with three portions of 10.0 ml Chloroform, and filtered through Whatman No. 42 filter paper. The filtrate was collected in 100.0 ml volumetric flask, the mixture was heated on a water bath to evaporate chloroform and the residue thus obtained was dissolved in 5.0 ml 0.5M Acetic acid and 1.0 M NaOH solution was added to the mark. Then solution was appropriately diluted before applying the procedure for drug content assay.
Results
The methods based on redox reaction between permanganate (CPM and DPH) in acidic medium for method A and alkaline medium in method B. In method A a known excess of KMnO4 added to CPM and DPH in acidic H2SO4medium, the determination of the residual oxidant by measuring its absorbance at 550 nm. At 550 nm absorbance decrease in with respect to the blank was taken as the measure of CPM and DPH concentration. In method B resulting from the reduction of KMnO4by CPM and DPH in basic NaOH medium, it was measured at 610 nm and related to CPM and DPH concentration. The possible reaction scheme of both the methods is given in Scheme. 1.
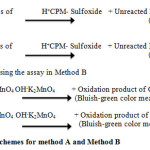 |
Scheme 1: reaction schemes for method A and Method B Click here to View scheme |
Method A (oxidation with KMnO4)
A preliminary experiment was performed for permanganate to determine the concentration, which can give absorbance maxima at 550 nm and in H2SO4mediumand found to be 50 μg / ml (0.0423 absorbance units). It was found that different concentrations of CPM and DPH reacted with 0.6 μg / ml KMnO4 in H2SO4 medium, and after the contact time elapsed, the residual permanganate absorbance was measured and related to CPM and DPH concentration. When KMnO4 (0.6μg / ml) was reacted with varying concentrations of CPM and DPH, the former was consumed in proportion to CPM and DPH concentration and there was a fall in the concentration of KMnO4 by the decreasing absorbance values at 550 nm with increase in the CPM and DPH concentration. This was shown in figure 3 and figure 4. The evaluation of the linear range over which the method is applicable to the determination of CPM and DPH. Since oxidation with permanganate are usually performed in H2SO4 medium. Experiments were performed with H2SO4 concentrations in the range 0.5-2.0 M, absorbance maximum were observed within the range of the study. Hence 2.0 ml of 2M H2SO4 was fixed as optimum. For the recommended method the reaction time selected was fixed by carrying out the experiment using 10 μg / mlCPM and DPH. Maximum absorbance was obtained in 15 min and it remained constant for the next 25 min at room temperature.
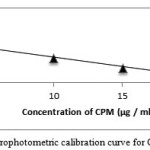 |
Figure 3: Spectrophotometric calibration curve for CPM method A |
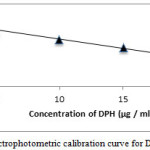 |
Figure 4: Spectrophotometric calibration curve for DPH method A |
Calibration graphs were plotted from five points of the concentration 2.5-20 μg/ ml for both the methods A and B. For method A Beer’s law was obeyed in inverse manner. Furthermore, the linear relationship between absorbance and concentration is supported by high values of correlation coefficient.
Method B (reduction with KMnO4)
CPM and DPH in the presence of NaOH, thereby producing the reduced species, bases this method on the reduction of permanganate to manganite, the bluish-green colored chromophore having the absorption max at 610 nm figure 5 and figure 6. The preparation of the colored product and the sensitivity of the reaction were found to be influenced by the alkaline medium and permanganate concentrations. The optimum absorbance was obtained with 2.0 ml of 1M NaOH, after NaOH volume increased which causes no changed in absorbance, hence 2.0 ml of 1 M NaOH was used throughout the experimental. The reaction was somewhat rapid compared to method A, taking 10 min for completion, and the bluish-green manganate color was stable after 40 min thereafter. When a separate experiment was conducted to study the permanganate concentration, it was found that maximum absorbance with a minimum blank reading was observed when 1.0 ml 0.2% KMnO4 was used up to a total of 10.0 ml volume. The color development effect was examined by adding 0.2 % KMnO4 different volumes (0.1 – 1.0 ml) to drugs. The absorbance of the green color was attained with 0.8 ml of the reagent, and green color stayed constant even when higher volumes were added. Therefore, 1.0 ml 0.2 % KMnO4 was used for entire experimental analysis.
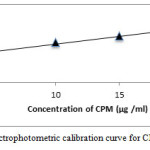 |
Figure 5: Spectrophotometric calibration curve for CPM method B |
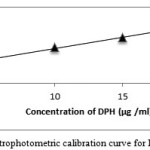 |
Figure 6: Spectrophotometric calibration curve for DPH method B |
The influence of pH
The pH influence in method A was examined based on the absorbance of the reaction. The absorbance maxima were obtained at pH 7.8. The absorbance started gradually decreasing till pH 9.4. Therefore, for method A pH 7.8 was taken as the optimum pH.
Validation of the proposed method
The methods were validated as per ICH guidelines by using different parameters and statistical data. Method A and B were validated concerning with Linearity, limits of detection and quantification.
Linearity: The linearity was evaluated for method A and B by different concentration of standard solution of CPM and DPH. The range 2.5 – 20 μg /ml-1obeyed the Beer Lambert’s law for both methods with correlation coefficient of method A 0.9941 and 0.9801, whereas 0.9803 and 0.9890 for method B.
Limit of Detection and Limit of Quantitation
The LOD and LOQ were obtained from linearity data studies on five replicates and were determined based on slope of the regression equation shown in table 1.
Table 1: analytical and optical parameters of proposed methods for CPM and DPH
|
Parameter
|
Method A (CPM) |
Method B (CPM) |
Method A (DPH) |
Method B (DPH) |
| Beer’s ranges (μg /ml) |
2.5-20 |
2.5-20 |
2.5-20 |
2.5-20 |
| Estimated on wavelength (nm) |
550 |
610 |
550 |
610 |
| LOD (μg/ ml) |
0.47 |
0.83 |
0.32 |
.77 |
| LOQ (μg/ ml) |
1.14 |
0.64 |
1.43 |
.86 |
| Intercept |
2.0761 |
1.3620 |
0.4587 |
0.7562 |
| Slope |
-0.0875 |
-0.0128 |
0.0898 |
0.1375 |
| Correlation coefficient (r) |
0.9941 |
0.9803 |
0.9801 |
0.9890 |
| Standard Deviation of intercept |
0.0917 |
0.0921 |
0.9957 |
0.0987 |
| Standard Deviation of slope |
0.0112 |
0.0054 |
0.071 |
0.0065 |
| Color stability, min. |
25 |
45 |
25 |
45 |
Precision and Accuracy
The assay procedure was performed six times at the same day to see the repeatability (intra-day precision) whereas to check the intermediate precision the same procedure was repeated for six times at different days (inter-day precision). The % RSD obtained were less than 2% for intra-day and less than 3% in case of inter-day showing the precision of the proposed methods. The precision represented in % RSD table 2.
Table 2: precision and accuracy SAE Standard analytical error
|
Quantity taken (μg/ ml) CPM and DPH |
Quantity found (μg/ ml) CPM |
% Recovery ± S.D CPM |
% RE |
± RSDa (%) CPM
|
SAEb CPM |
Quantity found (μg/ ml-1) DPH |
% Recovery ± S.D DPH |
% RE |
± RSDa (%) DPH
|
SAEb DPH |
|
Method A Intra-day precision Inter-day precision |
||||||||||
|
5 |
4.96 |
99.20 |
0.8 |
0.80 |
0.04 |
5.02 |
100.4 |
0.40 |
1.22 |
0.05 |
|
10 |
9.85 |
99 |
1.0 |
1.25 |
0.05 |
9.97 |
99.76 |
0.30 |
0.87 |
0.02 |
|
15 |
15.15 |
100.1 |
0.1 |
0.40 |
0.02 |
14.77 |
99.46 |
0.53 |
0.59 |
0.03 |
|
Method B Inter-day precision Intra-day precision |
||||||||||
|
5 |
5.21 |
100.2 |
0.2 |
0.54 |
0.02 |
5.02 |
100.4 |
0.40 |
0.62 |
0.06 |
|
10 |
10.04 |
100.4 |
0.4 |
0.89 |
0.05 |
10.07 |
100.7 |
0.70 |
1.20 |
0.05 |
|
15 |
14.78 |
98.50 |
1.5 |
1.76 |
0.06 |
15.10 |
101.6 |
1.60 |
1.96 |
0.09 |
Application
The proposed methods were used for quantitative analysis of CPM and DPH in marketed syrup preparations. Results were compared with published non-aqueous titrimetric methods[19, 20]. The results obtained have not showed any remarkable difference from that of the standard titrimetric method[19, 20]. The assay results are shown in table 3.
Table 3: analytical results of syrup samples by proposed methods and their statistical comparison with that of reference method
|
Syrup name |
Labeled amount
|
Method A
|
Method B
|
Reference method |
Method A |
Method B |
|
Piriton syrup (CMP) |
2.5 mg/5ml |
2.60±0.06 |
2.57±0.03 |
102.6±0.52 |
104±1.36 t = 0.79 F = 4.77 |
102±0.97 t = 1.09 F= 3.17 |
|
Amydramine II syrup(DPH) |
12.5mg/5ml |
12.4±0.33 |
12.7±0.49 |
98.58±0.76 |
99.2±1.34 t = 1.65 F = 3.26 |
101±0.76 t = 0.99 F = 2.07 |
Recovery Study
The recovery study was performed between the measured concentrations of standard and the test drugs known concentration. The study was done using pre-analyzed syrup sample with raw CPM and DPH spiked at various concentration range (50, 100, 150 and 200%) of the content present in the syrup. Every test was repeated for four times. In all the methods A and B for CPM the percentage recovery ranged between (99.30 – 101.4%), with relative standard deviation range 1.01- 1.36. In all the methods A and B for DPH the recovery percentage values ranged between (99.78 – 101.6%) with relative standard deviation range 1.20 – 1.75% shown in table 4.
Table 4: Recovery study data: standards addition method
|
Syrup Sample
|
CPM & DPH in syrup (μg / ml) |
Pure CPM & DPH (μg / ml) |
Total found (μg / ml) |
CPM & DPH recovered (%) |
CPM&DPH in syrup (μg / ml) |
Pure CPM & DPH (μg / ml) |
Total found (μg/ml) |
CPM & DPH recovered (%) |
|
|
Method A |
Method B
|
||||||||
|
Piriton syrup (CMP) |
20 20 20 |
10 20 30 |
29.58 40.24 49.98 |
99.30±1.36 100.6±1.27 99.96±1.20 |
20 20 20 |
10 20 30 |
30.29 40.22 50.72 |
100.96±1.22 100.55±1.01 101.44±1.21 |
|
|
Amydramine-II syrup (DPH) |
20 20 20 |
10 20 30 |
30.54 40.61 50.20 |
101.8±1.35 101.5±1.24 100.4±1.02 |
20 20 20 |
10 20 30 |
29.98 40.43 49.89 |
99.93±1.10101.07±1.32 99.78±1.27 |
|
Discussion
The methods studied in the current work provided an excellent way for the determination of drug in both the raw form as well as in the pharmaceutical formulations. The maximum absorbance of CPM and DPH for method A and B at 550 nm and 610 nm were selected. The linearity obtained between 2.5 – 20 μg/ ml for CPM and DPH. For CPM in syrup the label claim found to be 99.20% and 100.6%. For DPH in syrup the claim found to be 98.50% and 100.20%. The proposed methods accuracy ascertained by percentage (%) recovery studies in the range of 99.30 – 100.9 %. The standard deviation and coefficient of variation was found to be significantly low, showing the accuracy of the methods. In method A and B the % RSD for Intra-day assay precision for CPM and DPH was found to be (0.40 -1.76%).In method A andB for Inter-day assay precision for CPM and DPH was found to be (0.59 – 1.96%).
The proposed methods are found to be reproducible, precise and accurate and can be applied for quality control analysis of CPM and DPH in raw samples as well as in pharmaceutical preparations. In the current study an UV spectrophotometric method developed and validated for the analysis of CPM and DPH in raw and dosage forms. Thus these validated methods are suitable for the routine analysis of drug. The main benefit of this method is cost effective and some laboratories in poor countries cannot afford to run HPLC and other advanced techniques. The method for the estimation of raw drug and syrup dosage form has been developed. Therefore, the proposed method concludes that much time and money can be saved.
Acknowledgement
I like to thank and acknowledge Jazan University for financial support and required facilities to carry out this research work through a scientific research grant.
References
- Reynolds JEF. “Martindale the Extra pharmacopoeia”, 30th ed. Pharmaceutical press: London; 1993. 937.
- Erk, N. J. Pharm. Biomed. Anal, 2000, 23, 1023-1031.
CrossRef - Hellbom, E. Medical Hypotheses. 2006, 66(4), 689-690.
CrossRef - Tuckermann, M.M.; Aeel, K.; Bican-Fister, T.; Billow, J.; Gibbs, I.S. J Pharm Sci. 1972, 61,448-459.
CrossRef - Shoukry, A.F.; Badawy, S.S.; Issa, Y.M. J Electroanal Chem Interfac Electrochem. 1987, 223, 29-36.
CrossRef - Erden, A.; Ozsoz, M.; Kirilmaz, L.; Kilinc, E.; Dalbasti, T. Electroanalysis. 1997, 9, 932-935.
CrossRef - Tipparat Lapanantnoppkhum, S.; Jakmunee, J.; Grudpan, K. J Pharm Biomed Anal. 2002, 30,105-112.
CrossRef - El-Didamony, A.M.; Moustafa, M.A. Arabian J Chem. 2010, 3, 265-270.
CrossRef - Davidson, A.G.; Hassan, S.M. J Pharm Sci. 1984, 73, 413-416.
CrossRef - Raj, S.V.; Kapadia, S.U.; Argekar, A.P. Talanta. 1998, 46, 221-225.
CrossRef - DiDregorio, D.; Sherma, J. J Liq Chromatogr Relat Technol. 1999, 22, 1599-1606.
CrossRef - Gupta, V.K.; Pal, M.K.; Singh, A.K. Electrochim Acta. 2010, 55, 1061-1066.
CrossRef - Al Bratty, M.; Hashem, H.; Noureldeen, A.; Manoharan, G.; Towhari, F. Int. J. Pharm. Pharm. Sci. 2015, 7(3), 72-76.
- Shamsa, F.; Barazandeh Tehrani, M.; Mehravar, H.; Mohammadi, E. Iran J Pharm Res. 2013,2, 9-13.
- Shishebore, M.R.; Aghamiri, Z. Iran J Pharm Res. 2014, 13, 373-382.
- Amanlou, M.; Ghazi Moghadam, A.; Barazandeh Tehrani, M.; Souri, E. Iran J Pharm Res. 2014, 13,81-86.
- Venkata Ratnam, K.; Syama Sundar, B.; Radhakrishna Murti, P.S. Oriental Journal of Chemistry. 2014, 30 (2) 681-686.
- Vindya Rao, G.; Shaiba, M.; Bhargavi, P.; Dinesh Kumar, T.; Swethapriya, CH.B. Oriental Journal of Chemistry. 2010, 26(3) 1215-1217.
- Haidar, O. I. Journal of Natural Sciences Research. 2015,5 (16) 142-146.
- Abdel-Gawad, F. M.; Helmy, A.G.; Abbas, N.A.; Mohamed, E.F. World Journal of Pharmacy and Pharmaceutical Sciences. 2015, 4 (11) 283-296.


![]()


