Synthesis, characterization and antibacterial activity of new complexes of some lanthanide ions with 15-crown-5 and 18-crown-6
DOI : http://dx.doi.org/10.13005/ojc/320228
Download this article as:
![]()
Complexes of some lanthanide picrates (Ln3+ = Pr3+, Nd3+ and Dy3+) with 15-crown-5 and 18-crown-6 were synthesized and characterized by elemental analysis, ICP-AES, FTIR, 1H-NMR, 13C-NMR and UV-Visible spectrophotometric methods, thermal analysis (TGA & DTG), magnetic susceptibility , molar conductance and melting points. Also an in-vitro study on pathogenic gram positive (Staphylococcus aureus) and pathogenic gram negative bacteria (Escherichia coli, Salmonella and pseudomonas aeruginosa) was performed and the results were compared to those of a broad spectrum antibiotic (Chloramphinicol). The complexes of 15-crown-5 have the general formula [Ln(15C5)2(Pic)]Pic2.nH2O where (Ln3+ = Nd3+ and Dy3+), (Pic = Picrate anion) and (n = 2 or 4) except for Pr3+ complex which has the formula [Pr(15C5)]Pic3.H2O , the 18-crown-6 complexes have the general formula [Ln(18C6)]Pic3 where (Ln3+ = Pr3+ and Nd3+) except for Dy3+ complex which has the formula [Dy(18C6)(Pic)]Pic2.3H2O. In 15-crown-5 complexes both Nd3+ and Dy3+ were coordinated with two 15-crown-5 ligands and one picrate anion through its phenolic oxygen and the oxygen of it’s ortho nitro group, except for Pr3+ which was coordinated with only one 15-crown-5 ligand leaving three picrate anions as counter ions. In 18-crown-6 complexes both Pr3+ and Nd3+ were coordinated with one 18-crown-6 ligand leaving all the three picrate anions as counter ions outside the coordination sphere, except for the Dy3+ complex which was coordinated with one 18-crown-6 ligand and one picrate anion.
KEYWORDS:crown ethers; lanthanides; picrates; supramolecular chemistry
Introduction
Crown ethers are heteromacrocycles in which the framework is typically comprised of repeating ethyleneoxy [-(CH2CH2O)n-] units. Nitrogen and sulfur commonly replace oxygen in this framework leading to a great variety of compounds that have been used in molecular recognition studies and supramolecular chemistry[1,2]. Since their discovery by Pedersen, many variants of those structures have been reported, such as out–in bicyclic amines and cryptands by Simmons and Park and Lehn and co-workers, lariat ethers, aza-crown ethers, calixarenes, calixcrowns and calixtubes[3]. All these compounds are interesting because of their remarkable selectivity on metal cations, specially from alkali and alkaline earth metals, which is a topic of fundamental interest in both coordination chemistry and biological chemistry[1]. These characteristics are relevant on the selective transport of amino acids or metal ions across membranes and can serve as models in important biological processes as the enzymeionic substrate interactions. Their use as a neutral carrier in liquid membranes of ion selective electrodes is another important analytical application. The selective interaction process between macrocyclic polyethers and metal ions requires among other conditions, structural characteristics and dimensions of the cavity formed by the polyether ring so that it can be capable to fit suitably to a specific cation. The efficiency of interaction may also be affected by the nature of the metal ion and by the number, distance and orientation of the donor atoms of the ligand that are structurally accessible to the complexed cation. The ability of the solvent molecules to compete with the donor atoms of the ligand towards the coordination sites of the cation, is another factor that can thermodynamically influence the complexation process[4,5]. Crown ethers are readily used in phase transfer catalysis[6], toxic metal sequestration, battery electrolytes, and to guid supramolecular self assembly in the burgeoning field of molecular electronics[7]. They are also used in electronic and optical devices[8], in molecular recognition and transport of organic ammonium derivatives such as amines, amino acids, and related compounds (obviously in protonated state)[9,10], as antifungal agents[11], removal of the highly toxic and harmful heavy metal ions[12], as sensors[13,14], corrosion inhibitors[15] and they are also used widely in extraction processes[16-18] due to their binding selectivity. The coordination chemistry of the lanthanides with crown ethers has been extensively studied[19-22], due to their importance in biological, biochemical, medical and many other applications such as an excellent diagnostic and prognostic probe in clinical diagnostics[8], an anticancer material[4,9], lanthanide complexes based X-ray contrast imaging and lanthanide chelates based contrast enhancing agents for Magnetic Resonance Imaging (MRI)[11] are being excessively used in radiological analysis in our body systems[9], also as shift reagents for NMR spectrometry[10-12], as well as, their potential applications in fundamental and applied science such as organic synthesis, bioorganic chemistry and homogeneous catalysis[11-13]. The chemistry of lanthanides differs significantly from the chemistry of main group and transition metal elements because of the 4 f orbitals that are spatially ‘buried’ inside the atom and are shielded from the ligand field. Consequently, the chemistry of the lanthanide ions is largely determined by their sizes. Ln(III) ions are typically hard Lewis acids because of the high charge density and they prefer to bind to hard base atoms, viz. oxygen. Since the 4 f electrons are spatially buried, the mixing of ligand and metal orbitals becomes insignificant and bonding between the ligands and the Ln(III) ions is largely electrostatic in nature. Observation of high coordination number (> 6 and up to 12) is due to lack of any directional bonding character and large ionic size resulting poor stereochemical preferences and consequently the coordinating ligands in the complex occupy positions that minimize the steric repulsions between them. Therefore, the coordination environment around the Ln(III) centre often cannot be regarded as an idealized coordination polyhedron[23]. Complexation reactions of crown ethers with 4f element salts under anhydrous conditions promote interaction of the metal ion with the crown ether in solution; however these complexes are often very difficult to crystallize[3,7], but we have successfully prepared and characterized the crystallized complexes. In this research our major goal was to focus on the biological activities of these complexes due to the fact that there are quite few studies regarding this field and also for the wide range of applications that we may be able to discover from studying these complexes. The bioinorganic chemistry as well as the coordination chemistry of lanthanides with crown compounds attracted our interest. We started with an in-vitro study of the antibacterial activity of the prepared complexes against gram positive (Staphylococcus aureus) and gram negative bacteria (Escherichia coli, Salmonella and pseudomonas aeruginosa). They showed good, promising results when compared to the well known broad spectrum antibiotic Chloramphenicol, in fact chloramphenicol had no activity at all against the gram negative pseudomonas aeruginosa while all the tested complexes showed good inhibitions. However further in-vivo study is required. The biological activity of these complexes against these bacteria is believed to arise from the crown ligand (the chelate) effect on the metal ion. The most important property of the chelating agents, in lanthanide chelate complex, is its ability to alter the behavior of lanthanide ion with which it binds in biological systems, and the chelation markedly modifies the biodistribution and excretion profile of the lanthanide ions. The chelating agents increase the proportion of their complex excreted from complexed lanthanide ion from biological systems[4]. The promising results we got from this study encouraged us to perform in-vivo as well as the cytotoxicity studies for these complexes, which is left for further future work. We also believe that these complexes may show an anticancer activity which is also left for further work. Some simple, primary fluorescence tests were also performed on these complexes and they showed very promising results which lead us to the conclusion that these complexes may give potential applications in the field of modern diagnoses especially in the early detection of cancer and they may also serve as novel contrast or contrast enhancing agents. The fluorescence test was not mentioned in this research since it needs a special separate study of its own which is left for further future work. This work represents the basic study to start from in order to reach further more advanced results.
Experimental
Materials and Methods
All the Starting materials were commercially available. The ligands (15-crown-5 and 18-crown-6) were obtained from Sigma Aldrich company, lanthanide oxides, picric acid and the solvents were obtained from Merck company and were used without further purification. The lanthanide content was determined using a Shimadzu, model ICPS – 700, inductively coupled plasma – atomic emission spectrometer (ICP-AES). The carbon, hydrogen and nitrogen content was determined using the Carlo Erba EA 1108 elemental analyzer. The IR spectra were recorded using KBr pellets and a 8400 S – FTIR SHIMADZU spectrometer. The 1H-NMR and 13C-NMR spectra of some of the ligands and their complexes were recorded in DMSO using a fourier transform Ultra Shield 300 MHz spectrometer, Bruker company, origin: Switzerland, with tetramethyl silane as internal standard. The UV – Visible Spectra were recorded using a 1800 – UV SHIMADZU spectrometer. Conductivity measurements were carried out using a HI 9811 – 5 Portable HANNA pH/EC/TDS/oC meters. Thermal analysis of the prepared complexes was performed using SHIMADZU 60-H Thermo Gravimetric Analyzer. The melting points were measured using a GALLENKAMP melting point apparatus. The magnetic properties were measured using a Johnson Matthey MSB MarkI magnetic susceptibility balance. The structures of the complexes were drawn using (ChemBioDraw Ultra 11.0) software.
Preparation of lanthanide picrates
General procedure
Picric acid (0.05 M, 1.37 gm) was dissolved slowly in a (100 ml) of distilled water. The solution was stirred with gentle heating. (1 mmol, 0.336 gm) of Nd2O3 was dissolved in a (40 ml) of the above prepared picric acid solution. The solution was refluxed at (85 oC) until all the oxide was dissolved. After (2 hrs) a clear yellow solution was obtained, filtered and treated with benzene in a separating funnel in order to extract all the excess of picric acid. The final step of crystal formation can be done by reducing the volume of the solution at (40 – 50 oC). After cooling the solution in an ice bath for (1 hr.) solid crystals were obtained and they were dried in a desicator. We can also obtain solid crystals by reducing the solution volume to half its original volume at (40 – 50 oC) and leaving it to be air dried. The lanthanide picrate crystals may form after (24 – 72 hrs). The crystals were collected and stored in a desicator. Praseodymium and Dysprosium picrates were prepared using the same procedure, the reflux time was ranged from (7 – 8) days for the metal oxides to be dissolved. Total yields of the products obtained by this procedure are (88 – 90 %)[24].
Extensive care must be taken during the preparation of the metal picrates since they are highly explosive (very sensitive to heat, shock and friction) plus the metal picrates are even more explosive than picric acid itself. The general equation for the preparation of lanthanide picrates is shown below:
Preparation of 15-crown-5 complexes
A solution of (2 mmol, 0.4 ml) of 15-crown-5 in (10 ml) of absolute ethanol was added to a solution of (1 mmol, 0.933 gm Pr-picrate), (0.936 gm Nd-picrate) and (0.900 gm Dy-picrate) in (10 ml) of absolute ethanol and refluxed at (50 – 60 oC) for (1 hr.). The solution was concentrated at (40 – 50 oC) to a very small volume (till the formation of a precipitate), usually a gummy precipitate forms which was treated with (40 – 60 oC) petroleum ether until all the gummy precipitate was converted to a fine yellow – orange powder. The precipitate was collected and stored in a desicator for complete dryness. These complexes were also prepared by another method, by stirring a solution of 15-crown-5 with a solution of lanthanide picrate for (24 – 48 hrs.). The gummy precipitates were treated with petroleum ether. The yields were (92 – 96%)[24].
Preparation of 18-crown-6 complexes
A solution of (1 mmol, 0.264 gm) of 18-crown-6 in (10 ml) of absolute ethanol was added to a solution of (1 mmol, 0.933 gm Pr-picrate), (0.936 gm Nd-picrate) and (0.900 gm Dy-picrate) in (10 ml) of absolute ethanol at room temperature. Immediate precipitation occurred along the addition and the precipitate was filtered, washed with absolute ethanol and stored in a desicator for (24 hrs.). The yields of these complexes were (95– 98%)[24].
Antibacterial Assay
Four pathogenic bacterial isolates were used in this work (Escherichia coli, Staphylococcus aureus, Pseudomonas aeruginosa and Salmonella spp). The isolates were planted on the surface of an agar slant, incubated at (37 oC) for (24 hrs) and stored at (4 oC) for the later use.
Preparation of Bacterial Suspensions
The bacterial suspensions were prepared by transferring a colony from each bacterial isolate using a metal loop into test tubes containing liquid nutrient broth and were incubated at (37 oC) for (18 hrs). After incubation a measured amount of the suspensions was transferred to a flask containing a sterile normal saline solution and mixed well. The bacterial suspensions were compared with a (Mcfarland standard solution) by counting the bacteria present in (1 ml) of the suspension.
The Antibacterial Test of the Prepared Complexes
An amount of (18 – 20 ml) of freshly prepared solid nutrient agar was transferred to sterilized plastic petri dishes in sterilized environment (inside the biological hood) and left to cool and solidify. (0.1 ml) from each bacterial suspension was transferred to the dishes containing the solidified nutrient agar and was uniformly inoculated using a cotton swab. The swab was streaked in at least three directions over the surface of the agar to obtain uniform growth, and final sweep was made around the rim of the agar. The plates were allowed to stand for (5 minutes) to dry, after that four wells with a diameter of (0.6 mm) were made in each dish using a sterile borer and one well in the centre for the positive control (the antibiotic). Solution of (0.1 ml) of (1×10⁻⁴ M) of the prepared complexes were added to the wells followed by incubating the dishes at (37 oC) for (24 hrs). The activity of each complex was identified by measuring the inhibition zone around each well. A second method was used in testing the activity of the prepared complexes, the method is known as the Spots method. This method involved adding (0.1 ml) of the prepared complex directly on the surface of the agar instead of adding it into a well followed by incubating the dishes also at (37 oC) for (24 hrs). The activity of the complexes were identified by measuring the inhibition zone around the spot. Better results were obtained by the spots method and its results were adopted in this work instead of the results obtained by the wells method.
3](https://www.orientjchem.org/wp-content/uploads/2016/05/Vol32_No2_Syn_HUSS_Fig1-150x150.jpg) |
Figure 1a: TGA thermogram of [Pr(18C6)](Pic)3 Click here to View figure |
3](https://www.orientjchem.org/wp-content/uploads/2016/05/Vol32_No2_Syn_HUSS_Fig1a1-150x150.jpg) |
Figure (1b): TGA thermogram of [Pr(18C6)](Pic)3 Click here to View figure |
Results and Discussion
The carbon, hydrogen, nitrogen and metal content data alongside the melting points, colors, conductivity values, and magnetic moments of the prepared complexes are shown in table (1).
Table 1: Elemental analysis and physical properties of metal salts and their prepared complexes
|
Formula M.wt.(gm/mole) |
C% Found (Cal.) |
H% Found (Cal.) |
N% Found (Cal.) |
M% Found (Cal.) |
Color |
M.P. (0C) |
Magnetic moment (BM) |
Molar Conductivity (Ω1cm2.mol-1) (10-3 M) |
|
Pr(Pic)3.6H2O 933.2866 |
23.055 (23.165) |
1.823 (1.944) |
13.452 (13.507) |
14.897 (15.098) |
Yellow |
98 – 100 |
4.4 |
….. |
|
Nd(Pic)3.6H2O 936.6189 |
22.938 (23.082) |
1.902 (1.937) |
13.323 (13.459) |
15.304 (15.400) |
Deep yellow |
59 – 62 |
5.9 |
….. |
|
Dy(Pic)3.3H2O 900.8333 |
23.713 (23.999) |
1.137 (1.343) |
13.802 (13.994) |
17.754 (18.039) |
Bright yellow |
65 – 68 |
11.1 |
….. |
|
[Pr(15C5)](Pic)3.H2O 1063.4726 |
31.499 (31.623) |
2.587 (2.654) |
12.384 (11.854) |
12.912 (13.249) |
Yellow |
84 – 86 |
5.634 |
110
|
|
[Nd(15C5)2(Pic)](Pic)2.5H2O 1359.1277 |
33.426 (33.582) |
4.062 (4.153) |
9.178 (9.280) |
10.451 (10.612) |
dark orange |
88 – 90 |
6.536 |
60 |
|
[Dy(15C5)2(Pic)](Pic)2.2H2O 1323.3421 |
34.211 (34.489) |
2.964 (3.808) |
9.544 (9.526) |
12.087 (12.279) |
Yellow |
93 – 95 |
12.616 |
80 |
|
[Pr(18C6)](Pic)3 1089.5098 |
32.648 (33.072) |
2.943 (2.775) |
10.862 (11.570) |
12.824 (12.933) |
Bright yellow |
295 – 300 Decom. |
6.79 |
90 |
|
[Nd(18C6)](Pic)3 1092.8421 |
32.291 (32.971) |
2.402 (2.767) |
11.558 (11.535) |
12.885 (13.198) |
Bright yellow |
288 – 292 Decom. |
7.4 |
90 |
|
[Dy(18C6)(Pic)](Pic)2.3H2O 1165.1477 |
31.630 (30.925) |
2.499 (3.114) |
11.148 (10.819) |
13.697 (13.946) |
Deep yellow |
276 – 280 Decom. |
13.8 |
80 |
Molar Conductance
The molar conductance of (10-3) M of all the prepared complexes were measured in DMSO at (25 oC). The values obtained lie in the range of (50 – 110 S.cm2.mol-1), this indicates that all of the prepared complexes are electrolytes. The highest conductance value was observed in the Pr3+complex of 15-crown-5 (110 S.cm2.mol-1), this means that all the picrate anions are uncoordinated to the metal ion and lie outside the coordination sphere (as counter ions)[25]. The molar conductance values of all the prepared complexes are shown in table (1).
2.5H2O](https://www.orientjchem.org/wp-content/uploads/2016/05/Vol32_No2_Syn_HUSS_Fig2-150x150.jpg) |
Figure 2: TGA and DTG thermograms of [Nd(15C5)2(Pic)](Pic)2.5H2O Click here to View figure |
Magnetic Susceptibility
Magnetic measurements are widely used in studying metal complexes. The magnetic properties are due to the presence of unpaired electrons in the partially filled f – orbitals in the outer shell of these elements (the lanthanides). The theoretical values of the magnetic moment are calculated by the following equation:
Where:
μ= magnetic moment
s= Spin quantum number
L= Orbital quantum number
According to the magnetic moment values, all the prepared complexes are paramagnetic and their values do not deviate from the theoretically calculated ones, they also agree with those reported for typical lanthanide complexes. This indicates the non involvement of 4f electrons in bonding due to their very effective shielding by the electrons in 5s2 and 5p2 orbitals[26]. The values of the magnetic moment are shown in table (1).
Thermal Analysis
The complex [Pr(18C6)](Pic)3 is the only one which was tested in the temperature range (30 – 900 oC) and it’s thermogram is shown in figures (1a and 1b). An instrumental damage was recognized during the raising of the temperature more than (260 – 335 oC) due to the multiple explosions that occur at this range of temperature, therefore all the other samples were tested to a heating temperature not more than (300 oC). The thermogravimetrical analysis (TGA) and differential thermal analysis (DTG) have been performed in order to study and estimate the thermal stabilities of the prepared complexes as well as to confirm their elemental analysis. The data of thermal study of the prepared complexes are listed in table (2). All the prepared complexes showed a similar thermal behavior as they showed that the thermal decomposition of the complexes passes through three stages; the first stage of mass loss was attributed to the loss of water of hydration which took place at a temperature range of (62 – 205) oC. It is hard at this point to differentiate between the coordinated water and the uncoordinated (lattice water) from the thermograms[27,28]. All the experimental mass losses were in good agreement with the calculated ones as it is shown in table (2). The second stage is the dissociation and decomposition of the anhydrous complex, which results in unidentifiable intermediates due to the explosions that took place at a temperature range of (260 – 335 oC). This was a common behavior of all the complexes, which is believed to be caused by the decomposition of the picrates as they are known for their explosive nature[27,28]. The third stage was observed only in the thermogram of Pr[(18-crown-6)](Pic)3 , in which this complex was heated to (900 oC) after the explosions, the last mass loss recorded was between the range of (335 – 550 oC) after that, a region of thermal stability was observed up to more than (800 oC) and was identified as the oxide of the corresponding metal ion which is known to be very stable even at very high temperatures[26 – 29]. The metal oxide was identified through the calculations of the mass loss, also the temperature range of its formation (335 – 550 oC) and the range of thermal stability observed after the last mass loss. Thermograms of Pr3+ complex with 18-crown-6 and Nd3+ complex with 15-crown-5 are shown in figures (1a,b and 2) respectively. All the other complexes showed a similar thermal behavior.
Table 2: Thermal data of the prepared complexes
|
Compound |
Step |
Temp. range of the decomposition (0C) |
Suggested formula of the resultant compound |
∆m(%) mass-loss |
Temp. range of thermal stability of the complex (0C) |
|
|
Cal. |
Obs. |
|||||
|
[Pr(15C5)](Pic)3.H2O
|
1 |
50 – 76 |
[Pr(15C5)](Pic)3 |
1.6 |
1.27 |
76 – 185 |
|
2 |
185 – 320 |
* |
… |
… |
||
|
[Nd(15C5)2(Pic)](Pic)2.5H2O
|
1 |
62 – 152 |
[Nd(15C5)2(Pic)](Pic)2 |
6.62 |
6.83 |
152 – 187 |
|
2 |
187 – 254 |
* |
… |
… |
||
|
[Dy(15C5)2(Pic)](Pic)2.2H2O
|
1 |
47 – 78 |
[Dy(15C5)2(Pic)](Pic)2 |
2.72 |
2.31 |
78 – 130 |
|
2 |
130 – 227 |
* |
… |
… |
||
|
[Pr(18C6)](Pic)3
|
1 |
260 – 310 |
* |
… |
… |
40 – 260 |
|
2 |
335 – 556 |
Pr2O3 |
87.0 |
87.8 |
||
|
[Nd(18C6)](Pic)3
|
1 |
273 – 315 |
* |
… |
… |
45 – 273 |
|
2 |
… |
… |
… |
… |
||
|
[Dy(18C6)(Pic)](Pic)2.3H2O
|
1 |
76 – 196 |
[Dy(18C6)(Pic)](Pic)2 |
4.63 |
5.03 |
196 – 260 |
|
2 |
260 – 320 |
* |
… |
… |
||
FTIR Spectra
FTIR spectra of the lanthanide picrates
The data of the absorption frequencies of picric acid and lanthanide picrates are listed in table (3). The most important band shift is the one that belongs to the ν (O-H) stretching vibration which is shifted in the spectra of the salts by (367 – 397 cm-1) towards higher wave numbers when compared to the spectra of picric acid, this may be due to the breaking of the intramolecular hydrogen bonding between the phenolic hydrogen and the oxygen from the adjacent nitro group, and the formation of an ion pair between the Ln3+ ion and (Pic–)[30,31]. Some noticeable shifts in the bands of the symmetric and asymmetric stretching vibrations of the nitro groups are observed in the spectra of the lanthanide salts when compared to the spectra of picric acid as it is shown in table (3), this also may indicate the breaking of the intramolecular hydrogen bonding between the oxygen of the nitro group and the phenolic hydrogen [30 – 32].The FTIR spectra of picric acid and it’s Dy3+ picrate are shown in figures (3 and 4) respectively.
Table 3: IR data of picric acid and the prepared lanthanide picrates
|
Compound |
υ (O-H) cm-1 |
υ (N-O) cm-1 |
δ (C-H) cm-1 (o.o.p) |
υ (C-O) cm-1 |
|
Picric acid |
3105 |
1527 1342 |
941 919 |
1088 |
|
Pr(Pic)3.6H2O |
3502 |
1541 1360 |
921 908 |
1085 |
|
Nd(Pic)3.6H2O |
3472 |
1541 1362 |
943 926 |
1083 |
|
Dy(Pic)3.3H2O |
3495 |
1525 1340 |
919 |
1087 |
FTIR spectra of the complexes
The band of the (C-O-C) stretching vibration (which is the most important band) of the free 15-crown-5 is shifted by (28) cm-1 towards lower wave numbers in both Pr3+ and Dy3+complexes and by (26) cm-1 in Nd3+complex, these moderate shifts alongside the difference in the size of the metal ion and the cavity of the ligand (the metal ion being larger than the ligand cavity) may indicate that the metal ion does not lie inside the cavity of the ligand, instead it resides out of the ligand above the cavity of the ring, this means that the bonds between the oxygen atoms in the ligand and the metal ion are long, therefore the interaction is considered (weak – moderate) which is reflected in the simple weak – moderate shifts[33, 34]. The band of the (C-O-C) stretching vibration in the free 18-crown-6 is shifted by (75), (73) and (72 – 83 split) cm-1 in Pr3+, Nd3+ and Dy3+complexes respectively. This large obvious shift may indicate that there is a strong or very strong interaction between the crown ligand and the metal ions. This shift alongside with size matching between the diameter or size of the cavity of crown compound and the radius of the metal ions may lead to the conclusion that the metal ions lie inside the cavity of the crown ligand[30, 33, 34]. The bands of the (-CH2-) bending vibrations (scissoring, wagging and rocking) of (15-crown-5) ligand experienced shifts between (16) cm-1 and (30) cm-1 in the spectra of the complexes, theses bands experienced shifts in the range (9 – 40) cm-1 in the spectra of (18-crown-6), these shifts were all accompanied with changes in shapes and intensities of the peaks, these spectral changes could be related to the effect of the nearby bonded oxygen atoms[30, 35]. The bands of the (N-O) stretching vibrations (both sym. & assy.) did not experience any significant shift in the case of (Pr3+-15-crown-5), this gives an indication that may be the picrate anions are not coordinated to the metal ion and it is in a good agreement with the conductance results of the corresponding complex. While in both Nd3+ and Dy3+-15-crown-5 the bands experienced a shift of (5 – 19) cm-1with changes in the shapes and intensity of the peaks, this may lead to the conclusion that maybe one of the picrate anions is coordinated to the metal ion. The conductance results also reinforced this conclusion[27,28]. Concerning (18-crown-6) complexes, there was no significant shifts in both symmetric and asymmetric (N-O) stretching vibrations in (Pr3+-18-crown-6). In (Nd3+-18-crown-6) the band of the (N-O) asymmetric vibration appeared as a shoulder and there was no significant shift in the symmetric band, this may indicate that there are no picrate anions coordinated to the metal ions and the conductance values for these complexes showed similar results reinforcing their IR spectra. The (N-O) symmetric vibration of Dy(Pic)3.3H2O was shifted by (18) cm-1 towards higher wave numbers upon complexation, this may indicates that the picrate anion is coordinated to Dy3+ ion[27, 28]. Some new sharp bands appeared at (3090 – 3092) cm-1 in the spectra of the complexes which were absent in the spectra of the ligands, these bands were assigned to the stretching vibration of the aromatic (C-H) group of benzene ring in the picrate anion[30, 31].The appearance itself of these bands in the spectra of the complexes may indicate that the picrate anions are somehow incorporated in the whole skeleton of the complex giving an indication for the complex formation. Other new bands appeared in the spectra of the complexes at around (1612 – 1614) cm-1. These bands were also absent in the spectra of the free (18-crown-6) ligand, these bands were attributed to the (C=C) stretching vibration of the double bonded carbon atoms in the benzene ring of the picrate anion[30, 31], this also reinforces the conclusion that the picrate anions are somehow incorporated in the skeleton of the complexes and may give an additional indication for the complex formation. Some important new bands appeared at (546, 523 cm-1) in the spectra of the complexes. These bands were absent in the spectrum of the ligand and were assigned to the stretching vibration of the metal-oxygen bond υ (M-O)[30 – 34]. The data of the FTIR frequencies are shown in table (4). Figures (5) and (6) show the FTIR spectra of 15-crown-5 and its Pr3+ complex respectively, while figures (7) and (8) show the FTIR spectra of 18-crown-6 and its Nd3+ complex respectively.
Table 4: IR data of the ligands and their lanthanide complexes
|
Compound |
υ(C-H) aromatic cm-1 |
υ(C-H)CH2 group cm-1 |
υ(N-O) cm-1 |
δSci. CH2 group cm-1 |
δ wag. CH2 group cm-1 |
δroc CH2 group cm-1 |
υ(C-O-C) cm-1 |
δ(C-H) aromaticcm-1 |
υ(M-O) cm-1 |
υ(C=C) Stretch cm-1 |
|
15-crown-5 |
….. |
2912 2873 |
….. |
1454 |
1249 |
854 |
1117 |
….. |
….. |
….. |
|
[Pr(15C5)](Pic)3. H2O |
3105 |
2900 2873
|
1529 1342 |
1470 1429 |
1277 |
846 |
1089 |
941 |
544 527 |
1610 |
|
[Nd(15C5)2(Pic)](Pic)2.5H2O |
3084 |
2906 2875 |
1541 1329 |
1473 1510 |
1277 |
847 |
1091 1039 |
941 |
542 525 |
1612 |
|
[Dy(15C5)2(Pic)](Pic)2.2H2O |
3087 |
2912 2876 |
1541 1329 |
1474 |
1279 |
850 |
1089 1039 |
941 |
544 522 |
1612 |
|
18-crown-6 |
….. |
2900 2875 |
….. |
1467 |
1353 1296 |
858 |
1140 |
….. |
….. |
….. |
|
[Pr(18C6)](Pic)3 |
3090 |
2945 2889 |
1541 1339 |
1490 1470 |
1362 1259 |
827 |
1065 |
962 |
544 525 |
1614 |
|
[Nd(18C6)](Pic)3 |
3092 |
2951 2897 |
1539 1333 |
1421 |
1360 1258 |
829 |
1067 |
962 |
547 526 |
1612 |
|
[Dy(18C6)(Pic)](Pic)2.3H2O |
3090 |
2953 2893 |
1549 1333 |
1487 |
1360 1256 |
835 |
1057 1068 |
964 |
546 523 |
1614 |
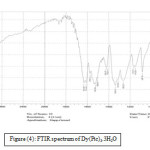 |
Figure 3: FTIR spectrum of Picric Acid Click here to View figure |
 |
Figure 4: FTIR spectrum of Dy(Pic)3.3H2O Click here to View figure |
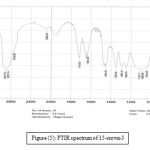 |
Figure 5: FTIR spectrum of 15-crown-5 |
3.H2O](https://www.orientjchem.org/wp-content/uploads/2016/05/Vol32_No2_Syn_HUSS_Fig6-150x150.jpg) |
Figure 6: FTIR spectrum of [Pr(15C5)](Pic)3.H2O Click here to View figure |
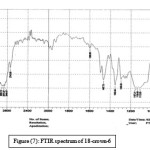 |
Figure 7: FTIR spectrum of 18-crown-6 Click here to View figure |
3](https://www.orientjchem.org/wp-content/uploads/2016/05/Vol32_No2_Syn_HUSS_Fig8-150x150.jpg) |
Figure 8: FTIR spectrum of [Nd(18C6)](Pic)3 Click here to View figure |
1H-NMR and 13C-NMR
The 1H-NMR and 13C-NMR spectra of the ligands were simple and not complex. Both 15-crown-5 and 18-crown-6 show only one peak at δ (3.52 – 3.69 ppm) which corresponds to the (CH2-O-CH2) ether protons[31, 34, 36] in the 1H-NMR spectra. And also one peak at δ (70.29 – 70.64 ppm) which also corresponds to the (C-O-C) ether carbons in the 13C-NMR spectra[31, 37, 38]. The spectra of [Pr(15-crown-5)](Pic)3.H2O and [Nd(18-crown-6)](Pic)3 complexes were simple as well and not so different from that of the ligands, the only difference was that the signals of the (CH2-O-CH2) ether protons in the free ligand experienced a simple shift and a new peak appeared as a singlet at δ (8.66 ppm) in both complexes which was assigned to the aromatic protons of the picrate ion[31, 39]. The appearance of this new peak which was absent in the spectrum of the ligand gives a great indication for the complex formation and may lead to the conclusion that the picrate ions were somehow incorporated in the skeleton of the complex. This conclusion was confirmed by the 13C-NMR spectra of the complexes, in which both complexes showed three singlet peaks, the first peak at δ (125 ppm) which corresponds to the two aromatic carbons attached to the hydrogens of the benzene ring of picrate ion[31], the second peak at δ (142 ppm) which corresponds to the three carbon atoms attached to the nitro groups (C-NO2)[31], and the third peak at δ (161.60 ppm) which was attributed to the carbon atom attached to the phenolic oxygen[31, 39]. These peaks or signals are characteristic of the picrate anion. Since these signals did not experience shifts in their positions they confirm the suggested structures, and that there were no picrate ions coordinated to the metal ion in both complexes. The peaks or signals assigned to the (C-O-C) ether carbons also experienced a simple shift confirming the interaction between the metal ions and the ligands[33, 36, 38]. The data of the 1H-NMR and 13C-NMR chemical shifts are shown in table (5 and 6) respectively. Figures (9) and (10) show the 1H-NMR spectra of 15-crown-5 and its Pr3+ complex respectively, while figures (11) and (12) show the 13C-NMR spectra of 18-crown-6 and its Nd3+ complex respectively.
Table 5: 1H-NMR data of the ligands and some of their complexes
|
Compound
|
Groups |
Chemical Shifts δ (ppm) |
|
15-crown-5 |
-(CH2-O-CH2)5– |
3.56 – 3.63 |
|
[Pr(15C5)](Pic)3.H2O |
-(CH2-O-CH2)5– |
3.42 – 3.65 |
|
Ar – H (picrate ion) |
8.66 |
|
|
18-crown-6 |
-(CH2-O-CH2)6– |
3.52 – 3.57 |
|
[Nd(18C6)](Pic)3 |
-(CH2-O-CH2)6– |
3.40 – 3.57 |
|
Ar – H (picrate ion) |
8.66 |
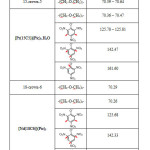 |
Table 6: 13C-NMR data of the ligands and some of their complexes |
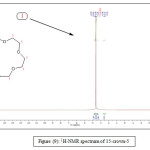 |
Figure 9: 1H-NMR spectrum of 15-crown-5 Click here to View figure |
3.H2O](https://www.orientjchem.org/wp-content/uploads/2016/05/Vol32_No2_Syn_HUSS_Fig10-150x150.jpg) |
Figure 10: 1H-NMR spectrum of [Pr(15C5)](Pic)3.H2O Click here to View figure |
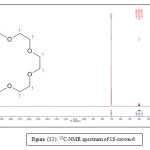 |
Figure 11: 13C-NMR spectrum of 18-crown-6 Click here to View figure |
3](https://www.orientjchem.org/wp-content/uploads/2016/05/Vol32_No2_Syn_HUSS_Fig12-150x150.jpg) |
Figure 12: 13C-NMR spectra of [Nd(18C6)](Pic)3 Click here to View figure |
UV._Visible Spectra
The electronic spectra of picric acid and lanthanide picrates were recorded in ethanol. Picric acid showed two main absorption bands at (λmax 359 and 220 nm)[39, 40]. These bands were shifted to lower wavelengths in the corresponding salts as shown in figures (13 and 14) and table (7). These spectral changes may indicate the formation of ion – pair between lanthanide (Ln3+) ion and picrate (Pic–) ion[40 – 42]. The above absorption bands were attributed to the (n → π* and π → π*) electronic transitions respectively[40, 42]. The electronic spectra of free crown ethers and their complexes were recorded in DMSO. Table (7) shows the absorption data of the ligands and their complexes. The spectra of the ligands are shown in figures (15 and 17) while the spectra of two of the complexes are shown in figures (16 and 18). All crown ligands showed two typical absorption bands as shown in table (7), one of these two bands was shifted to a higher wavelength precisely to (380) nm in all the complexes, while the other band was shifted to a lower wavelength as shown in table (7). The absorption bands of the complexes experienced shifts in their positions and changes in shapes and intensities when compared to the absorption bands caused by the (n → π* and π → π*) electronic transitions of the ligands and the lanthanide picrates, these spectral changes confirm the formation of the complexes and may indicate that there is a change in the environment which caused the shifts in both the ligands and the metal salts spectra. The picrate anion also have a pronounced effect on the formation of the complexes and the nature of the spectra and since the maximum absorption bands of the lanthanide picrate salts are shifted upon complexation to other wavelengths that means the picrate anions one, or more are coordinated to the metal ions[40 – 43].
Table (7): The absorption data of picric acid, lanthanide picrates, ligands and their complexes. Concentration (1 × 10⁻⁴)
|
Compound |
Wavelength λ (nm) |
Absorbance (A) |
ϵ (l.mol-1.cm-1) |
|
Picric acid |
359 220 |
1.421 1.480 |
14210 14800 |
|
Pr(Pic)3.6H2O |
357 213 |
1.260 1.385 |
12600 13850 |
|
Nd(Pic)3.6H2O |
344 203 |
1.127 2.825 |
11270 28250 |
|
Dy(Pic)3.3H2O |
357 204 |
1.622 3.476 |
16220 34760 |
|
15-crown-5
|
337 279 |
0.014 0.124 |
140 1240 |
|
[Pr(15C5)](Pic)3.H2O
|
380 254 |
1.416 0.750 |
14160 7500 |
|
[Nd(15C5)2(Pic)](Pic)2.5H2O
|
380 241 |
0.260 0.528 |
2600 5280 |
|
[Dy(15C5)2(Pic)](Pic)2.2H2O
|
380 221 |
0.981 1.908 |
9810 19080 |
|
18-crown-6
|
335 279 |
0.015 0.131 |
150 1310 |
|
[Pr(18C6)](Pic)3
|
380 253 |
1.071 0.670 |
10710 6700 |
|
[Nd(18C6)](Pic)3
|
380 250 |
0.377 0.585 |
3770 5850 |
|
[Dy(18C6)(Pic)](Pic)2.3H2O
|
380 255 |
1.048 0.480 |
10480 4800 |
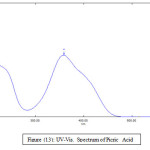 |
Figure 13: UV-Vis. Spectrum of Picric Acid Click here to View figure |
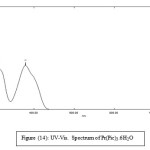 |
Figure 14: UV-Vis. Spectrum of Pr(Pic)3.6H2O Click here to View figure |
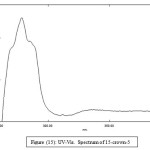 |
Figure 15: UV-Vis. Spectrum of 15-crown-5 Click here to View figure |
2.2H2O](https://www.orientjchem.org/wp-content/uploads/2016/05/Vol32_No2_Syn_HUSS_Fig16-150x150.jpg) |
Figure 16: UV-Vis. Spectrum of [Dy(15C5)2(Pic)](Pic)2.2H2O Click here to View figure |
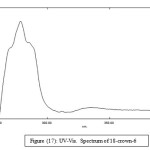 |
Figure 17: UV-Vis. Spectrum of 18-crown-6 Click here to View figure |
3](https://www.orientjchem.org/wp-content/uploads/2016/05/Vol32_No2_Syn_HUSS_Fig18-150x150.jpg) |
Figure 18: UV-Vis. Spectrum of [Pr(18C6)](Pic)3 Click here to View figure |
Antibacterial Activity of the Prepared Complexes
The solvent (DMSO) and all the used ligands showed no activity against the tested bacteria, while all the prepared complexes showed very good results. Table (8) shows the inhibition zones of the solvent, ligands, the prepared complexes and the broad spectrum antibiotic (Chloramphenicol). The inhibition zones were measured in (mm) and compared to the inhibition zone of the broad spectrum antibiotic (Chloramphenicol). Some complexes gave inhibition zones that were smaller than those of the antibiotic but still considered as good results, some other complexes showed similar results and other complexes showed even better results than the antibiotic. Actually chloramphenicol showed no activity at all against the gram negative bacterium (pseudomonas aeruginosa) while all the prepared complexes gave good inhibition zones. This bacterium is known for its resistance to most of the developed antibiotics and is known to be the major cause of many health issues and infections[44-46]. According to the results obtained from the in-vitro test of these compounds they can be potential antibiotic drugs that’s of course after performing many in-vivo studies and exploring their cytotoxicity and behavior in the biological systems. This was left for the future work.
Table 8: The inhibition zones measured in (mm) of DMSO, the ligands, prepared complexes and chloramphinicol
|
Compound |
Inhibition zone(mm) Escherichia coli |
Inhibition zone(mm) Staphylococcus aeureus |
Inhibition zone(mm) Salmonella |
Inhibition zone(mm) Pseudomonas aeruginosa |
|
DMSO |
– |
– |
– |
– |
|
Chloramphinicol |
22.5 |
13.0 |
25.5 |
– |
|
15-crown-5 |
_ |
_ |
_ |
_ |
|
18-crown-6 |
_ |
_ |
_ |
_ |
|
[Pr(15C5)]Pic3.H2O |
14.5 |
24 |
17.5 |
16 |
|
[Nd(15C5)2(Pic)]Pic2.5H2O |
18.5 |
22.5 |
16.5 |
21 |
|
[Dy(15C5)2(Pic)]Pic2.2H2O |
18 |
18 |
16 |
18 |
|
[Pr(18C6)]Pic3 |
12.5 |
19.5 |
15 |
20 |
|
[Nd(18C6)]Pic3 |
17 |
25.5 |
16.5 |
22 |
|
[Dy(18C6)(Pic)]Pic2.3H2O |
11.5 |
Contaminated |
17.5 |
Contaminated |
Suggested Structures
The suggested structures of the prepared complexes were confirmed by their elemental analysis (CHN), thermal analysis, infrared spectroscopy, UV-Visible, 1H-NMR and 13C-NMR spectroscopic methods and also by the molar conductance values. The obtained practical values of the elemental analysis and the thermal analysis agreed with the calculated values, IR, UV-Visible, 1H-NMR and 13C-NMR spectra of the prepared complexes confirmed their formation and confirmed their structure, and the conductance values gave us information about the ionic nature of the prepared complexes and also confirmed their structure. The structures were drawn using (ChemBioDraw Ultra 11.0) software.
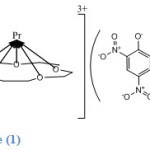
Crown-5 Complexes
As mentioned earlier 15-crown-5 complexes are of the type 1:2:3 except for Pr complex which is of type 1:1:3 , where the order is metal:ligand:picrate ion. In Pr3+ complex the metal lies above the cavity of the ligand forming weaker interactions between the metal ion and the oxygen atoms of the ligand as indicated by the IR spectrum of the complex.
 |
Scheme 1 Click here to View scheme |
Structure (1) shows that all the picrate anions are uncoordinated and lie outside the coordination sphere as counter ions, thus Pr3+ ion in this complex has a coordination number of only (5). This was indicated by the IR spectrum of the complex and by the high value of its molar conductance which revealed its ionic nature.
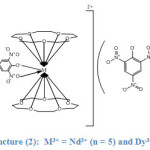 |
Scheme 2 Click here to View scheme |
Structure (2) shows the 1:2:3 stoichiometry of Nd3+ and Dy3+complexes. As it is seen from the structure above both metal ions are located between two ligands forming what is known as a “Sandwich complex”. In these complexes both metal ions are coordinated to the ten oxygen atoms of the two ligands and to the two oxygens of the picrate ion (the phenoxy oxygen and the oxygen from the adjacent nitro group), thereby both metal ions adopt a coordination number of (12) which is the highest coordination number that can be adopted by lanthanides.
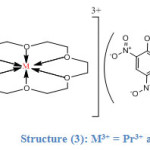
Crown-6 Complexes
All the 18-crown-6 complexes are of the type 1:1:3. In Pr3+ and Nd3+ complexes both metal ions lie inside the cavity of the ligand due to size matching between the cavity diameter and the ionic radius of both metals and hence they form strong interactions with all the six oxygens of the ligand as its indicated by their IR spectra. All the picrate ions are uncoordinated to both of the metal ions and they reside outside the coordination sphere (as counter ions) thereby both Pr3+ and Nd3+ ions adopt the coordination number (6) , in addition both complexes are anhydrous as its seen in structure (3) below:
 |
Scheme 3 Click here to View scheme |
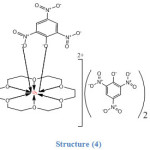 |
Scheme 4 Click here to View scheme |
Structure (4) shows that Dy3+ ion in addition to its coordination to the six oxygen atoms of the ligand is also coordinated to one of the picrate ions and thus it adopts a coordination number of (8). All these structures were confirmed by IR, elemental analysis (CHN), thermal analysis and molar conductance values.
The activity of the prepared complexes against the tested bacteria is believed to rise from one of the following mechanisms
Chelation Theory
chelation which reduces polarity of the metal ion by partial sharing of the positive charge with donor atoms of the ligand. This increases the lipophilic character, favoring the permeation through lipid layers of the bacterial membrane. In gram negative bacteria, lipopolysaccharide (LPS) is an important component and entity in determining the outer membrane barrier function and the virulence of gram negative pathogens. The complexes can penetrate the bacterial cell membrane by coordination of metal ion to LPS which leads to the damage of outer cell membrane and consequently inhibits growth of the bacteria. Chelation reduces the polarity of the Ln (III) ions due to the partial sharing of lanthanides positive charge with the oxygen donor atoms and possibly the electron delocalization over the whole chelate ring system. Therefore, chelation increases the lipophilic nature of the central metal atom, which enhances the penetration of the complexes into the lipid membrane of the microorganism cell wall blocking of the metal binding sites in the enzymes of the microorganism and thus raising the activity of the complex and restricts the further growth of the organism[47, 48].
DNA binding
Metal ions are electron deficient whereas most biological molecules (protein and DNA) are electron rich; consequently there is a general tendency for metal ions to bind and interact with many important biological molecules. In general, components have three distinct modes of noncovalent interaction with DNA i.e. intercalative association, DNA groove binding and electrostatic attraction[49 – 51]. The nature of these interactions is determined by the characteristics of the metal complex. For instance, all cationic metal complexes exhibit electrostatic interactions with the polyanionic DNA molecule, metal complexes with extended aromatic systems may intercalate between the DNA base pairs while mixed – ligand metal complexes were found to be particularly useful because of their high potential to bind DNA via a multitude of interactions and to cleave the duplex by virtue of their intrinsic, chemical, electrochemical and photochemical reactivities[48, 49].
DNA cleavage
Chromosomal DNA fragmentation is caused by two types of DNA breaks viz; single strand break and double strand breaks. Metal containing reagents that induce chemical DNA scission are often referred to as artificial metallonucleases and the attention focused towards the development of new metallonucleases, which bind and cleave DNA at physiological conditions, have gained momentum. DNA cleavage by metallonucleases is dependent on the presence of a biological reductant (e.g. L-ascorbic acid, glutathione) and an oxidant (H2O2)[52]. The cleavage of DNA strands in the presence of the oxidant (H2O2) may be attributed to the formation of hydroxyl free radicals. The hydroxyl radicals participate in the oxidation of the deoxyribose moiety, followed by hydrolytic cleavage of a sugar phosphate backbone[51, 52]. In the presence of the biological reductant (ascorbic acid) and the oxidant (H2O2), artificial metallonucleases relaxes the super coiled form of the DNA to the circular form and linear form [51– 53].
Weakening of the Bacterial Outer Membrane
This is a more general mechanism and is still under study. It states that phenolic compounds can act as permeabilizers and destabilizes the outer membrane of gram negative bacteria making it easier for the drugs to pass through the bacterial membrane [54, 55].
Conclusions
The main conclusions that can be extracted from the results and discussion of this work are summarized as follows
- The lanthanide picrate salts were prepared as Pr(Pic)3.6H2O, Nd(Pic)3.6H2O and Dy(Pic)3.3H2O by heating a mixture of the lanthanide oxide with aqueous solution of picric acid. It has been found that the time required for completeness of the reaction differs from one element to another also the mount of picric acid consumed by the oxide as described in the experimental part.
- Six (6) solid complexes have been isolated with two crown ethers (15-crown-5 and 18-crown-6). Complexes of the type 1:1:3 and 1:2:3 where the order is metal:ligand:counter ion, were identified and their structures were confirmed by elemental analysis (CHN), thermal analysis, FTIR, UV – Vis., 1H-NMR, 13C-NMR, molar conductance and magnetic properties.
- 18-crown-6 has reflected special affinity for complexation with the lanthanide ions which is in agreement with the solvent extraction data. This was to be expected since 18-crown-6 possesses a cavity that fits the sizes of the lanthanide ions. 15-crown-5 has a smaller cavity diameter while the radius of the metal ions is larger that’s why in the 1:1:3 complex Pr3+ ion resides outside the cavity and gives what it looks like a pyramidal structure.
- The lanthanide ions have adopted various coordination numbers in their complexes (5, 6, 8 and 12) they showed a minimum coordination number (5) and a maximum coordination number (12). This behavior is not uncommon in lanthanide elements.
- The thermal data of the prepared complexes agreed quite well with their elemental analysis (CHN), however, an explosive behavior has been shown by all the prepared complexes at a temperature range of (260 – 300 oC) which is a common behavior of all picrate compounds.
- FTIR technique indicated the presence of direct and indirect coordination of picrate ions with the central lanthanide ions in some complexes, consequently the molar conductance decreased in some complexes and increased in some others. Complexes of 15-crown-5 and 18-crown-6 showed high conductance values, which may suggest the presence of strong solvation of the cation by the ligands leaving the picrate anion free unhindered and uncoordinated.
- The magnetic moments of the lanthanide picrates and their corresponding complexes showed no deviation from the theoretically calculated values, this may indicate the non involvement of the 4f electrons in bonding due to their very effective shielding by the electrons in 5s2 and 5p2 orbitals.
- Both ligands and the prepared complexes were tested in-vitro against some gram positive and gram negative bacteria and their results were compared to the broad spectrum antibiotic (Chloramphinicol). Both ligands showed no activity against the tested bacteria while all the complexes showed very good results, some of them were even better than the antibiotic itself. This activity is believed to be caused by the chelation effect which reduces polarity of the metal ion by partial sharing of the positive charge with donor atoms of the ligand. This increases the lipophilic character, favoring the permeation through lipid layers of the bacterial membrane.
Acknowledgements
We are grateful for all those who helped and supported us during our work in the department. I also present my special thanks and gratitude to my supervisors Dr. Mohammed H. A. Al-Almery and Dr. Basim I. Al-Abdaly for their guidance, efforts, knowledge and support.
References
- Maria, E. S. C.; and Mario, S. V. Computational and Theoretical Chemistry 2011, 966, 127.
CrossRef - Wenyun, L.; Weihong, Q.; Jongjoo, K.; Oseoghaghare, O.; Jiaxin, H.; George, W. G. and Dongping, Z. Chemical Physical Letters 2004, 394-415.
- Charles, J. P. J. Am. Chem. Soc. 1987, 495.
- Costa, C. J. M. and Rodrigues, P. M. S. Portugaliae Electrochimica Acta 2002, 20, 167.
- Chang, M. C.; Jiyoung, H. and Nam, J. K. Chemistry Central Journal 2012, 6, 84.
- Alasundkar, K. N.; Deshmukh, M. B.; Salunkhe, D. K. and Sankpal, S. A. Der Chemica Sinica 2011, 2, 118.
- Ligon, S. C.; Chris, M. T.; Jianyong, J.; Stephen, F.; Jennifer, A. I.; Darryl, D. D. and Dennis, W. S. Macromol. Chem. Phys 2004,. 205, 801.
CrossRef - Yen, C. L.; Ming, C. K.; Cheng, W. L.; You, R. L.; Gene, H. L.; Shie, M. P. and Chen, Y. Y. Tetrahedron Letters 2008, 49, 7223.
CrossRef - Andreas, S. and Burkhard, K. Beilstein J. Org. Chem. 2010, 6, 32.
- Sharon, R. L.; Felipe, M.; Margarita, I. B. U. and Carolina, G. A. J. Mex. Chem. Soc. 2009, 53, 209.
- Mihai, B.; Claudiu, T. S.; Andrea, S.; Cornelia, G.; Paula, D.; Mihaela, B.; Vlad, I. and Louis, C. Metal-Based Drugs 1999, 6, 101.
CrossRef - Didier, V.; Mohamed A. D. Oriental Journal of Chemistry 2013, 29, 6, 1267 – 1284.
- Farnoush, F.; Mohammad, R. G.; Rassoul, D.; Parviz, N. and Siavash, R. Sensors 2008, 8, 1645.
CrossRef - George, W. G.; Leevy, W. M. and Michelle, E. W. Cem. Rev. 2004, 104, 2723.
CrossRef - Abdallah, M.; Fouda, A. S. and Elashrey, S. M. ZAŠTITA MATERIJALA 2008, 49, 9.
- Atanassova, M. Russian Journal of Inorganic Chemistry 2007, 52, 1304.
CrossRef - Demin, S. V.; Zhilov, V. I.; Tsivadze, A. Y.; Yakshin, V. V.; Vilkova, O. M.; Tsarenko, N. A.; Pribylova, G. A.; Tananaev, I. G. and Myasoedov, B. F. Radiochemistry 2008, 50, 261.
CrossRef - Yang, Y. W.; Li, C. J.; Zhang, H. Y. and Liu, Y. Chinese Journal of Chemistry 2004, 22, 616.
CrossRef - Donald, J. W.; Elshani, S.; Du, S. H.; Natale, R. N. and Wai, M. C. Anal. Chem. 1993, 65, 1350.
CrossRef - Sergey, P. B. and Anna, V. G. Макрогетероциклы / Macroheterocycles 2012, 5, 178.
CrossRef - Sergey, P. B. and Dmitry, A. M. Journal of Inclusion Phenomena and Macrocyclic Chemistry 2002, 43, 187.
- Sinelshchikova, A. A.; Gorbunova, G. Y.; Lapkina, A. L.; Konstantinov, Y. N. and Tsivadze, Y. A. Russian Journal of Inorganic Chemistry 2011, 56, 1370.
CrossRef - Thomams, U. Can. J. Chem. 1987, 65, 884.
CrossRef - Basim, I. A.; Mohammed, H. A. A. and Mustafa, K. A. IOSR Journal of Applied Chemistry (IOSR-JAC) 2013, 6, 32.
- Geary, J. W. Coord. Chem. Rev. 1971, 7, 81.
CrossRef - Lindeman, S. V. and Struchkov, T. Y. Journal of Inclusion Phenomena and Molecular Recognition in Chemistry 1991, 10, 191.
CrossRef - Yun, S. S.; Kang, K. S.; Suh, R. H.; Suh, S. H.; Lee, K. E.; Kim, K. J. and Kim, H. C. Bull. Korean Chem. Soc. 2005, 26, 448.
- Kim, J.; Kim, C. H.; Kim, K. J. and Yun, S. S. Bull. Korean Chem. Soc. 2008, 29, 156.
- Yan, B.; Zhang, H. J.; Zhou, G. L. and Ni, N. J. Chem. Pap. 2003, 57, 83.
- Kishor, A.; Sirivastava, A. K. and Chauhan, A. S. Oriental Journal of Chemistry 2015, 31, 147 – 155.
- Silverstein, M. R.; Webster, X. F. and Kiemle, D. Spectroscopic Identification of Organic Compounds 2005, 7th (ed.) (New York : John Wiley & Sons).
- Rappoport, Z. The Chemistry of Phenols 2003 (The Atrium, Southern Gate, Chichester, West Sussex, England: John Wiley & Sons).
CrossRef - Mathur, R. P. and Muhana, D. Oriental Journal of Chemistry 2008, 24, 2.
- Lu, T.; Tan, M.; Su, H. and Liu, Y. Polyhedron 1993, 12, 1055.
CrossRef - Azad, S.; Laack, B. and Tysoe, T. W. Surface Science 2002, 496, 87.
CrossRef - Lu, T.; Gan, X.; Tan, M.; Li, C. and Yu, K. Polyhedron 1993, 12, 1641.
CrossRef - Wilson, J. M.; Pethrick, A. R.; Pugh, D. and Islam, S. M. J. Chem. Soc., Faraday Trans. 1997, 93, 2097.
CrossRef - Simon, D. J.; Moomaw, R. W. and Ceckler, M. T. J. Phys.Chem. 1985, 89, 5659.
CrossRef - Jean, M. and Jean, F. D. J. Am. Chem. Soc. 1982, 104, 2967.
CrossRef - Gopalan, R. P.; Selvi, A. and Subramaniam, P. International Journal of Agriculture and Food Science 2013, 3, 90.
- Pimienta, V.; Etchenique, R. and Buhse, T. J. Phys. Chem. A. 2001, 7, 317.
- Sivaramkumar, S. M.; Velmurugan, R. and Sekar, M. Drug Invention Today 2012, 4, 375.
- Semnani, A.; Pouretedal, R. H.; Nazari, B. and Firooz, A. Scientia Iranica 2003, 10, 317.
- Banin, E.; Brady, M. K. and Greenberg, P. E. Applied and Environmental Microbiology 2006, 72, 2064.
CrossRef - Mutalik, B. R. and Gaikar, G. V. Enzyme and Microbiological Technology 2003, 32, 14.
CrossRef - Bos, P. M. and Tommassen, J. Infection and Immunity 2005, 73, 6194.
CrossRef - Singh, V. R.; Mitharwal, P.; Singh, R. and Mital, P. S. American Chemical Science Journal 2014, 4, 117.
CrossRef - Hegazy, H. W. and Gaafar, A. E. M. American Chemical Science journal 2012, 2, 86.
CrossRef - Marjanovic, M.; Karlj, M.; Supek, F.; Frkanec, L.; Piantanida, I.; Smuc, T. and Bozic, T. L. J. Med. Chem. 2007, 50, 1007.
CrossRef - Prasad, S. K.; Kumar, S. L.; Revanasiddappa, D. H.; Vijay, B. and Jayalakshmi, B. Chemical Science Journal 2011, 28, 134.
- Adelaide, M. O. and James, O. O. International Journal of Research in Pharmaceutical and Biomedical Sciences 2013, 4, 2229.
- Raman, N. and Sobha, S. J. Serb. Chem. Soc. 2010, 75, 773.
CrossRef - Kellett, A.; Howeb, O.; Connor, O. M.; McCann, M.; Creaven, B.; McClean, S.; Arfakiad, F. A.; Casey, A. and Devereux, M. Free Radical Biology and Medicine 2012, 53, 564.
CrossRef - Bazrafshan, E.; Mostafapour, K. F. and Mansourian, J. H. Health Scope 2013, 2, 60.
- Nohynek, J. L.; Alakomi, L. H.; Kähkönen, P. M.; Heinonen, M.; Helander, M. I.; Caldentey, O. K. and Puupponen, H. R. Nutrition and Cancer 2006, 54, 18.
CrossRef - https://www.orientjchem.org/wp-content/uploads/2016/05/Vol32_No2_Syn_HUSS_sch1.jpg


![]()


