Synthesis and Characterization of Nanosized Uranyl Coordination Polymers derived from Terephthalic acid and Azoles
Maged S.Al-Fakeh
Department of Chemistry, Faculty of Science, Qassim University, Saudi Arabia.
Corresponding Authotr Email : alfakehmaged@yahoo.com
DOI : http://dx.doi.org/10.13005/ojc/320241
Article Received on :
Article Accepted on :
Article Published : 02 Apr 2016
The structure of the complexes [UO2(TPA)(Azole)(H2O)].xH2O, TPA = 1,4-benzenedicarboxylic acid and azoles = 2-aminobenzothiazole, 2-aminothiazole, 2-amino-4-methylthiazole and 2-mercaptobenzothiazole has been prepared and characterized. The structure of the complexes has been assigned based on elemental analysis, IR, electronic spectral studies, magnetic measurement, molar conductance, Scanning electron microscope (S.E.M), X-ray powder diffraction techniques investigations and thermogravimetric analysis complete the characterization of the compound. Thermogravimetry(TG), derivative thermogravimetry (DTG) and differential thermal analysis (DTA) have been used to study the thermal decomposition of the complexes. The kinetic parameters have been calculated making use of the Coats-Redfern and Horowitz-Metzger. The scanning electron microscope SEM photographs and particle size calculations from the powder XRD data indicate the average size of the prepared UO2(II) (28-56 nm) supramolecular coordination polymers in the nanoscale range. The biological screening of the compounds was also tested.
KEYWORDS:Coordination polymers; X-ray; SEM; thermal studies and biological activity
Download this article as:| Copy the following to cite this article: Al-Fakeh M. S. Synthesis and Characterization of Nanosized Uranyl Coordination Polymers derived from Terephthalic acid and Azoles. Orient J Chem 2016;32(2). |
| Copy the following to cite this URL: Al-Fakeh M. S. Synthesis and Characterization of Nanosized Uranyl Coordination Polymers derived from Terephthalic acid and Azoles. Orient J Chem 2016;32(2). Available from: http://www.orientjchem.org/?p=15154 |
Introduction
Currently, the coordination polymers span scientific fields such as organic and inorganic chemistry, biology, materials science, electrochemistry, and pharmacology, having many potential applications [1-5]. Terephthalic acid and its metal complexes have been a subject of interest in numerous studies because of their chemical and biological activities. They have a wide range of vehicle diverse characteristic properties attributed to their chelating ability with metal ions. Really, an important number of 1,4-benzenedicarboxylic acid being bidentate donors. Aromatic polycarboxylates, such as benzenedicarboxylate, have been well used to construct coordination frameworks [6], by direct interaction with metal ions to form discrete polynuclear [7], 1-, 2- and 3-D coordination networks [8] in a variety of coordination modes. Benzenedicarboxylate exhibits a variety of bridging modes and strong tendency to form large, tightly bound metal cluster aggregates and has been used as a building block to construct some porous coordination frameworks. In desiging 1-, 2-, 3-D extended porous coordination polymers, the selection of appropriate ligands is crucial to determining the structural outcome of target polymers. Carboxylates [9,10] tend to form relatively rigid frameworks due to the potential bidentate coordination of their carboxylate groups. Recently, mixed-linker systems of both carboxylates and another ligands have proved to be effective in preparation of coordination polymers [11-16]. The chemistry of uranium is the most developed, due to the low radioactivity of one of its isotopes and its wide use at industrial and laboratory scales [17]. Uranium(VI) tends to form linear cation with two oxygen atoms UO22+ which can be further surrounded by a number of anions commonly laying in one plane, which is perpendicular to O–U–O structure [18]. In this paper synthesis and characterization of uranyl(ІІ) coordination polymers containing 1,4-benzenedicarboxylate and azole ligands are described.
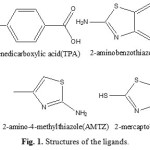 |
Figure 1: Structures of the ligands |
Experimental
Material and methods
All chemical were of analytical grades. 1,4-Benzenedicarboxylic acid, 2-aminobenzo-thiazol, 2-aminothiazol, 2-amino-4-methyl-thiazol and 2-mercaptobenzothiazole were E. Merck grade. Were purchased and used without purification.
Preparation of the complexes
Preparation of the mixed ligand coordination polymers of TPA and azoles with UO2(acetate) follows essentially the same procedure, [UO2(TPA)(ABZ)(H2O)] is typical. To an ethanolic solution (15 ml) of UO2(acetate) (0.2 g , 4.7 mmol) a solution of TPA (0.078 g TPA in 15 ml 0.1M NaOH, 4.7 mmol) was added dropwise and with stirring, then ABZ solution (0.070 g in 15 ml ethanol, 2.4 mmol) was added to the mixture. The mixture was refluxed and then cooled to room temperature. Yellow precipitate separated, which filtered, washed with distilled water and EtOH and dried in over CaCl2 anhydrous.
Stoichiometric analysis(C,H,N,S) were performed using Analyischer Funktionstest Vario El Fab-Nr.11982027 elemental analyzer.The i.r spectra were recorded on a Shimadzu IR-470 spectrophotometer and electronic spectra were obtained using a Shimadzu UV-2101 PC spectrophotometer. Thermal studies were carried out in dynamic air on a Shimadzu DTG 60-H thermal analyzer at a heating rate 10 °C min-1. Molar susceptibilities were corrected for diamagnetism of the component atoms by the use of the Pascal ‘s constants . The calibrant used was Hg[Co(SCN)4]. XRD Model PW 1710 control unit Philips, Anode material Cu 40 K.V 30 M.A Optics: Automatic divergence slit. Scanning electron microscope (JEOL JFC-1100E ION SPUTTERING DEVICE, JEOL JSM-5400LV SEM). SEM specimens were coated with gold to increase the conductivity. For the biological activity all microbial strains were kindly provided by the Assiut University Mycological Centre (AUMC), Egypt. These strains are common contaminants of the environment in Egypt and some of which are involved in human and animal diseases (Candida albicans, Geotrichum candidum, Scopulariopsis brevicaulis, Aspergillus flavus, Staphylococcus aureus), plant diseases (Fusarium oxysporum) or frequently reported from contaminated soil, water and food substances (Escherichia coli, Bacillus cereus, Pseudomonas aeruginosa and Serratia marcescens). To prepare inocula for bioassay, bacterial strains were individually cultured for 48h in 100 ml conical flasks containing 30 ml nutrient broth medium. Fungi were grown for 7 days in 100 ml conicals containing 30 ml Sabouraud’s dextrose broth. Bioassay was done in 10 cm sterile plastic Petri plates in which microbial suspension (1 ml/plate) and 15 ml appropriate agar medium (15 ml/plate) were poured. Nutrient agar and Sabouraud’s dextrose agar were respectively used for bacteria and fungi. After solidification of the media, 5 mm diameter cavities were cut in the solidified agar (4 cavities/plate) using sterile cork borer. The chemical compounds dissolved in dimethyl sulfuxide (DMSO) at 2%w/v (=20 mg/ml) were pipetted in the cavities (20 ul /cavity). Cultures were then incubated at 28°C for 48 h in case of bacteria and up to 7 days in case of fungi. Results were read as the diameter (in mm) of inhibition zone around cavities.
Result and Discussion
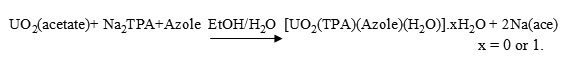
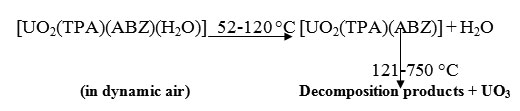
The complexes were prepared by the reaction of TPA (1,4-benzenedicarboxylate) neutralized with NaOH, UO2(acetate), 2-amino- benzothiazole(ABZ), 2-aminothiazole (AZ), 2-amino-4-methyl- thiazole (AMTZ) and 2-mercaptobenzothiazole (MBZT) (dissolved in EtOH). The prepared complexes were found to react in the molar ratio 1: 1: 1 metal : TPA : Azoles to yield the corresponding compounds according to the following equation:
The compounds are air stable, insoluble in common organic solvents but partially soluble in DMF and DMSO .The conductivity values, measured in DMSO at room temperature, fall in the range for non-electrolytes [19]. The compositions of the complexes are supported by the elemental analysis recorded in Table (1).
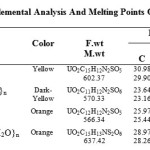 |
Table 1: Colors, Elemental Analysis And Melting Points Of The Complexes. |
IR spectra
The main IR frequencies can be seen in Table (2). The IR spectra of the prepared compounds show two bands in the ranges 1540-1568 and 1374-1400 cm-1 characteristic of the asymmetric and symmetric stretching vibrations of the carboxylic groups of the BDC coordinated to the metal center. Furthermore, the IR spectra of the complexes 1 – 4 showed a separation value Δυ≤190 cm-1 indicating a bidentate mode of coordination for the carboxylate group[20]. It is found that the CSC band of azoles at ~740 cm-1 is almost unchanged in the respective complexes, indicating that the thiazol-S is not involved in the bonding [21]. The stretching vibration of νC=N for the complexes undergo no appreciable shift of ABZ 1640 cm-1 [22]. Furthermore, the stretching vibration of the amino group in free ABZ observed at 3220 cm-1 is shifted to a lower wave number and appears in the range 3150-3190 cm-1 in the complexes suggesting coordination of the amino nitrogen to the metal(ІІ) ions [23]. The bands at 3410-3440 cm-1 in the spectra of the complexes are assigned to νOH of the crystalline water molecules [24,25]. Metal-oxygen and metal-nitrogen bonding are manifested by the appearance of bands in the 520-536 cm-1 and 410-440 cm-1 regions respectively [26].
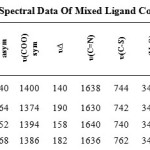 |
Table 2: Infrared Spectral Data Of Mixed Ligand Complexes. |
![Fig. 2. IR Spectrum of {[UO2(TPA)(MTBZ)(H2O)].H2O}n](http://www.orientjchem.org/wp-content/uploads/2016/04/Vol32_No2__SPEC_Sas_Fig2-150x150.jpg) |
Figure 2: IR Spectrum of {[UO2(TPA)(MTBZ)(H2O)].H2O}n |
Electronic Spectra and Magnetic Moments
The UV-Vis spectra of the complexes have been recorded in DMSO. The spectra display two distinct bands in the ranges 36,654-38,760 and 21,458-24,382 cm-1 which attributed to interaligand transitions and π→π* within Azoles and TPA moieties, [27,23] respectively. In the visible spectra, there are characteristic bands attributed to the d-d transitions of the Uranyl complexes typical of octahedral structures. Thus, the complexes 1, 2, 3 and 4 exhibit a d-d band in the range 15,188-18,825 cm-1. Additionally, the magnetic moments of the compounds were measured and the uranyl complexes show diamagnetic values [28]. The results are shown in Table (3).
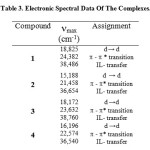 |
Table 3: Electronic Spectral Data Of The Complexes. |
![Fig. 3. Structure of the complex [UO2(TPA)(ABZ)(H2O)]n](http://www.orientjchem.org/wp-content/uploads/2016/04/Vol32_No2__SPEC_Sas_Fig3-150x150.jpg) |
Figure 3: Structure of the complex [UO2(TPA)(ABZ)(H2O)]n |
Thermal Studies
The thermal decomposition of the complexes has been investigated in dynamic air from ambient temperature to 750 °C. As a representative example the thermogram of the complex 1 shows three decomposition steps. In the first step the coordinated water molecule is released (calc. 2.99 %, found 3.02 %). The DTG curve displays this step at 92 °C and an exothermic peak appears at 94 °C in the DTA trace. The second and third steps correspond to the decomposition of ABZ and TPA. The final product was identified on the basis of mass loss consideration as UO3 (calc. 47.48 %, found 46.12 %). Fig.(4).
Table 4: Thermal Decomposition Data Of The Complexes
|
Mass Loss(%) |
TG/DTG |
Step |
Compound |
||
|
Tf |
Tm |
Ti |
|||
|
3.02 20.66 30.19 |
120 364 750 |
92 283 464 |
52 121 365 |
1st 2nd 3rd |
1
|
|
6.08 21.40 25.09 |
201 374 750 |
174 289 468 |
60 202 375 |
1st 2nd 3rd |
2 |
|
3.01 15.32 14.27 18.44 |
132 235 377 750 |
90 202 296 482 |
62 133 236 379 |
1st 2nd 3rd 4th |
3 |
Kinetic Analysis
Non-isothermal kinetic analysis of the complexes was carried out applying two different procedures: the Coats-Redfern [29] and the Horowitz-Metzger [30] methods.
Coats-Redfern equation
ln[1-(1-α)1-n/ (1-n)T2] = M / T + B for n ≠ 1 (2)
ln[-ln(1-α)/ T2] = M / T + B for n = 1 (3)
where α is the fraction of material decomposed, n is the order of the decomposition reaction and M = E/R and B = ZR/ΦE; E, R, Z and Φ are the activation energy, gas constant, pre-exponential factor and heating rate, respectively.
Horowitz-Metzger equation
ln[1-(1-α)1-n/1-n] = lnZRTs2/ΦE – E/RTs+ Eθ/RTs2 for n ≠ 1 (4)
ln[-ln(1-α)] = Eθ/RTs2 for n = 1 (5)
where θ = T-Ts, Ts is the temperature at the DTG peak.
The correlation coefficient r is computed using the least squares method for equations (2), (3), (4) and (5). Linear curves were drawn for different values of n ranging from 0 to 2. The value of n, which gave the best fit, was chosen as the order parameter for the decomposition stage of interest. The kinetic parameters were calculated from the plots of the left hand side of equations (2), (3), against 1/T and against θ for equations (4) and (5). The kinetic parameters calculated according to the above two methods are cited in Table 5.
Table 5: Kinetic parameters of the thermal decomposition of the compounds.
|
Horowitz-Metzger equation |
Coats-Redfern equation |
Step |
Compound |
||||
|
E |
n |
r |
E |
n |
r |
||
|
126 |
2.00 |
1 |
122 |
2.00 |
0.9996 |
1st |
1 |
|
102 |
0.50 |
0.9985 |
98 |
0.50 |
0.9960 |
1st |
2 |
|
28 |
0.66 |
0.9979 |
22 |
0.66 |
1 |
1st |
3 |
E in kJ mol-1.
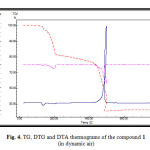 |
Figure 4: TG, DTG and DTA thermograms of the compound 1 (in dynamic air) Click here to View figure |
X-ray powder diffraction
The X-ray powder diffraction patterns of the complexes were recorded. The crystal lattice parameters were computed with the aid of the computer program TREOR. The crystal data are recorded in Table (6) (Fig.5). The nanosized of these coordination polymers were 28.56 nm.
The crystal data for the three compounds belong to the crystal system triclinic. The significant broadening of the peaks indicates that the particles are of nanometer dimensions (XRD of the compound 3 is depicted in Figure 5). Scherrer’s equation was applied to estimate the particle size of the coordination polymers:
D = Kλ / βcosθ (6)
where K is the shape factor, λ is the X-ray wavelength typically 1.54 إ, β is the line
broadening at half the maximum intensity in radians and θ is Bragg angle and D is
the mean size of the ordered (crystalline) domains, which may be smaller or equal to
the grain size. The crystal data together with particle size are collected in Table
(6). The average size of the particles lies in the range 28-56 nm for compounds.
Table 6: X-Ray Diffraction Crystal Data Of The Compounds 1, 2, 3 And Their Particle Size.
|
3 |
2 |
1 |
Parameters |
|
UO2C12H12N2SO5 566.34 triclinic 4.640 11.817 23.577 72.410 47.588 71.889 898.78 56 |
UO2C11H12N2SO6 570.33 triclinic 4.562 11.342 19.109 86.199 114.506 83.478 893.61 34 |
UO2C15H12N2SO5 602.37 triclinic 4.326 12.424 18.677 92.548 111.316 64.688 837.90 28 |
Empirical formula Formula weight Crystal system a (Å) b (Å) c (Å) α (°) β(°) γ(°) Volume of unit cell(Å3) Particle size(nm) |
![Fig. 5. X-ray of [UO2(TPA)(AMTZ)(H2O)]n 3](http://www.orientjchem.org/wp-content/uploads/2016/04/Vol32_No2__SPEC_Sas_Fig5-150x150.jpg) |
Figure 5: X-ray of [UO2(TPA)(AMTZ)(H2O)]n 3 |
Biological Activity
Terephthalic acid and some ternary coordination polymers were tested against some five bacterial and six fungal species (Tables 7). The data showed that in some cases the compounds have a similar antimicrobial activity than the selected standards (chloramphenicol and clotrimazole ). These bacteria and fungi strains are common contaminants of the environment in Yemen e.g. some of which are frequently reported from contaminated soil, water and food, or involved in human and animal diseases.
Table 7: Microbiological Screening Of The Complexes.
|
S. brevicaulis |
G. candidum |
F. oxysporm |
C. albicans
|
A. flavus |
T. rubrum |
P. aeruginosa (G-ve)
|
E. coli (G-ve)
|
S. Marcescens (G-ve) |
S. aureus (G+ve)
|
B. cereus (G+ve)
|
Compound |
|
11 |
10 |
8 |
10 |
8 |
11 |
14 |
13 |
13 |
13 |
14 |
1 |
|
13 |
16 |
11 |
12 |
10 |
14 |
11 |
12 |
8 |
8 |
14 |
2 |
|
12 |
8 |
10 |
12 |
10 |
16 |
13 |
12 |
11 |
13 |
8 |
3 |
Scanning Electron Micrographs ( S.E.M)
The scanning electron micrograph of UO2 complex 1 is depicted in Fig.6. The figure shows the spherical shape of the nanoparticles which are aggregated to some extent.
![Fig. 6. S.E.M of [UO2(TPA)(ABZ)(H2O)]n](http://www.orientjchem.org/wp-content/uploads/2016/04/Vol32_No2__SPEC_Sas_Fig6-150x150.jpg) |
Figure 6: S.E.M of [UO2(TPA)(ABZ)(H2O)]n |
Conclusions
A number of new one-dimensional nano-sized UO2(II) metal supramolecular coordination polymers of TPA (1,4-benzenedicarboxylate) and azoles has been prepared and characterized.
References
- Fujita .M., Kwon Y.J., Washizu S., Ogura .K., J. Am. Chem. Soc. 1994.116: 1151
- Yaghi .O.M., Li .H., Davis. C., Richardson .D., Groy .T.L., Acc. Chem. Res. 1998.31: 474
- Seo. J.S., Whang. D., Lee. H., Jun .S.I., Oh .J., Jeon .Y.J., Kim K., Nature 2000.404: 982
- Ma. S.Q., Wang. X.S.,. Yuan. D.Q, Zhou. H.C., Angew. Chem. Int. Ed. 2008. 47: 4130
- Fromm .K, Coord. Chem. Rev. 2008. 252: 856
- Steiner. T., Angew. Chem. Ed. Engl. 2002. 41: 48
- Nangia. A., Cryst. Eng. Commun. 2002.4: 93
- Aullon. G., Bellamy. D.,. Orpen. A.G,. Brammer. L, Bruton. E.A. , Chem. Comm. 1998. 653
- Desiraju. G.R, Acc. Chem. Res. 1996.29: 441
- Janiak. C., J. Chem. Soc. Dalton Trans. 2000.,3885 .
- Pyykko. P., Chem. Rev. 1997.97: 597
- Clegg W., Compreh. J. Coord. Chem. 2004.1: 579
- Carlucci. L., Ciani. G., Proserpio. D.M., Coord. Chem. Rev. 2003.246: 247
- Holman. K.T.,. Hammud H.H, Isber. S., Tabbal. M., Polyhedron. 2005.24: 221
- Choi. H.J.,. Suh. M.P, Inorg. Chem. 1999. 38: 6309
- Robin. A.Y.,. Fromm. K.M, Goesmann .H., Cryst. Eng. Commun. 2003.5: 405
- Serezhkin .V.N., Structural Chemistry of Inorganic Actinide Compounds. Elsevier 2007.
- Lermontov. A.S., Lermontova. E.K., Wang. Y-Y., Inorg Chim Acta 2009.362: 3751
- Geary. W. J., Coord. Chem. Rev, 1971.7: 81
- Rogan. J., Poleti. D., Karanovic. L., Bogdanovic. G., Polyhedron 2000.19: 1415
- Maurya R. C, Verma. R. , Synth. React. in Inorg. and Metal-Org. Chem.2003. 33: 1063
- Lane. T.J,. Nakagawa. I, Walter. J.L., Kandathil. A.J.,. Inorg. Chem. 1962. 1: 267.
- Aly. A. A. M,. El-maligy. M. S, Zidan. A. S., El-Shabasy. M.. Anal. De Quim. 1990.,86: 19
- Bravo. A, Anacona. J. R., Trans. Met. Chem. 2001.26: 20.
- Rakha. T. H, Synth. React. Inorg. Met.- Org. Chem. 2000. 30: 205 (a)
- B. Valeur, Molecular Fluorescence: Principles and Applications, Wiley-VCH, Weinheim 2002 (b) H. Yersin, A. Vogler, Photochemistry and Photophysics of Coordination Compounds, Springer, Berlin, 1987.
- Anacona. J. R., Da Silva. G., J. Chil. Chem. Soc. 2005., 50: 447
- El-Tabl. A.S., Spectrochimica Acta Part A 2008.71: 90
- Coats .A. W.,. Redfern. J. P, Nature, 1964.20:68
- Horowitz. H. H., Metzger. G., Anal. Chem. 1963. 35: 1464

This work is licensed under a Creative Commons Attribution 4.0 International License.
![]()
A New Edition of Web of Science
Journal Impact Factor
2022: 0.5
Five Year: 0.8
Journal is Indexed in

Cabells Whitelist
![]()


