Spectrophotometric Determination of Kinetic Constants of Fe (Iii)-Amines’s Charge Transfere Complexes
Kamel Bentayeb٭, Noureddine Tchouar and Adil A. Othman
Department of Physical Chemistry, Faculty of Chemistry, University of Sciences and Technology- Mohamed Boudiaf- Oran, USTO-MB, P.O.B.1505 El Mnaouer, Oran, Algeria
Corresponding author Email: k_bentayeb@yahoo.fr
DOI : http://dx.doi.org/10.13005/ojc/320230
Article Received on :
Article Accepted on :
Article Published : 17 May 2016
Using UV-visible spectrophotometric data of (1:1), electron donor-acceptor complexes (AD1, AD2 and AD3) have been investigated. The complexes concerned are n-butyl amine (D1) and cyclohexyl amine (D2) and phenyl hydrazine (D3) as electron donors with iron (III) ion as an electron acceptor (A) in methanol at 25°C. The values of formation constant (KAD), molar extinction coefficient (εAD), and absorption band energy of complexes were estimated. The ionization potential of the donors ID, were calculated from the complex band energies. The kinetics of the above association and reverse reactions were studied and some kinetic parameters have been estimated.
KEYWORDS:UV-Visible spectroscopy; charge transfer complex; Benesi-Hildebrand; Scott and Foster-Hammick-Wardley equations; formation constant; molar extinction coefficient
Download this article as:| Copy the following to cite this article: Bentayeb K, Tchouar N, Othman A. A. Spectrophotometric Determination of Kinetic Constants of Fe (Iii)-Amines’s Charge Transfere Complexes. Orient J Chem 2016;32(2) |
| Copy the following to cite this URL: Bentayeb K, Tchouar N, Othman A. A. Spectrophotometric Determination of Kinetic Constants of Fe (Iii)-Amines’s Charge Transfere Complexes. Orient J Chem 2016;32(2). Available from: http://www.orientjchem.org/?p=16099 |
Introduction
Many electronic spectrophotometric studies have been reported in the coordination chemistry field on complexes. [1-6] Generally, these complexes were obtained by using different electron donors with various organic, [7-10] or metallic electron acceptors [11-13] in polar and non-polar solvents. In this work, the formation of complexes were discussed and different parameters concerning their behaviour in methanol solution at 25°C were calculated. Usually the formation constants (KAD) and molar extinction coefficients (εAD) of complex were calculated using the equations of Benesi-Hildebrand, Scott and Foster-Hammick-Wardley [14-16] (equations 1, 2 and 3) respectively by using the obtained experimental data:
[A0] /A = 1/ KAD εAD [D0] + 1 / εAD (1)
[D0] [A0] /A = [D0] / εAD + 1 / εAD KAD (2)
A / [D0] = – KAD A + KAD εAD [A0] (3)
Where A is, the absorbance of the complex band, [Ao] and [Do] are the initial concentrations of the electron acceptor and the electron donor respectively. KAD is the formation constant of the complex in solution, while εAD represents the molar extinction coefficient of complex. The charge transfer complexes may also be studied by evaluating their electronic absorption band energies. The ionization potentials of electron donors can be obtained from charge transfer absorption bands by using different approaches as in the following equations [8, 17-19]:
This paper is dedicated to the memory of the late Professor Ali Hassoun Al-Taiar
h. uAD = ID – C1 + C2/ ID - C1 (4)
h. uAD = α ID+ b (5)
ID = 4.39 + 0.857 huAD (6)
ID = 5.1 + 0.7 huAD (7)
Where huAD is the absorption band energy of charge transfer complex, and ID is the ionization potential of the electron donor. C1= 5.2 eV, C2 = 1.5 eV, a = 0.67 or 0.87, b = −1.9 or −3.6.
Several kinetics parameters of association of electron donors with electron acceptors been reported. [20, 21]
Experimental
n-Butyl amine, cyclohexyl amine, phenylhydrazine and Ferric chloride with a purity of 99.8% obtained from Merck have been used without further purification. Methanol (Fluka) was distilled before using. The UV-visible spectra were measured using a Pye Unicam SP8-100 spectrophotometer. The complexes were prepared by mixing variable amounts of donor solutions with an acceptor solution in methanol. The donor concentrations used ranged between 1.10−3 and 4.10−9 mol/L while the acceptor concentration remained constant (1.10−3 mol/L).
Results and Discussion
In this work, we investigated the kinetics of the equilibrium between n-butyl amine, cyclohexyl amine, phenylhydrazine and Ferric chloride and their complexes in methanol at 25°C. Also, calculating the equilibrium constants and the orders of the reaction as well as the rate constants of the forward and the reverse reactions. Moreover, the half-life period of the reactions also obtained. In addition, the ionization potentials of the electron donors calculated spectroscopically. The reason for choosing the amines as complexing agents is that their reaction with Fe (III) ion is slow and easy to measure. The importance of all calculations in this work is to prove the validity of Scott and Foster-Hammick-Wardley equations for these reactions. Another major objective of this study was the calculation of the formation constants of the complexes. In principle, the analysis of the UV/Visible spectrometric method using the Benesi-Hildebrand’s equation, later modified by Scott, permits these determinations for complexes of 1:1 type, for which the proposed equation is linear. In addition, this method provides an easier and direct determination of iron without any extraction or heating. Finally, for additional works, some results could be obtained to give complementary parameters, such as pH of the solution, nature of solvent and temperature in the complexation reactions of Fe (III), and hence to accomplish determination of iron in different water samples. Table 1 shows the symbols and structures of donors (Di) and acceptor (A) FeCl3.
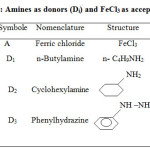 |
Table 1: Amines as donors (Di) and FeCl3 as acceptor (A) |
The UV maximum wavelength absorption band of donors, acceptor and complexes are shown in Table 2. All maximum absorption bands of the acceptor and donors disappeared and the new absorption bands of the complexes are located in the visible region probably due to the complete transfer of electrons from the donor, which has ionic properties, to the unfilled orbital of the transition ferric ion.
Table 2: Maximum wavelength of the absorption bands of the donor, acceptor and complex (AD) in methanol at 25°C
|
Compound Donors |
A lmax (n.m) |
D lmax (n.m) |
A D lmax (n.m) |
|
D1 |
275 |
277 |
340 |
|
D2 |
275 |
277 |
406 |
|
D3 |
275 |
273 |
361 |
With the ferric ion, the three complexes have been prepared with various amines of which of tow of them are between 340 and 360 nm due to the strong affinity of the metal ion towards the formation. For complexe AD3, the wide gab in as compared the other two mentioned amine complexes, may be attributed to the effect of the two amine functions present already there.
The energy in eV for complexes (AD1, AD2 & AD3) were obtained by using the following equations 8 and 9.
EAD = 1243.667 / lmax (e.V) (8)
DG0= – RT ln KAD = – 2.303RT log KAD (9)
Where, DG0is the free energy of complex (in kJmol-1), R the gas constant (8,314 J mol-1 K-1), T the temperature in Kelvin. The value of ionization potentials ID of the donors calculated using equations 4 – 6 are equals to, 7.131, 7.848, 7.100 eV for D1, D2 and D3 respectively.
For phenylhydrazine-Fe complex it is observed that equation (2) give the better straight line (R² = 0.999) when [D0].[A0]/A was plotted against [D0] with support the formation of charge transfer complex (Figure 1).
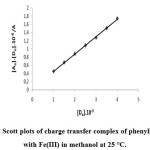 |
Figure 1: Scott plots of charge transfer complex of phenylhydrazine with Fe(III) in methanol at 25 °C.
|
Thus, εAD and KAD are easily determined. The regression equation describing the line obtained from Scott plot is given by:
[D0].[A0]/A = 0,021.10-6 + 4,25 10+2[D0]
In this plot the slop and intercept equals 1/ εAD and 1/ εAD KAD respectively. The formation constant and molar coefficient of the AD complex were calculated and shower in Table 3. The others coefficients are calculated from equation (1).
Table 3 gives the values of εAD and KAD, absorption band energy (E) and free energy (DG) of the complex reaction in methanol at different donor concentrations at 25°C. When equation (2) is used and plotted, the value KAD and εAD for the complex phenylhydrazine-Fe (AD3) complex obtained as shown in figure 1 and table 3.
These values of εAD are 2488 L.cm−1.mole−1 while those of KAD are 4246 L.mole−1.
From the values of εAD show that lower amounts of donor are more sensitive to the absorption than higher concentrations. These high values of KAD may show the high stability of the complex in methanol solutions.
Table 3: Values of formation constant (KAD), molar extinction coefficient (εAD), energy of the absorption band (E) and free energy change (DG) of the complex reaction in methanol at 25°C:
|
Complex AD1 |
Complex AD2 |
Complex AD3 |
|
|
KAD (l/mol) |
709.06 |
473 |
4246 |
|
εAD (l/mol.cm) |
2150.70 |
693.02 |
2488 |
|
E (ev) |
3.6483 |
3.0552 |
3.435 |
|
DE (ev) |
5.36 x 10⁻³ |
3.762 x 10⁻³ |
4.765 x 10⁻³ |
|
-DG (kj/mol) |
16.37 |
15.56 |
20.53 |
The reaction of phenylhydrazine as an example with ferric ion is estimated to be a second order reaction as in Figure 2 and Table 4.
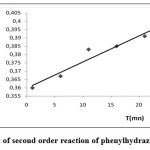 |
Figure 2: Plot of second order reaction of phenylhydrazine-Fe complex |
The rate constant (k1) of the forward reaction was calculated from the graph and the value obtained was 0,97 x 10⁻³ L.mol-1.min-1 from which the half-life (t1/2) of 206 min. was obtained. Using the values of the equilibrium constant shown in Table 3, the rate constant of the reverse reaction (k−1) was calculated to be 0,23 x 10⁻⁶ L.mol-1.min-1. Since it is none that KAD = k1/k-1 (see table 3)
Table 4: Results of the kinetic studies
|
Symbol |
Complex |
Order of reaction
|
Rate* constant k1.103 |
Rate* constant k-1.106 |
t1/2 (min) |
| AD1 | n-Buthylamine-Fe |
0 |
2.70 |
3.81 |
5330 |
| AD2 | Cyclohexamine-Fe |
1 |
4.03 |
8.52 |
1720 |
| AD3 |
Phenylhydrazine-Fe |
2 |
0,97 |
0.23 |
206 |
*the unit of the rate constant k depends on the order of the reaction.
Order 0: (k1) = mol. L-1.min.-1 , Order 1: (K1) = min.-1, Order 2: (K1) = L. mol.-1.min.-1
These values of KAD, k1 and k−1 show that the stability of phenylhydrazine-Fe complex is very high and the forward reaction rate is much higher than the reverse reaction rate. KAD values of the complexes vary between 473 – 4246 l/mol. These results are in accord that iron ion/ Phenylhydrazine complex is more stable.
Conclusions
Charge transfer complex (AD) was obtained and the colored reaction of phenylhydrazine with iron (III) was studied using Scott equation and the spectrometric UV-visible data. The obtained results indicate the formation of 1:1 charge transfer complex. Phenylhydrazine is one of the sensitive spectrophotometric reagents for iron. The molar absorptivity of the complex reaches 2488 L.cm-1.mol-1. The determination of some complexation parameters shows that the reaction is instantaneous. The association constant Fe (III)-phenylhydrazine and Gibbs free energy are 4246 L.mol-1 and -20.53 kJ.mol–1, respectively.
Acknowledgments
Thanks are due to Professor Anis Al-Najjar of Basrah University, Iraq, for scientific comments and to Mrs. Karima Abed for arranging references.
References
- Gopala Krishna D.; Devi C.K. World J.Pharmacy and Pharmaceutical Sci. 2014, 3(2), 1260-1266.
- Cano-Guzmán C.F.; et al. J Textile Sci Eng. 2014, 4:155. doi: 10.4172/2165-8064.1000155
CrossRef - Adikwi M.U.; Ofokansi K.C.; Attama A.A. Chem. Pharm. Bull. 1999, 47(4): 463-466.
CrossRef - Refat M.S.; Sadeek S.A. Can. J. Of anal. Sc. and spectr. 2006, 51(6): 312-322.
- fazuddin T.; Biswanath M. Proc. Indian Acad. Sci. (Chem. Sci.). 2000, 112(4): 475–485.
- Khan I.M; Ahmad A. Spectrochim. Acta, Part A. 2009, 73: 966- 971.
CrossRef - Dehghani H.; Sahba R.; Afrooz M.; Mollaei H. Journal of the Chinese Chemical Society. 2010, 57: 690-695.
CrossRef - Gao F.; Yang Y.Y. Chines Chemical Letters. 1999, 10(22): 1041-1044.
- Saeed A. A. H.; Othman S.A.W.; Al-Jhalil K. A.; Atto A. T. Can. J. Spectrosc. 1981, 2638-2645.
- Ishaad M.K.; Ahmad A.; Oves M. Spectrochim. Acta Part A. 2010, 77: 1059-1064.
CrossRef - Sajid H.; Guzar J.; Qin Han I. J. appl. Sc. 2008, 8(13): 2480- 2485.
- Al-Taiar A. H.; Shubber S.H.; Megharbi A. Turk. J. Chem. 2002, 26: 351- 355.
- Shahdousti P.; Aghamohammadi M.; Alizahed N. Spectrochim. Acta Part A, 2008, 69, 1195-1200.
CrossRef - Benesi H. A.; Hilderbrand J. H. Amer J. Chem. Soc. 1949, 71: 2703.
CrossRef - Scott R. L. Proc. Int. Conf. On Co-ordination compounds, Amsterdam 1955.
- Foster R.; Hammick D. L.; Wardley A.A. J. Chem. Soc. 1953, 3817-3820.
CrossRef - Chan R.K.; Liao S.C. Can. J. Chem. 1970, 48: 299-305.
CrossRef - Singh N.; Ahmad A. Can. J. of Anal. Sci. Spectros. 2009, 54(1): 11-22.
- Subhani M.S.; Aslam S.; Qureshi R.; Rahman A. J. Chem. Soc. Pak. 2008, 30(2):232-236.
- Absil A. C.; Buxeraud J.; Raby C. Can. J. Chem. 1984, 62: 1807- 1811.
CrossRef - Subhani M.S.; Bhatti N. K.; Mohammad M.; Khan A. Y. Turk J. Chem. 2000, 24(2): 223- 230.

This work is licensed under a Creative Commons Attribution 4.0 International License.
![]()
A New Edition of Web of Science
Journal Impact Factor
2022: 0.5
Five Year: 0.8
Journal is Indexed in

Cabells Whitelist
![]()


