Sm-Doped Tio2 Nanoparticles with High Photocatalytic Activity for ARS Dye Under Visible Light Synthesized by Ultrasonic Assisted Sol-Gel Method
V. Aware Dinkar1, S. Jadhav Shridhar2*, E. Navgire Madhukar3, E. Athare Anil2 and H. Kolhe Nitin2
1Department of Chemistry, Arts, Commerce and Science College Sonai, Tal. Newasa, Dist. Ahmednagar-414603, Affiliated to S.P. Pune University, India
2P.G. Department of Chemistry, New Arts, Commerce and Science College, Ahmednagar, 414001, Affiliated to S.P. Pune University, India
3Jijamata College of Science and Arts, Bhende, Ahmednagar 414 605, Affiliated to S.P. Pune University, India
Corresponding author email: ssjadhav1957@gmail.com
DOI : http://dx.doi.org/10.13005/ojc/320219
Article Received on :
Article Accepted on :
Article Published : 16 Apr 2016
In this article series of nano crystalline Sm-doped TiO2 nano particles with various molar concentration of samarium were synthesized by modified ultrasonic assisted sol-gel method and calcined at 500°C for 2 h. The synthesized nanomaterials were characterized in details using XRD, TEM, XPS UV–vis DRS and BET analysis. The detailed photocatalytic activity results revealed that doped samples shows excellent photodegradation efficiency towards model pollutant Alizarin red-S (ARS) and almost 93% dye degrades within 120 minutes. The highest photodegradation efficiency was noticed for 1mole % samarium doped sample at 50 mgL-1 of catalyst dose. The photocatalytic activity of synthesized nano particles were also compared with commercially available ZnO and TiO2 (Degussa, P-25) photocatalyst. It was found that synthesized nano materials showed enhanced photocatalytic efficiency than commercially available semiconducting photocatalyst.
KEYWORDS:Sm -doped TiO2 nanoparticles; modified sol-gel synthesis; photocatalyst; ARS
Download this article as:| Copy the following to cite this article: Dinkar V. A, Shridhar S. J, Madhukar E. N, Anil E. A, Nitin H. K. Sm-Doped Tio2 Nanoparticles with High Photocatalytic Activity for ARS Dye Under Visible Light Synthesized by Ultrasonic Assisted Sol-Gel Method. Orient J Chem 2016;32(2) |
| Copy the following to cite this URL: Dinkar V. A, Shridhar S. J, Madhukar E. N, Anil E. A, Nitin H. K. Sm-Doped Tio2 Nanoparticles with High Photocatalytic Activity for ARS Dye Under Visible Light Synthesized by Ultrasonic Assisted Sol-Gel Method. Orient J Chem 2016;32(2). Available from: http://www.orientjchem.org/?p=15404 |
Introduction
In recent times, heterogeneous photocatalysis is widely applied to control the environmental pollution [1-5]. The semiconducting photocatalytic materials such as TiO2, ZnO, WO3, SnO2, CuO, Cu2O, NiO and BaTiO3 play most important role for complete oxidation and removal of toxic organic waste including various types of textile dye and hazardous organic waste from aqueous phase [6-11]. Among the various semiconducting materials, titania based system has received much attention because of its high efficiency and reactivity, good chemical stability, non-toxicity and low cost [12]. However, environmental applications of titania in real life are still limited because of its wide band gap energy of photocatalytically active anatase titania (3.2 eV) and high electron-hole pair (e–/h+) recombination rate [9, 10, 13, 14]. Hence, photocatalytic applications of titania are limited to only 3-5% solar light. The tremendous efforts have been carried out to develop titania based photocatalyst that can work under visible light [15, 16] including surface modification [17-19], doping with metals [20-22] and nonmetals [23]. Moreover, doping with the transition metal ions [6, 7] has been reported as an efficient and effective method to enhance the photocatalytic activity of titania. Lanthanide occurs abundantly in nature and available at low cost than silver, still there is seldom work on the lanthanide doped with titania as an efficient photocatalyst [24-26]. Among the various lanthanides samarium doped with titania not only extends the photoresponce but also improves the separation efficiency of charge carriers. The Sm-doped TiO2 has been synthesized by various synthetic methods such as sol-gel, hydrothermal, solvothermal, sol-hydrothermal, sol-gel auto-combustion; spark discharge [27-31]. However, more efforts are required to develop an efficient photocatalyst with an excellent stability and better separation of charge carrier efficiency for efficient catalytic applications.
In this article nanocrystalline anatase Sm-doped TiO2 nano particles with high specific area using ecofriendly, surfactant template free, ultrasonic assisted modified sol–gel method with various molar concentration of Sm(0.5 – 2.0 mole % ) have been employed. The synthesized nano material’s have been characterized by various sophisticated analytical techniques and tested for the photocatalytic degradation of model pollutant Alizarin red S (ARS), widely applied in the textile industry which causes severe environmental pollution. The photocatalytic activity of synthesized nanoparticles were also compared with commercially available photocatalyst ZnO and TiO2 (Degussa, P-25) under similar experimental condition.
Experimental
Materials
All the chemicals used were of analytical grade and used as it is without further purification. Titanium (IV) butoxide (Ti (C4H9O)4) and samarium (III) nitrate hexahydrate (Sm (NO3)3 6H2O) were obtained from Sigma-Aldrich (USA). Zinc oxide (ZnO), isopropyl alcohol (CH3)2CHOH) and Alizarin red S (C.I. 58005) were purchased from S.D. Fine Chem. Ltd, India, TiO2 (Degussa, P-25) received as a gift sample and deionized water was used as a solvent throughout experiment.
Synthesis of Sm-TiO2 nanoparticles
Nanocrystalline Sm-doped TiO2 nano particles were synthesized by optimized ultrasonic wave assisted sol-gel method with use of acetic acid as a catalyst as well as solvent. Calculated quantity of Sm (NO3)3 6H2O (molar concentration 0.5, 1.0 and 2.0 mole % Smwith respective to TiO2) were dissolved in a mixture containing 10 ml glacial acetic acid and 30 ml water with constant magnetic stirring (Solution A).The required quantity of titanium butoxide was slowly added to a mixture of 15 ml isopropyl alcohol and 10 ml glacial acetic acid (Solution B). Solution A was slowly added to solution B with vigorous magnetic stirring and ultrasonically dispersed for 60 min at 40 °C The resultant clear solution was further magnetically stirred at 2000 rpm for next 4 h and then it was transferred to oven at 80 °C for next 12 h to get dry powder and finally calcined at 500°C in high temperature muffle furnace for two hours. They were labeled as 0.5% SmT, 1.0% SmT and 2.0 % SmT. The pure titania powder was synthesized using almost identical method in the absence of samarium nitrate hexahydrate in solution A (labeled as PT).
Characterization
The synthesized nanocrystalline powders were characterized by various sophisticated techniques such as X-ray diffraction (XRD) patterns recorded on a model Philips X-ray diffractometer with diffraction angle 2θ in between 20 to 80° using Cu-Kα radiation of wavelength 1.54056 Å. The microscopic nanostructure and particle size was determined by using a CM-200 PHILIPS transmission electron microscope (TEM) at 200 kV (L= 600, λ = 0.0025 nm). X-ray photoelectron spectra of the catalysts were recorded in an PHI 5000 Versaprobe-II Focus X-ray Photo-electron Spectroscopy using Al Kα (1486.6 eV) as the radiation source. The spectra were referenced to the binding energy of C 1s (285 eV).The surface area of the samples were determined from nitrogen adsorption-desorption isotherms at liquid nitrogen temperature using an Autosorb iQ Station 1, Quantachrome instrument with out gas 15 min at 150 °C UV-vis diffuse reflectance spectra (UV-vis-DRS) were recorded at room temperature in the wavelength range of 200-800 nm using Varian Carry 5000.
Evaluation of Photocatalytic Activity of the Samples
Photocatalytic activity experiment were carried out with 50 mgL-1 of catalyst powder in 100 ml aqueous ARS solution (100 ppm) using high pressure mercury lamp (125 W) with most intense peak at 546 nm as an artificial visible light source. The photocatalysis was carried out at pH = 8 and at room temperature. For better dispersion of catalyst powder into the dye solution, the mixture was ultrasonicated for 15 minutes, stirred in the dark for 30 minutes to reach adsorption-desorption equilibrium. This was placed inside the photoreactor in which the vessel was 3-4 cm away from the radiation source. The 2 ml aliquots of the mixture was taken at a periodic time interval during the irradiation and after centrifugation it was analyzed for change in the ARS concentration by using UV-vis spectrophotometer and the absorption peak at 525 nm was recorded.
Results and Discussion
X-ray diffraction studies of doped and pure TiO2
Fig. 1 shows typical XRD pattern of pure titania and Sm -doped TiO2 nano particles calcinend at 500 °C. The XRD peaks of all the synthesized samples were wide confirming nanocrystalline nature of the photocatalyst. The peak values located at 25.40º, 37.93º, 48.23º, 54.05º, 55.22º, 62.93º, 68.9º, 70.28º and 75.07º which correspond to the Miller indices (101), (004), (200), (105), (211), (204), (116), (220) and (215) respectively. All the diffraction peaks obtained from XRD agreed with the reported JCPDS card no. 21-1272 for anatase titania. In addition to above peaks a very weak diffraction peak at 27.16 º corresponds to the Miller indices (110) was recorded for pure titania, shows the presence of small rutile crystalline phase. The result obtained from XRD confirmed that the doping of samarium inhibits the phase transformation from anatase to rutile [16, 17]. Further, it was also observed that in case of doped samples no diffraction peaks corresponding to the samarium were recorded; it might be due to low dopant concentration (i.e. below the detection limits of XRD instruments). The crystallite sizes were estimated by the Scherer’s equation by using the most intense reflection (2 θ = 25.40º) and were found to be in the range of 12.8 to 19.0 nm (Table 1). The reduction in crystallite size of doped materials might be due to segregation of Sm ions at the grain boundary of titania, which retards the grain growth by controlling direct contact of titania grains [32].
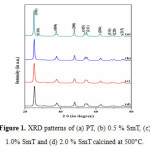 |
Figure 1: XRD patterns of (a) PT, (b) 0.5 % SmT, (c) 1.0% SmT and (d) 2.0 % Sm Tcalcined at 500°C. Click here to View figure |
Table 1: Physical Parameters Of Pure Titania And Samarium Doped Titania Measured By X–Ray Diffraction And Diffuse Reflectance Spectroscopy.
|
Sr. No. |
Photocatalyst |
Crystallite size (nm) |
Band gap (eV) |
|
PT |
19.0 |
3.05 |
|
|
0.5 % Sm-T |
18.5 |
3.02 |
|
|
1.0 % Sm-T |
12.8 |
2.92 |
|
|
2.0 % Sm-T |
14.9 |
2.98 |
Transmission electron microscopy (TEM) analysis
The detailed structural morphology and crystallite sizes were determined by using TEM and HRTEM. Fig 2(a, b) represents TEM and HRTEM images of pureTiO2 while Fig 2(c, d) represents TEM and HRTEM images of 1.0 mole % Sm-TiO2, it can be seen that synthesized nano particles are irregular shaped, with average crystallite size range from 18-20 and 12-13 nm for pure and 1.0 mole% Sm –doped TiO2 respectively. The results from TEM are in good agreement with XRD. The appearance of fringes (lattice spacing of 0.352 nm) in the HRTEM (Fig.2 b, d) confirms the highly crystalline (101) mesoporous anatase titania nano particles .
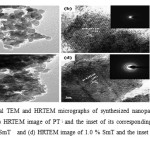 |
Figure 2: Typical TEM and HRTEM micrographs of synthesized nanoparticles: (a) TEM image of PT, (b) HRTEM image of PT; and the inset of its corresponding FFT, (C) TEM image of 1.0 % SmT and (d) HRTEM image of 1.0 % SmT and the inset of corresponding FFT Click here to View figure |
X ray photoelectron spectroscopy
XPS has been used to interpret chemical composition of the elements in the synthesized nano materials. The XPS survey spectrum (Fig. 3a) of the 1% SmT indicates the peaks of elements Ti, Sm, O, and C showing presence of Ti, O and Sm elements in the photocatalyst. The presence of small quantity of carbon may be due to the extra carbon from the parent solution. Figs. 3 (b–d) show the binding energies of O, Ti and Sm respectively. In Fig. 3b, the spin-orbit constituent (2p3/2 and 2p1/2) of Ti 2p peaks at 458.9 eV and 464.5 eV shows the exists of Ti as Ti (IV) ion and confirms doping of samarium in titania does not change the oxidation states of titania. The O1s spectrum (Fig. 3 (c)) shows two contributions at 529.9 and 531.6 eV. The peak at 529.9 eV could be ascribed to lattice oxygen in TiO2, while peak at 531.6 eV could be ascribed as an absorbed O2, absorbed H2O or OH (hydroxyl groups) on the surface of TiO2 shows the favorable condition of photodegration of organic pollutants [33]. Two well defined peaks corresponding to the binding energies at 1083.22eV and 1110 eV were also seen for Sm 3d3/2 and 3d5/2 respectively. The XPS results confirm the existence of Sm in the form of Sm2O3 in the doped photocatalyst [34].
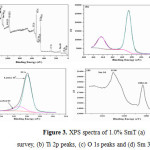 |
Figure 3: XPS spectra of 1.0% SmT (a) survey, (b) Ti 2p peaks, (c) O 1s peaks and (d) Sm 3d peaks. Click here to View figure |
BET Surface area
A systematic study on the surface area and pore structure of the synthesized nano materials were evaluated by N2 adsorption–desorption isotherm. Fig. 4(a, b) shows the nitrogen adsorption-desorption isotherm of two representative samples, pure TiO2 and 1 mole % Sm – doped TiO2, shows a type IV isotherm and according to the IUPAC classification type IV isotherm are typical for mesoporous materials. The BET surface area, pore volume and pore radius obtained from BJH method is summarized in Table 2.
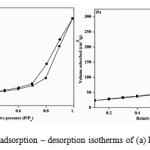 |
Figure 4: Nitrogen adsorption – desorption isotherms of (a) PT (b) 1.0 % SmT. Click here to View figure |
Table 2: Comparison of the surface area obtained from the multipoint BET method adsorption data in the P/P0 range 0.05-0.3 for PT and 1% SmT
| Sr. No. | Photocatalyst | SBET (cm2/g) | Total pore volume VP(cm3/g) | Average pore size (nm) |
| PT | 66.286 | 0.248 | 7.8 | |
| 1.0 % SmT | 101.714 | 0.460 | 18.2 |
UV–visible diffuse reflectance spectroscopy (UV–visDRS)
The UV–vis diffuses reflectance spectroscopy (Fig. 5(a–d) shows frame work of TiO2 in the samples. In all the samples, a tetrahedrally coordinated titania appears at about 330 nm. A progressive red shift in the band gap absorption is observed with samarium doping (Fig. 5 (b – d) than that pure TiO2. The absorption edges of the Sm–doped TiO2 samples are shifted to approximately 425 nm, corresponding to band gap energy of 2.92 eV for 1mole% SmT. The calculated band gap energy values of PT, 0.5 % SmT and 2.0% SmT nanoparticles are 3.05 e V, 3.02 eV, and 2.98 eV respectively (Table 1)). The decreased band gap energy of the photocatalyst with samarium doping up to certain limits can enhance the photocatalytic efficiency for the removal of organic pollutants such as ARS.
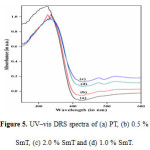 |
Figure 5: UV–vis DRS spectra of (a) PT, (b) 0.5 % SmT, (c) 2.0 % SmTand (d) 1.0 % SmT. Click here to View figure |
Photocatalytic activity Result
The photocatalytic activities of synthesized nanomaterials were evaluated by using 50 mg of catalyst powder in 100 ml aqueous ARS dye solution (100 ppm) at pH 8.0 under visible light irradiation. The activity results shows that the concentration of ARS gradually decreased with exposure of time and after 2 hours % degradation of ARS was 40%, 34.5%, 60%, 84%, 93% and 83% for ZnO, Degussa-25, PT,0.5% SmT,1%SmT and 2.0% SmT respectively(Fig.6 (a, b)). The 1% SmT photocatalyst degraded almost about 93% and shows highest photocatalytic efficiency (Fig. 6(b)). The highest photocatalytic efficiency for 1% SmT photocatalyst is due the small grain size, large surface area, inhibition of the e–/h+ recombination and the increase in the absorption of visible light as explained in the XRD and TEM, BET isotherms, XPS spectra and UV-vis DRS respectively[35].
The photocatalytic activities of synthesized nanomaterial were also compared with the commercially available photocatalyst ZnO and TiO2 (Degussa P-25) under similar experimental conditions and it was observed that all the photocatalytic materials synthesized by modified sol – gel method shows superior activity over the commercially available photocatalyst.
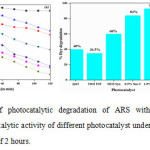 |
Figure 6: (a) Plot of photocatalytic degradation of ARS with different catalysts,(b) Comparison of photocatalytic activity of different photocatalyst under visible light irradiation for an irradiation time of 2 hours. Click here to View figure |
Comparison of photocatalytic activity of different photocatalyst under visible light irradiation for an irradiation time of 2 hours.
Plausible mechanism of Photodegradation of ARS
It very difficult to entre Sm3+ ions in to the titania lattice since ionic radius of Sm3+ ion (0.96 Å) is greater than that of Ti 4+ ion (0.68 Å). But Ti4+ ions can entre in the lattice of Sm2O3 substitutes Sm3+ ions, creates the crystal defects, charge imbalance and decrease the band gap energy of the doped titania, results in the high photocatalytic activity[31]. When Ti4+ ions are replaced by Sm3+ ions more hydroxide ions are adsorbed on the titania surface, these excess hydroxide ions are acting as hole trapping agents, which delay electron–hole recombination reaction and hence enhances the photocatalytic activity.
Possible reaction pathway for photodegradation of ARS dye:
TiO2 + hn → TiO2 (e–CB + h+VB) (1)
Sm 3+ + e–CB → Sm2+ (unstable) (2)
Sm2+ + O2 → Sm 3+ + O2• – (3)
O2 • –+ H+→•OOH (4)
•OOH + H+ + e–CB → H2O2 (5)
H2O2 + e–CB → •OH +–OH (6)
Simultaneously, near the valance band photons (h+VB) from catalyst surface transfer the charge to the absorbed water molecules and produced photoactive .OH radicals
h+VB +H2O → H+ + •OH (7)
h+VB + –OH → •OH (8)
ARS + •OH → CO2↑+H2O (9)
Thus, samarium doping on the catalyst surface helps the separation of charge carriers and hence, shows enhancement in the photocatalytic activity of modified titania.
Conclusion
The Sm-doped TiO2 nano particles have been successfully synthesized by surfactant free modified ultrasonic sol-gel method. The result from XRD and TEM confirms the formation of anatase as a dominant crystalline phase of titania. The XPS results confirm the surface doping of samarium on the titania. The photocatalytic activity results showed that all the samarium doped nanocrystalline materials shows enhanced photodegradation efficiency for ARS dye and it was also found that 1.0 mole % Sm–TiO2 shows highest photodegradation efficiency under the visible light irradiation. The small grain size, larger BET specific surface, red shifts in the band–gap transition, higher e–/h+ pair separation efficiency of samarium doped samples favors the photocatalytic efficiency.
Acknowledgements
The authors are grateful to the Principal, Arts Commerce and Science College Sonai, as well as thankful to the Principal, New Arts, Commerce and Science College Ahmednagar for providing the all required facilities to carry out the work. The authors are also thankful to the University Grants Commission, New Delhi, India, for providing the Teacher Fellowship under Faculty Improvement Programme to one of the author, D. V. Aware.
References
- Akpan, U. G.; Hameed, B. H. J. Hazard. Mater. 2009, 170, 520-529.
CrossRef - Hoffmann, M.R.; Martin, S.T.; Chow, I.; Chem. Rev. 1995, 95, 69-96.
CrossRef - Fujishima, A.; Zhang, X.; Tryk D.A. Int. J. Hydrogen Energy. 2007, 32, 2664-2672.
CrossRef - Chen, D.; Sivakumar, M.; Ray, A. K. Dev. Chem. Eng. Miner. Process. 2000, 8, 505-550.
CrossRef - Bhatkhande, D.; Pangarkar, V. G.; Beenackers, A. ACM. J. Chem. Technol. and amp; Biotechnol. 2002, 77, 102-116.
- Rauf, M. A.; Meetani, M. A.; Hisaindee, S, Desalination. 2011, 276, 13-27.
CrossRef - Sa, S. Mater. Res. Bull. 2013, 48, 250-255.
CrossRef - Zhang, X.; Song, J.; Jiao, J.; Mei, X.; Solid State Sci.2010, 12, 1215-1219.
CrossRef - Sahoo, B.; Panda, P. K. Ceram. Int. 2012, 38, 5189-5193.
CrossRef - Dodd, A. C.; Mckinley, A. J.; Saunders, M.; Tsuzuki, T. J. Nanoparticle Res. 2006, 8, 43-51.
CrossRef - Motahari, F.; Mozdianfard, M.R.; Soofiv, F. M.; Salavati–Niasari. RSC. Adv. 2014, 4, 27634-27641.
- Mills, A. Le, S. J. Photochem. Photobiol. A Chem. 1997, 108, 1-35.
- Colmenares, J. C.; Aramendía, M. A.; Marinas, A.; Marinas, J.M.; Urbano, F. J. Appl. Catal. A Gen. 2006, 306,120-127.
CrossRef - Wang, C.; Ao, Y.; Wang, P.; Hou, J. ; Qian, J.; Zhang, S. J. Hazard. Mater. 20101, 78, 517-521.
- Colmenares, J. C.; Luque, R. Chem. Soc. Rev. 2014, 43, 765-778.
CrossRef - Jo, W. K.; Kim, J. T. J. Hazard. Mater. 2009, 164, 360-366.
CrossRef - Bossmann, S. H.; Göb, S.; Siegenthaler, T.; Braun, A. M. K. T.; Ranjit, I. Willner. J. Anal. Chem. 2001, 371, 621-628.
CrossRef - Kim, S.; Kim, M.; Hwang, S. H.; Lim, S. K.; Appl. Catal., B Environ. 2012, 123(124), 391-397.
CrossRef - Qamar, M.; Drmosh, Q.; Ahmed, M. I.; Qamaruddin, M.; Yamani, Z. H.; Nanoscale Res. Lett. 2015, 10, 1 – 6.
CrossRef - De Souza, M. L.; Corio, P. ;Appl. Catal. B Environ. 2013, 136(137), 325-333.
CrossRef - Dvoranová, D.; Brezová, V.; Mazúr, M.; Malati, M. A. Appl. Catal. B Environ. 2002, 37, 91-105.
CrossRef - Österlund, L.; Štengl, V. ; Mattsson, A.; Bakardjieva, S.; Andersson, P.O.; Opluštil, F. Appl. Catal. B Environ. 2009, 88, 194 -203.
CrossRef - Yu, C.; Cai, D.; Yang, K.; Yu, J.C.; Zhou, Y.; Fan. C. J. Phys. Chem. Solids. 2010, 71, 1337-1343.
CrossRef - Xie, Y.; Yuan, C. Appl. Catal. B Environ. 2003, 46, 251-259.
CrossRef - Saif, M.; Aboul-Fotouh, S. M. K.; El-Molla, S. A.; Ibrahim, M. M.; Ismail, L.F.M. Spectrochim. Acta. A. Mol. Biomol. Spectrosc. 2014, 128, 153-162.
CrossRef - Wu, G. ; Zhang, L. ; Cheng, B.; Xie, T.; Yuan, X. J. Am. Chem. Soc. 2004,126, 5976-5977.
CrossRef - Xiao, Q.; Si, Z.; Yu, Z.; Qiu, G.; J. Alloys Compd. 2008, 450,426-431.
CrossRef - Wang, Y.; Cheng, H.; Zhang, L.; Hao, Y.; Ma, J.; Xu. B. J. Mol. Catal. A Chem. 2000, 151, 205 – 216.
CrossRef - Abdul G. K.; Thomas, J.; Musthafa, M. M.; Pradyumnan, P. P. J. Electron. Mater. 2011, 40, 2152-2158.
CrossRef - Efimov A, Sukharev V, Ivanov V, Lizunova A. Orient J Chem. 2015, 31(4), 2285-2290.
- Xu, A.-W.; Gao, Y.; Liu, H.-Q. J. Catal. 2002, 207,151-157.
CrossRef - El-Bahy, Z.M.; Ismail, A. A.; Mohamed, R.M. J Hazard Mater. 2009, 166(1), 138-143.
CrossRef - Yang, X.; Wang, S.; Sun, H.; Wang, X.; Lian, J.; Trans. Nonferrous Met. Soc. China. 2015, 25,504–509.
CrossRef - Tang, J.; Chen, X.; Liu, Y.; Gong, W.; Peng, Z.; Cai, T. Solid State Sci. 2013, 15, 129–136.
CrossRef - Sood, S.; Mehta, S.K.; Umar, A.; Kansal, S.K. New J. Chem.2014, 38, 3127-3136.
CrossRef

This work is licensed under a Creative Commons Attribution 4.0 International License.
![]()
A New Edition of Web of Science
Journal Impact Factor
2022: 0.5
Five Year: 0.8
Journal is Indexed in

Cabells Whitelist
![]()


