Photodegradation of basic dyes using nanocomposite (Ag-zinc oxide-copper oxide) and kinetic studies
Nasrin Khorshidi1, Saied Abedini Khorrami1, Mohammad Ebrahim Olya*2 and Fereshteh Mottiee1
1Department of Chemistry, Faculty of Sciences, North Tehran Branch, Islamic Azad University, Tehran, Iran.
2Department of Environmental Research, Institute for Color Science and Technology, Tehran, Iran.
Corresponding author Email: olya-me@icrc.ac.ir
DOI : http://dx.doi.org/10.13005/ojc/320247
Article Received on :
Article Accepted on :
Article Published : 06 May 2016
In this paper, Ag/ZnO/CuO nanocomposite (AZCN) synthesized and its dye degradation ability in the presence of UV irradiation from colored wastewater was studied. The characteristics of AZCN were investigated using Fourier transform infrared (FTIR), scanning electron microscope (SEM) and X-ray diffraction (XRD). The photocatalytic activity was evaluated by photodegradation of Basic Red 18 (BR18) and Basic Violet 16 (BV16) as a model contaminant. The effects of AZCN dosage, initial dye concentration and salt on dye degradation were investigated. Kinetics analysis indicated that the dye degradation rates could be approximated at pseudo-first order model. The results indicated that AZCN as a photocatalyst could be used to degrade dyes from wastewater.
KEYWORDS:Photocatalytic degradation; Nanocomposite; Basic dye; AOPs; Kinetic modeling
Download this article as:| Copy the following to cite this article: Khorshidi N, Khorrami S. A, Olya M. E, Mottiee F. Photodegradation of basic dyes using nanocomposite (Ag-zinc oxide-copper oxide) and kinetic studies. Orient J Chem 2016;32(2) |
| Copy the following to cite this URL: Khorshidi N, Khorrami S. A, Olya M. E, Mottiee F. Photodegradation of basic dyes using nanocomposite (Ag-zinc oxide-copper oxide) and kinetic studies. Orient J Chem 2016;32(2). Available from: http://www.orientjchem.org/?p=15853 |
Introduction
Adsorption, biological, filtration, coagulation and ozonation were used as common methods to treat wastewater. Each method has its advantages and disadvantages. For example, adsorption is nondestructive, since it just transfers dyes from water to another phase, thus causing secondary pollution (1,2). Consequently, regeneration of the adsorbent materials and post-treatment of solid wastes, which are expensive operations, are needed (3, 4). Due to the large degree of aromatics present in dye molecules and the stability of modern dyes, conventional biological treatment methods are ineffective for decolorization and degradation (5, 6).
Photocatalytic activity of semiconductors is well known for decomposition of pollutants in gas and liquid phases (7, 8 ). The process is begun by ultra violet or visible light irradiation on the semiconductor to excite an electron from the valence band to the conduction band that resulting to formation a high energy electron/hole pair. This pair may directly (or indirectly by generate the radicals) decompose organic compounds (Advanced Oxidation Processes, AOPs) (9, 10). The advanced oxidation processes (AOPs) is an effective process at the degradation of air, water and wastewater pollutants, especially refractory organic substances (11, 5). AOPs degrades pollutants using strong oxidants such as hydroxyl radicals (HO•). The advantages of AOPs over competing processes are: (1) complete degradation, (2) no waste disposal problem, (3) low cost and (4) only mild temperature and pressure conditions are necessary. The mechanism of heterogeneous photocatalytic degradation of dyes was investigated in detail (12, 13)
In this paper, AZCN was synthesized, characterized and its photocatalytic dye degradation ability from colored wastewater was investigated in details. Basic Red 18 (BR18) and Basic Violet 16 (BV16) were used as model dyes. The characteristics of AZCNwere investigated using Fourier transform infrared (FTIR), scanning electron microscope (SEM) and X-ray diffraction (XRD). Photocatalytic dye degradation was studied by UV-Vis spectrophotometer. The effect of AZCNdosage, initial dye concentration and salt on dye degradation was evaluated. Photocatalytic dye degradation using AZCN kinetic (zero-order, first-order and second-order) was studied.
Material and Methods
Chemicals
Basic Red 18 (BR18) and Basic Violet 16 (BV16) were obtained from Ciba and used without further purification. Fig. 1 shows the chemical structure of dyes. Other chemicals were obtained from Merck.
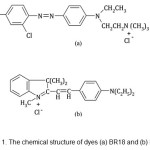 |
Figure 1: The chemical structure of dyes (a) BR18 and (b) BV16. |
Synthesize of AZCN nanocomposite
Synthesize of zinc oxide/copper oxide
ZnCl2 (0.2726 g), CuSO4.5H2O (0.2497 g) and NaOH (0.4 g) were dissolved in distilled water (30 mL). This solution was sealed and left static at 80 ○C for 24 h, and then cooled to room temperature. The final precipitate was separated by centrifuge, washed with distilled water and absolute alcohol several time to removal the possible residues and then dried at 80 ○C for 12 h (14).
Synthesize of AZCN
0.5 g silver nitrate was added to 50 mL water, heated and stirred. Then 5 g zinc oxide/copper oxide nanocomposite was added, agitated and heated at 120 ○C for 1 h. the product was calcined at 400 ○C for 4 h.
Characterization
The functional groups of the material were studied using Fourier transform infrared (FTIR) spectroscopy (Perkin-Elmer Spectrophotometer Spectrum One) in the range of 4000-450 cm−1. The morphological structure of the material was examined by scanning electron microscopy (SEM) using a LEO 1455VP scanning microscope. Crystallization behavior of nanocomposite was identified by XRD model Siemens D-5000 diffractometer with Cu Kα radiation (λ = 1.5406 A °) at room temperature.
Reactor and Photocatalytic dye degradation
Experiments were carried out in a batch mode photoreactor. The irradiation source was a UV-C lamp (200-280 nm, 9W, Philips), which was placed in the inner quartz tube of the reactor.
The photocatalytic dye degradation experiments were conducted by mixing various amounts of AZCN in photoreactor containing 800 mL of a dye solution (10 mg/L) at room temperature (25 0C). The solution samples were withdrawn from the reaction medium at regular time intervals. The AZCNwas separated from solution and the change on the absorbance at maximum wavelength (λmax) of dyes (489 nm for BR18 and 547 nm for BV16) was monitored by UV–vis spectrophotometer (Perkin-Elmer Lambda 25).
The effect of AZCNdosage on the photocatalytic dye degradation was investigated by contacting 800 mL of dye solution (10 mg/L) at room temperature (25 0C) for 4 h. Different amounts of AZCN were applied.
The effect of initial dye concentration on the photocatalytic dye degradation was studied. The AZCN (0.05 g for BV16 and 0.1 g for BR18) was added to 800 mL of different dye concentrations (10, 20, 30 and 40 mg/L).
The effect of salt on the photocatalytic dye degradation was studied. Different salts (Na2SO4, NaCl and NaHCO3) (0.02 mol) were added to 800 mL of dye solution (10 mg/L) containing AZCN (0.05 g for BV16 and 0.1 g for BR18) at room temperature (25 0C).
Results and discussion
Characterization
The FT-IR spectrum of AZCNnanocomposite was shown in Fig. 2. It has two peaks at 3450 cm−1 and 500-600 cm-1 which indicate O-H stretching vibration and metal-oxygen vibration, respectively. The peak at 1625 cm-1 was attributed to OH bending of molecular water (15).
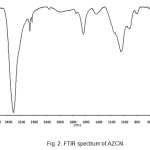 |
Figure 2: FTIR spectrum of AZCN. |
SEM has been a primary tool for characterizing the surface morphology and fundamental physical properties of material surface. It is used to determine the particle shape and appropriate size distribution of the material. The SEM micrograph of the AZCN (Fig. 3) shows a relatively homogeneous particle size distribution of AZCN.
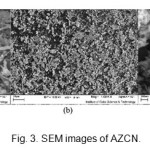 |
Figure 3: SEM images of AZCN. |
Fig. 4 illustrates the X-ray diffraction (XRD) pattern of the zinc oxide/copper oxide nanocomposite. Diffraction peaks are in good agreement with those of the standard patterns of hexagonal wurtzite ZnO (JCPDS Card No. 36-1451) and monoclinic CuO (JCPDS Card No. 05-0661). In Fig. 4, there are two sets of diffraction peaks for the zinc oxide/copper oxide nanocomposite sample, which are correspondingly ascribed to hexagonal wurtzite ZnO and monoclinic CuO, and no peaks of other phases and impurities were detected (14).
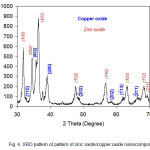 |
Figure 4: XRD pattern of pattern of zinc oxide/copper oxide nanocomposite.
|
Degradation of dyes
The UV-Vis spectra of the dyes at 200 nm ≤ λ ≤ 650 nm during the degradation process using UV/ AZCN at different time intervals were studied (Fig. 5). The result showed that the maximum absorbance in visible region of spectra decreases because chromophore of dyes is the most active sites for degradation attack.
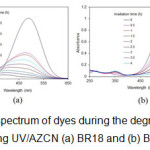 |
Figure 5: UV-Vis spectrum of dyes during the degradation process using UV/AZCN (a) BR18 and (b) BV16. |
Effect of operational parameters on dye degradation
AZCNdosage
Fig. 6 shows the effect of AZCNdosage on the photocatalytic dye degradation. The photodegradation in the absence of AZCN is 2 % and 1.5 % for BR18 and BV16, respectively. Considering that the UV alone is not effective to oxidize dyes in the colored wastewater samples, it needs to be activated by a catalyst. It is observed that the simultaneous use of AZCN with UV to a certain extent yielded a significant improvement of dye degradation compared to that of the UV degradation alone (Fig. 6).
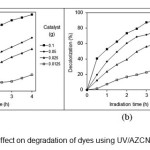 |
Figure 6: AZCN dosage effect on degradation of dyes using UV/AZCN (a) BR18 and (b) BV16.
|
AZCN is an effective photocatalyst by utilizing light energy to create e–/h+ pairs on its surface. The e–/h+ pairs are then available for degradation processes, which usually involve the formation of reactive oxygen species, such as HO● and O2●–, which then further aid in the degradation of pollutants.
The zero-order (eq. 1), first-order (eq. 2) and second-order (eq. 3) kinetics of photocatalytic dye degradation by the catalyst were studied (Table 1).
A0 – A = k0 t (1)
ln (A0/A) = k1t (2)
1/A = k2t + 1/A0 (3)
where A0 and A are the initial dye absorbance and dye absorbance at time t, respectively. The k0, k1 and k2 are the zero-order, first-order and second-order rate constants, respectively.
To introduce the
applicability of the zero-order, first-order and second-order kinetics models for photocatalytic dye degradation by the nanocomposite at different catalyst dosages, linear plots of A0 – A versus irradiation time (t) (Fig. 7), ln (A0/A) versus irradiation time (t) (Fig. 8) and 1/A against irradiation time (t) (Fig. 9) are plotted. The values of k0, k1 and k2, R2 (correlation coefficient values) are shown in Table 1.
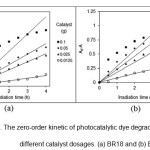 |
Figure 7: The zero-order kinetic of photocatalytic dye degradation by AZCN at different catalyst dosages. (a) BR18 and (b) BV16. |
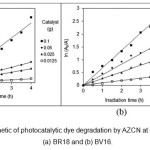 |
Figure 8: The first-order kinetic of photocatalytic dye degradation by AZCN at different catalyst dosages. (a) BR18 and (b) BV16. |
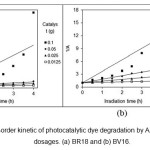 |
Figure 9: The second-order kinetic of photocatalytic dye degradation by AZCN at different catalyst dosages. (a) BR18 and (b) BV16. |
Table 1: The kinetics constants of photocatalytic dye degradation by AZCN at different catalyst dosages.
|
AZCN (g) |
zero-order kinetic |
first-order kinetic |
second-order kinetic |
|||
|
k0 |
R2 |
k1 |
R2 |
k2 |
R2 |
|
| BR18 | ||||||
|
0.1000 |
0.1398 |
0.5158 |
0.8030 |
0.9756 |
9.7496 |
0.6079 |
|
0.0500 |
0.0856 |
0.9438 |
0.2751 |
0.9944 |
0.9601 |
0.948 |
|
0.0250 |
0.0655 |
0.9821 |
0.1869 |
0.9989 |
0.5539 |
0.9747 |
|
0.0125 |
0.0213 |
0.9312 |
0.0499 |
0.9599 |
0.1173 |
0.9446 |
|
BV16 |
||||||
|
0.0500 |
0.2857 |
0.6558 |
0.6812 |
0.9874 |
2.7002 |
0.7428 |
|
0.0250 |
0.2344 |
0.8267 |
0.4120 |
0.9746 |
0.8449 |
0.9605 |
|
0.0125 |
0.1777 |
0.9425 |
0.2602 |
0.9931 |
0.4076 |
0.9789 |
|
0.0050 |
0.0782 |
0.9692 |
0.0907 |
0.9847 |
0.1063 |
0.9707 |
The results showed that the kinetics of photocatalytic dye degradation by AZCN at different catalyst dosages followed first-order kinetic model. 
Initial dye concentration
Fig. 10 presents the effect of initial dye concentration on the photocatalytic dye degradation at different time intervals. The results showed that dye degradation decreases by initial dye concentration increasing. With the increase in the dye concentration, the possible cause is the interference from intermediates formed upon degradation of the parental dye molecules. Such suppression would be more pronounced in the presence of an elevated level of degradation intermediates formed upon an increased initial dye concentration (12).
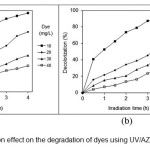 |
Figure 10: Dye concentration effect on the degradation of dyes using UV/AZCN (a) BR18 and (b) BV16. |
The results showed that the kinetics of photocatalytic dye degradation by AZCN at different catalyst dosages followed first-order kinetic model.
Initial dye concentration
Fig. 10 presents the effect of initial dye concentration on the photocatalytic dye degradation at different time intervals. The results showed that dye degradation decreases by initial dye concentration increasing. With the increase in the dye concentration, the possible cause is the interference from intermediates formed upon degradation of the parental dye molecules. Such suppression would be more pronounced in the presence of an elevated level of degradation intermediates formed upon an increased initial dye concentration (12).
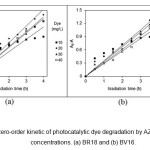 |
Figure 11: The zero-order kinetic of photocatalytic dye degradation by AZCN at different dye concentrations. (a) BR18 and (b) BV16. |
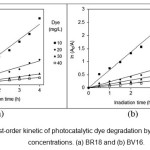 |
Figure 12: The first-order kinetic of photocatalytic dye degradation by AZCN at different dye concentrations. (a) BR18 and (b) BV16. |
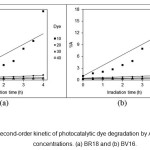 |
Figure 13: The second-order kinetic of photocatalytic dye degradation by AZCN at different dye concentrations. (a) BR18 and (b) BV16. |
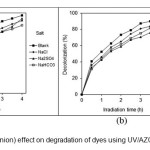 |
Figure 14: Salt (inorganic anion) effect on degradation of dyes using UV/AZCN (a) BR18 and (b) BV16. |
Table 2: The kinetics constants of photocatalytic dye degradation by AZCN at different dye concentrations
|
Dye (mg/L) |
zero-order kinetic |
first-order kinetic |
second-order kinetic |
|||
|
k0 |
R2 |
k1 |
R2 |
k2 |
R2 |
|
| BR18 | ||||||
|
10 |
0.1398 |
0.5158 |
0.803 |
0.9756 |
9.7496 |
0.6079 |
|
20 |
0.1904 |
0.8918 |
0.3157 |
0.9681 |
0.5884 |
0.8801 |
|
30 |
0.1638 |
0.9803 |
0.1459 |
0.9944 |
0.1329 |
0.9811 |
|
40 |
0.1678 |
0.9773 |
0.0985 |
0.9917 |
0.0584 |
0.9963 |
|
BV16 |
||||||
|
10 |
0.2857 |
0.6558 |
0.6812 |
0.9874 |
2.7002 |
0.7428 |
|
20 |
0.3352 |
0.9598 |
0.2245 |
0.9723 |
0.1600 |
0.9064 |
|
30 |
0.3514 |
0.9828 |
0.1446 |
0.9740 |
0.0610 |
0.9384 |
|
40 |
0.3079 |
0.9808 |
0.0875 |
0.9619 |
0.0251 |
0.9356 |
The results showed that the kinetics of photocatalytic dye degradation by AZCN at different initial dye concentrations followed first-order kinetic model.
Salt
Inorganic anions (salts) exist in wastewater. These materials may compete for the active sites on the AZCN surface or deactivate the AZCNand, subsequently, decrease the degradation rate of the target dyes. Hydroxyl radical is high reactive and non-selective radical. It reacts with non-target compounds present in the background water matrix such as dye auxiliaries in the dye bath. It causes higher HO● demand to accomplish the desired degree of degradation, or complete inhibition of advanced degradation rate and efficiency (16).
Fig. 14 shows the effect of salts on the photocatalytic dye degradation using AZCN. The anionic species could inhibit dye degradation through their scavenging effects on the HO● radicals. To generate sufficient levels of HO● for the photocatalytic dye degradation in the presence of high levels of sulfate, a higher catalyst dose should be used.
Conclusions
In this paper, AZCN was synthesized and characterized. The photocatalytic dye degradation ability of AZCN from colored textile wastewater was studied. Reactive dyes were used as model compounds. The effects of AZCNdosage, initial dye concentration and salt on photocatalytic dye degradation were evaluated. The photodegradation with UV in the absence of AZCNpresents a low performance for dye degradation from solutions (≤5). The synergistic effects of AZCNand UV were observed because of the catalytically performance of AZCNfor production of hydroxyl radicals. It can be concluded that the AZCNcould be used as a photocatalyst to degrade dyes in wastewater.
References
- Malik, P. K. J. Haz. Mat. 2004, 113, 81–88.
CrossRef - Mahmoodi. N. M. J. Mol. Catal. A: Chem. 2013, 366, 254–260.
- Yiǧitoǧlu, M; Temoçin, Z. Fibers and Polymers. 2010, 11, 996-1002.
CrossRef - Lee, H. C; Jeong, Y. G; Min, B. G; Lyoo, W. S; Lee, S. C. Fibers and Polymers. 2009, 10, 636-642.
CrossRef - Bauer, C; Jacques, P; Kalt, A. J. Photochem. Photobiol., A. 2001, 140, 80-92.
CrossRef - Mahmoodi, N. M. Fibers and Polymers. 2014, 15, 273-280.
CrossRef - Erol, F; Ozbelge, T. A. Chem. Eng. J. 2008, 139, 272-285.
CrossRef - Hui, Q; Ye, J; Li, N; Xiong, J. Fibers and Polymers. 2014, 8, 1648-1655.
CrossRef - Zhang, P; Wang, Q; Zhang, J; Li, G; Wei, Q. Fibers and Polymers. 2014, 15, 30-34.
CrossRef - El Ghali, A; Baouab, M. H; Roudesli, M. S. Fibers and Polymers. 2013, 14, 65-75.
CrossRef - Merzouka, B; Madanib, K. H; Sekki, A. Using electrocoagulation–electroflotation technology to treat synthetic solution and textile wastewater, two case studies. Desalination. 2010, 250, 573-577.
CrossRef - Konstantinou, I. K; Albanis, T. A. Kinetic and Mechanistic Investigations. Applied Catalysis B: Environmental. 2004, 49, 1-14.
CrossRef - Mahmoodi, N. M; Abdi, J; Bastani, D. Journal of Environmental Health Science and Engineering. 2013, 48, 4255-4267.
- Li, B. X; Wang, Y. F. Facile synthesis and photocatalytic activity of ZnO-CuO nanocomposite. Superlattice Microst. 2010, 47, 615–623.
CrossRef - Pavia, D. L; Lampman, G. M; Kaiz, G. S. Introduction to Spectroscopy: A guide for Students of Organic Chemistry, WB. Saunders, Philadelphia (1987).
- Alaton, I. A. Coloration Technol. 2003, 119, 345-353.
CrossRef

This work is licensed under a Creative Commons Attribution 4.0 International License.
![]()
A New Edition of Web of Science
Journal Impact Factor
2022: 0.5
Five Year: 0.8
Journal is Indexed in

Cabells Whitelist
![]()


