Impedance Spectroscopy Study of the AC Conductivity and Dielectric properties of 3, 5-Dimethylpyridine-Iodine Charge Transfer Complex
1Department of Chemistry, D.H.S.K. College, Dibrugarh, Assam, India
2Department of Chemistry, Tinsukia College, Tinsukia, Assam, India
3Department of Chemistry, Dibrugarh University, Dibrugarh,Assam, India.
Corresponding author email: uttamohan@rediffmail.com
DOI : http://dx.doi.org/10.13005/ojc/320226
Download this article as:
![]()
Solid charge transfer complex of n-donor 3, 5-dimethylpyridine (3, 5-Lutidine) with σ acceptor iodine was prepared and characterised by using elemental analysis, UV-Vis, FTIR, 1H NMR spectroscopy and powder XRD techniques. The electrical parameters of the prepared complex in the pellet form were studied at various temperatures and at wide frequency range by employing AC complex impedance spectroscopic technique. The Nyquist (cole-cole) plots have been successfully explained by employing (RC)(RC)(RC) equivalent circuit corresponding to grain , grain boundary and electrode contributions. The radii of the semicircular arc decrease with increase in temperature which suggests that the material exhibits negative temperature coefficient of resistance (NTCR) behaviour like semiconductors. Dielectric constant, ɛ′ and dielectric loss, ɛ″ seems to decrease sharply with increase in frequency. The ac conductivity obeys the power law of frequency.
KEYWORDS:Charge-Transfer complex; Impedance spectroscopy; Dielectric properties
Introduction
Charge transfer (CT) or Donor-acceptor complexes are the most important and vastly studied organic species due to their unusual electrical, magnetic and optical properties1. In 1973, the CT complex TTF-TCNQ was reported as organic metal2 and after that organic CT complexes have been greatly attracted the attention of researchers for several decades, aimed mainly at the discovery of materials with good electrical conductivity or even room temperature superconductivity3. Recently attention has been turned to technologically relevant properties of CT complexes due to their potential in the development of electronic and optoelectronic devices4.
Electrical conduction property of a donor-acceptor complex is mainly influenced by (a) electronic structure of the complex and (b) molecular orientation (segregated stacking and mixed stacking) within the molecular assembly5. The electronic structure of a complex, (D+δ)(A-δ) between the electron donor (D) and the electron acceptor (A), where δ is the degree of charge transfer from D to A, is primarily determined by the ionization potential (Ip) of D and electron affinity (Ea) of A. If Ea > Ip, then neutral electronic ground state of δ = 0 is observed whereas the completely ionic state corresponds to δ = 1 is obtained when Ea < Ip. Both neutral and completely ionic CT complexes are insulators due to small number of current carriers in (D0)(A0) and large on-site coulomb repulsive energies in (D+1)(A-1) complexes. Few CT complexes exhibited metallic electrical conduction4 whose δ values ranges from 0.50 to 0.74. For example (TTF+0.59)(TCNQ-0.59) is metallic conductor2 with conductivity value 700 Scm-1. It is reported6 that mixed-valence CT complexes with segregated-stack structures generally exhibit metallic electrical conduction; otherwise alternating stack CT complexes are either semiconductor or insulator.
Similar to inorganic semiconductors, the conduction mechanism of organic CT complexes has been reported7 in the light of band theory. To understand the transport mechanisms in a charge transfer complex their structural studies are of utmost important. Several structural informations can be revealed from the dielectric properties study8 of the CT materials which indeed, can be useful for the understanding of conduction mechanism in these materials. Besides, the origin as well as the nature of the various losses happening in these materials can be predictable from the study of frequency and temperature dependence of dielectric parameters, particularly in the range of frequency where the dielectric dispersion occurs.
Complex impedance spectroscopy (CIS) is a powerful technique to analyze the electrical properties of material having low conductivity. This technique involves the separation of grain, grain-boundary and grain-electrode effect, determination of relaxation frequency and measurement of real and imaginary part of impedance for a wide range of frequency9. Studies in many aspects including electrical conductivity of charge transfer complex of pyridine analogue with halogens and interhalogens have been reported in literatures10, 11. However detailed study of frequency dependence AC conductivity and complex impedance spectroscopy of this important class of compounds are unexplored. The aim of the present study is to investigate the electrical properties of CT complex between 3, 5-dimethylpyridine with iodine using CIS.
Experimental
Materials
3, 5- dimethylpyridine (98+%) purchased from Aldrich Chemical Co., was used without further purification Iodine from Ranbaxy fine chemical Ltd., was purified by resublimation. Hexane (Merck) was used after distillation as a solvent.
Synthesis and Characterization of Complexes:
The solid CT complex of 3, 5- dimethylpyridine with Iodine was prepared by stirring equimolar quantities of the donor with acceptor in hexane, which on keeping for overnight resulted in precipitation of the complex as dark green solid. The separated solid was filtered and washed several times with minimum amount of hexane and dried under vacuum over anhydrous calcium chloride. The complex is characterised by routine technique like elemental analysis, powder XRD, 1H NMR, UV-Vis and FTIR spectroscopy.
The elemental analysis of Carbon, Hydrogen and Nitrogen content were performed by using Perkin Elmer CHN 2400 Series II. The total halogen contents were estimated by simple gravimetric method with AgNO3 solution. The electronic absorption spectra of the donor, acceptor and the resulting complex in a suitable solvent were recorded over a wavelength range of 200-900 nm using Shimatzu U-3900 spectrophotometer. The FT-IR spectra were recorded on a Shimadzu FT-IR spectrophotometer (IRPrestige-21) within the range of 4000-250 cm-1. The 1H-NMR spectra are recorded in CDCl3 solvent. Powder XRD analysis was carried out at room temperature by using Co radiation (λ = 1.7902Å) in the range 2° ≤ 2θ ≤ 70° at a scanning rate of 1°/min and step height of 0.05°.
Measurement of electrical properties
For measurement of electrical properties, the solid complex was pressed under 10 tons press by using a hydraulic press into disc type pellets of 13 mm diameter and the thickness were measured with a screw gauge. The thicknesses of the pellets are in the range of 0.5mm to 1mm. Graphite pasting was applied on the opposite faces of the pellet and is sandwiched between two thin, flat polished sheets of copper electrodes. AC conductance( G), impedance(Z), phase angle (θ), tangent loss (tan δ) and capacitance(Cp) were measured as a function of frequency, at different temperatures by using LCR HiTester (HIOKI 3522 frequency response analyzer) in the frequency range 10 Hz to 100 kHz. The impedance spectra were modelled as an ‘equivalent circuit’ by using MEIS 3.0 software12 that uses LEVM fitting engine developed by James Ross Macdonald. LEVM is based on Complex Nonlinear Least Squares Method viz.; Levenberg-Marquardt Algorithm. The best fitted equivalent circuit has been determined by observing the coherence between the experimental and the simulated data in the complex impedance plots.
Results and Discussion
Elemental analysis
Elemental analyses data (C, H, N and total halogen) of the complex were performed and the obtained results are as follows;
C7H9N:I2 , Mol. Wt. 360.81; Melting point = 96⁰C; Calc. : % C, 23.28; % H, 2.49; % N, 3.88; % Halogen, 70.35; Found: % C, 24.03; % H, 2.54; % N, 3.08, % Halogen, 71.12.
It has been observed that the experimental values agree quite well with the calculated values for 1: 1 complex.
UV-Vis spectroscopy
The electronic absorption spectra of the donor, acceptor and the resulting complex in hexane were recorded over a wavelength range of 200-900 nm. The additional absorption band at λmax= 432nm indicates the formation of CT complex. (Figure 1)
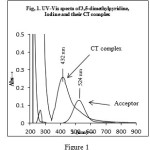 |
Figure 1 Click here to View figure |
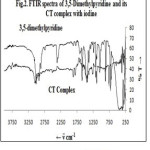 |
Figure 2 Click here to View figure |
FTIR Spectroscopy
Due to complex formation few selected IR frequencies of the donor are affected in both intensities and wave number values as shown in the FT-IR spectra of the solid CT complex and the donor in figure 2. This could be interpreted on the basis of expected electronic environment change upon complexation. The detailed vibrational assignments were reported in Table 1. These were in accordance with earlier works13, 14.
Table 1: FTIR Band Assignments of The Donor and The Complex
| Donor (cm-1) | Complex | Assignment |
| 3020 s | 3049 s | C–H stretching |
| 2980 s | 3014 s | C–H stretching |
| 2920 s | 2960 vw | C–H (-CH3) stretching |
| 2866 m | 2900 m | C–H (-CH3) stretching |
| 1860 vw | 1865 w | First overtone of C–H vibration |
| 1792 vw | 1805 w | First overtone of C–H vibration |
| 1585 s | 1593 s | C=N stretching |
| 1458 m | 1466 vw | C=C stretching |
| 1427 s | 1442 s | C=C stretching |
| 1381m | 1384 m | Antisym. & Sym. CH3 deformation |
| 1234 w | 1267 w | |
| 1166 s | 1170 m | The C–H in-plane bending vibrations |
| 1141 m | 1141 s | C–N stretching |
| 1039 s | 1047 m | C–C deformation |
| 858 s | 869 s | C-H torsion |
| 713 s | 759 s | C–H out of- plane bending vibrations |
It is observed that the spectra of 3, 5- dimethylpyridine-iodine complex shows all the principal features for free donor. Many modes of 3, 5- dimethylpyridine on complex formation have shifted to higher frequency in comparison to the free donor. Similar upward shifts were observed for metal coordinated pyridine15 and metal coordinated pyridine analogues16, 17, 18. The upward shift may be due to coupling of the internal vibrations of the donor molecule with the N-I stretching vibration similar to metal-nitrogen bond as was in metal coordinated pyridine and its analogues. Thus, the vibrational spectra of the CT complex give the direct evidence that the 3, 5-dimethylpyridine molecules coordinated with the iodine through nitrogen atom.
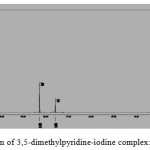 |
Figure 3: 1H NMR spectrum of 3,5-dimethylpyridine-iodine complex: Click here to View figure |
1H-NMR Spectra
The 1H-NMR (CDCl3) spectrum of 3, 5-dimethylpyridine-iodine gave three distinct signals at δ=2.37 (s, 6H, -CH3 protons), δ=7.61 (s, 1H, γ- ring proton), δ=8.30 (s, 2H, α-ring protons). The corresponding signals in the free donor (3, 5-dimethylpyridine) are at δ=2.31, 7.63 and 8.39 respectively. The signals due to protons of pyridine ring at α- & γ- positions were upfield which are due to the increase of the shielding of these protons as well as of the change of the magnetic environment on complex formation. The observed shifting of the chemical shifts values of the ring protons of pyridine is governed by two factors; (a) magnetic anisotropy of the N atom and (b) field associated with the nitrogen atomic dipole19. The displacement is more pronounced for the α- protons as these carbons are directly connected with the n-donor nitrogen atom. The signal of the methyl protons shifted to downfield on complexation which can be interpreted in terms of inductive effect20.
Powder XRD Analysis
The powder XRD spectrum of CT Complex of 3,5- dimethylpyridine and iodine [Fig. 4] gave peaks at 2θ= 13.95°, 21.9°, 22.53°, 24.75°,25.10°, 26.65°, 27.30°, 29.60°, 33.10°, 33.60°and 34.10°corresponding to the new compound formed and indicating semi-crystalline structure of the complex21. The average grain size (D) of the sample was calculated from the most intense x-ray diffraction peak by using the classical Scherer22 formula –
![]()
where λ is the x-ray wavelength (for Co radiation λ = 1.7902 Å), K is a constant (0.94 for Co grid), θ is the Bragg diffraction angle (half the scattering angle) and β is the full-width at half-maximum (FWHM) in radians of the main peak. The particle size of the material was found to be about 7.2 nm (2θ= 22.53°, β=.238 and d=4.575). This value confirms that the particles of the complex are located within the nanoscale range.
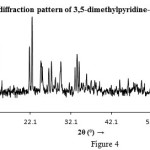 |
Figure 4 Click here to View figure |
Impedance Studies
Figure 5 shows the Nyquist plot for 3, 5- dimethylpyridine -Iodine complex over a wide frequency range and at several temperatures. The impedance spectrum of the complex under investigation is characterised by the appearance of a depressed semicircle whose radii decreases with the rise in temperature. In general we expect three semicircular arcs corresponds to the grain (bulk), grain boundary and electrode contributions. It is also seen that the semicircles at all temperatures are somewhat depressed instead of having centres on the real axis. The reasons for such non-Debye type23 behaviour may be due to the distribution of relaxation times within the bulk material24 and distortion due to other relaxations25. The best fitted equivalent circuit for the material is composed of a series combination of three RC elements (fig 5a). The typical fitting results at various temperatures are illustrated in table 2. The standard deviations less than 0.05 confirm the validity of the proposed equivalent circuit. The high frequency RC element corresponds to the grain; the medium frequency corresponds to grain boundary and the low frequency corresponds to electrode contributions. Three distinct semicircular arcs are not seen as the value of bulk, electrode and grain boundary contributions are not far away. Hence the semicircular pattern in the Nyquist plot is due to the cascading effect of the three contributions.
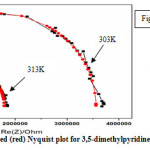 |
Figure 5: Experimental (black) and Simulated (red) Nyquist plot for 3,5-dimethylpyridine-Iodine Click here to View figure |
The electrical conductivity (σi) is calculated by using the equation –
![]()
where t is the thickness, A is the area of the pellet and Ri is the resistance obtain from simulated data. It is seen that the total resistance, Rtotal obtained from the intercept of the semicircle on the low frequency side of the real axis (Z′) follows the relation; Rg + Rgb +Rel = Rtotal ,which once again confirms the validity of our proposed equivalent circuit. Figure 6 show that σi follows the well known Arrhenius relationship –
![]()
The activation energy of conduction Ea is calculated from the slope of the logσi versus 1000/T curves and the values are Ea (g) = 0.51eV, Ea (gb) = 0.80eV, Ea (el) = 0.98eV and Ea (total) = 0.82eV.
Table 2: Simulated data of the electrical parameters for the proposed equivalent circuit
|
T (K) |
Rg (Ω-1) |
Cg (F) |
Rgb (Ω-1) |
Cgb (F) |
Rel (Ω-1) |
Cel (F) |
Σ Ri |
|
303 |
1.00 x 10⁵ |
3.27 x 10⁻¹¹ |
2.43 x 10⁶ |
2.62 x 10⁻¹¹ |
1.03 x 10⁶ |
1.88 x 10⁻¹⁰ |
3.56 x 10⁶ |
|
313 |
8.37 x 10⁴ |
3.14 x 10⁻¹¹ |
1.38 x 10⁶ |
2.65 x 10⁻¹¹ |
3.23 x 10⁵ |
3.79 x 10⁻¹⁰ |
1.79 x 10⁶ |
|
323 |
2.57 x 10⁴ |
2.97 x 10⁻¹¹ |
4.65 x 10⁵ |
4.43 x 10⁻¹¹ |
1.51 x 10⁵ |
4.39 x 10⁻¹¹ |
6.41 x 10⁵ |
|
333 |
2.09 x 10⁴ |
1.88 x 10⁻¹¹ |
1.61 x 10⁵ |
2.93 x 10⁻¹¹ |
2.99 x 10⁴ |
1.07 x 10-09 |
2.12 x 10⁵ |
Table 3: Electrical parameters of 3, 5-dimethylpyridine-iodine complex
|
T (K) |
conductivity(Ω-1cm-1) |
Relaxation time, τ (s) |
|||||
|
σg |
σgb |
σel |
σtotal |
τ (g) |
τ (gb) |
τ (el) |
|
|
303 |
1.42 x 10⁻⁶ |
5.84 x 10⁻⁸ |
1.39 x 10⁻⁷ |
3.40 x 10⁻⁸ |
3.27 x 10⁻⁶ |
6.38 x 10⁻⁵ |
2.69 x 10⁻⁵ |
|
313 |
1.70 x 10⁻⁶ |
1.03 x 10⁻⁷ |
4.40 x 10⁻⁷ |
7.95 x 10⁻⁸ |
2.63 x 10⁻⁶ |
3.67 x 10⁻⁵ |
8.57 x 10⁻⁶ |
|
323 |
5.52 x 10⁻⁶ |
3.06 x 10⁻⁷ |
9.43 x 10⁻⁷ |
2.22 x 10⁻⁷ |
7.65 x 10⁻⁷ |
2.06 x 10⁻⁵ |
6.68 x 10⁻⁶ |
|
333 |
6.80 x 10⁻⁶ |
8.81 x 10⁻⁷ |
4.76 x 10⁻⁶ |
6.71 x 10⁻⁷ |
3.94 x 10⁻⁷ |
4.72 x 10⁻⁶ |
8.74 x 10⁻⁷ |
Figure 7 shows the variation of real part of impedance (Z′) with ac frequency at various temperatures. It is observed that real Z′ value decreases with the increase in frequency for different temperature and at higher frequencies the values of Z′ merges for all the temperatures. The merging of Z′ values in the higher frequency region may be an indication of the release of polarization effect26. In the lower frequency region, the Z′ value decreases with the rise in temperature. Hence, the material exhibits negative temperature coefficient of resistance (NTCR)behaviour like semiconductors. The effect of increasing frequency and temperature is to reduce the barrier potential of the material which is consequently responsible for the enhancement of AC conductivity.
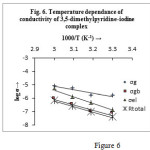 |
Figure 6 Click here to View figure |
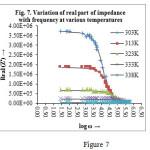 |
Figure 7 Click here to View figure |
The variation of imaginary part of impedance (Z″) with ac frequency at various temperatures is shown in figure 7(a). It is observed that with rise in frequency the Z″ value increases first reach a maximum peak Z″max and decreases again. Although the peaking behaviour indicates the single relaxation process, the relatively narrow peak at 303K just indicates a narrow distribution of relaxation times in the system. The progressive broadening of this peak upon heating reveals that this distribution gradually becomes wider. It is also observed that the value of Z″ decreases with temperature and the effect being more distinct at the peak position. With rise in temperature the peak i.e. value of Z″max shifted to the right. This observation indicates that many relaxation mechanisms are present in the CT material one of them is the temperature dependent electrical relaxation phenomenon indicated by the asymmetric peaks pattern27.
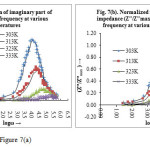 |
Figure 7a Click here to View figure |
The variation of (Z″/Z″ max) with frequency at various temperatures is shown in figure 7(b). It is seen that there is a peak at each temperature with a somewhat asymmetric broadening and the broadening increases as temperature increases. The peak broadening suggests that there are various electrical processes with a distribution of relaxation times28.
The relaxation time (τ) was calculated by using the relation9 –
![]()
From table 3, it is seen that with increasing temperature the value of relaxation time (τ) decreases, which indicates the semiconducting behaviour of the material. Further, like conductivity, relaxation times also follows the Arrhenius equation with activation energy Ea (τg) = 0.66eV, Ea (τgb) = 0.72eV, Ea (τel) = 0.94eV. (Fig. 8)
![]()
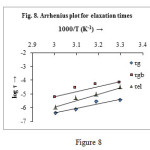 |
Figure 8 Click here to View figure |
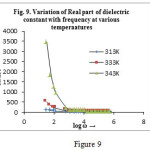 |
Figure 9Click here to View figure |
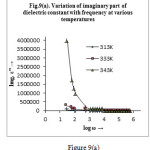 |
Figure 9a Click here to View figure |
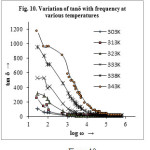 |
Figure 10 Click here to View figure |
Dielectric Properties
Figure 9 depicts the variation of real part of permittivity (i.e. dielectric constant,ɛ′) with frequency at various temperatures. Figure 9(a) shows the variation of imaginary part of permittivity (i.e. dielectric loss, ɛ″) with frequency at various temperatures. It is observed that both dielectric constant and dielectric loss decreases sharply with the increase in frequency in the low frequency region and remains almost constant at higher frequencies for all temperatures under investigation. No any anomalous behaviour or peaking behaviour is seen in the sample. The observed behaviour can be best explained in the light of space charge polarization and hopping model29. The decrease of the value of ɛ′ with increase in frequency is a typical characteristic of the polar dielectrics30. All types of polarizations contribute in the low frequency region giving higher value of ɛ′ but as the frequency is increased, contributions from the polarizations with large relaxation times cease resulting in the decrease in ɛ′. Both εʹand εʺ increases towards low frequencies reaching extremely high values that reflects the electrode-sample interface polarization effect which are further confirmed by the well-defined dc regime of the logσ variation with logω (fig.11). A many fold increase in the value of ɛ′ has been observed for the sample at higher temperature. Therefore the dipolar and interfacial polarizations are present in the sample as these are strongly temperature dependent and occur prominently at low frequency region. The dispersion in the low frequency region can be attributed due to space-charge effect41. The high value of dielectric constant in the lower frequency region is due to the accumulation of charges at the electrode-sample interface giving a large bulk polarization of the material. As frequency increases the polarization decreases and attains a constant value. In high frequency region the dipoles cannot be able to follow changes of the field causing faster polarization leading to decrease even zero value of ɛ′.
The variation of tangent loss (tan δ) with frequency at different temperatures for the sample is shown in fig 10. At lower frequencies tan δ has a less prominent peak and after that the value of tan δ decreases rapidly with rise in temperature. Since the higher frequency region corresponds to low resistivity (due to grain) a small energy is required for the current carriers to flow and therefore low value of tan δ. It is further observed that the tanδ peak shifts to higher frequency value with the increase in temperature. The observation of tanδ peak at low frequency region where the conductivity is dominated by DC conduction indicates that the losses are mainly by conduction.
With the help of Wagner theory29 the observed variation of dielectric loss (ɛ” and tan δ) with frequency and temperature can be explained. The Wagner theory is based on the assumption that the dielectric material consists of conducting particles (grain) loosely distributed throughout a non-conducting, low-loss matrix. The applied external electric field causes interfacial polarization to the material. Beside temperature and frequency (of applied alternating electric field) the size, shape and orientation of the conducting particles has a decided effect on the dielectric loss. The loss factor is directly proportional to the volume percent of the conducting particles. If all the particles have the same conductivity, there will be a sharp loss maximum at a particular frequency. The presence of even very small quantities of a conducting material such as water can cause high dielectric losses. In general, increase in temperature tends to shorten the relaxation time, so the maximum (peak) dielectric loss becomes smaller and shifts to higher frequencies32. The effect of various shapes of conducting particles in non-conducting matrix upon the loss tangent in order of increasing loss tangent are flattened spheroids, spherical particles, elongated needle-like particles, and the concentric structure in which the conducting portion and the non-conducting portion in parallel8.
Since, at lower frequencies, interfacial polarization and ionic conductance cause appreciable dielectric loss33 the high dielectric loss value in the lower frequency region is due to the ionic conduction. Similar mixed ionic-electronic conduction in CT complexes has been reported earlier5, 34, 35. The higher loss at low frequencies is partly due to traces of moisture in the CT material. Absorbed water may get ionized which results in higher dielectric losses from interfacial polarization and ionic conductance. Similar pattern of the tan δ vs frequency plot as those in fig.10 has been observed by Sillars10 for concentric structure; hence the structure of our CT material might be that of the conducting particles extending entirely throughout the non-conducting matrix so that the two portions form a parallel circuit. An increase in temperature particularly increases the dielectric losses probably because of high ionic conductance (ionization of the CT complex and absorbed moisture providing the necessary ions). Another cause for the high value of dielectric loss may be due to defects. Imperfection of the material increases at higher temperature and consequently the value of tan δ increases11.
AC Conductivity study
The variation of AC conductivity with frequency at different temperatures can be understood from the figure 11.
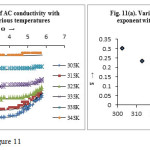 |
Figure 11 Click here to View figure |
It is seen that AC conductivity increases with the increase in temperature for all frequencies which is attributed to thermal activation. At low frequencies conductivity is nearly frequency independent and in the higher frequency region, dispersion in conductivity has been observed. This pattern was attributed to non-relaxor behaviour of the material36. The dispersion is more prominent at lower temperature. These observations can be best explained by using the Jonscher’s universal power law37 –
σac (ω) = σ dc + Aωs ————– (6)
where, σac (ω) is the AC conductivity, σ dc is the DC conductivity independent of frequency, ω is the angular frequency which equals to ω = 2πf, A is a constant and S is the frequency exponent having values between 0 and 1. The frequency exponent S can be obtained from the slope of the plot between logσ versus logω and the intercept of the horizontal portion on the vertical axis equals to logσdc. It is obvious that the value of S decreases with the rise of temperature as shown in figure 11(a). The AC conduction mechanism is considered to be due to barrier hopping38, 39. According to this model S can be expressed as-
![]()
where wH is the barrier height or optical band gap which can be calculated by substituting the value of S, KB and T. It is seen that the value of optical band gap (or binding energy of charge carriers) is 0.22 to 0.18 eV for the tested temperature range.
Conclusions
Elemental analysis reveals that 3,5-dimethylpyridine form solid 1:1 CT complex with iodine. Complex impedance analysis indicates the grains, grain boundaries and electrode are responsible in the conduction mechanism of the CT complex. Thus the electrical property of the material is described by three parallel RgCg , RgbCgb and RelCel elements connected in series. The conductivities of the CT complex pellet follow the Arrhenius law with activation energy 0.51eV, 0.80eV, 0.98eV and 0.82eV for grain, grain boundary, electrode and total conductivity respectively. The complex shows negative temperature coefficient of resistance (NTCR) behaviour and exhibit temperature dependence relaxation phenomenon. The relaxation is found to be of non-Debye type and the relaxation time (τ) decreases with increasing temperature and obey the Arrhenius law. Dielectric constant, ɛ′ and dielectric loss, ɛ″ decreases sharply with increase in frequency and increases with rise in temperature. The high value of dielectric loss tangent may be the result of ionization of the complex. The frequency dependence AC conductivity follows the Jonscher’s universal power law.
Acknowledgements
This work was supported by the U.G.C., NERO under FIP Grant. The authors are thankful to Sudarsan Gogoi, Tezpur University for simulating the impedance data.
References
- Ulanski, J. Synth. Met. 1990, 39, 13-24. DOI.10.1016/0379-6779 (90)90195-Q
- John Ferraris, D.O.; Cowan, V.; Walatka, Jr.; Perlstein, J.H. J. Am. Chem. Soc. 1973, 95, 948-949. DOI: 10.1021/ja00784a066
CrossRef
- Coleman, L.B.;Cohen, MJ.; Sandman, D.J.; Yamagishi F.G.; Garito A.F.; Heeger A.J. Sol. State Commun. 1973, 12, 1125 – 1132.
CrossRef
- Jurchescu, O.D.; Goetz, K.P.; Vermeulen, D.; Payne M.E.; Kloc C.; McNeil, L.E. J. Mater. Chem. C. 2014, 2, 3065-3076. DOI: 10.1039/c3tc32062f
CrossRef
- Akamatu, H.; Inokuchi, H.; Matsunaga, Y. Nature, 1954,173, 168-169. DOI:10.1038/173168a0
CrossRef
- Saito, G.; Murata, T. Phil. Trans. R. Soc. A. 2008, 366, 139-150. DOI: 10.1098/rsta.2007.2146
CrossRef
- Boumedjout, M.; Bendjeddou, A.; Abbaz,T.; Sihamtiaouianine; Kaboub, L.; Gouasmia, A.; Villemin, D.; Oriental Journal of Chemistry, 2015, 31(4),1887-1895. DOI: 10.13005/ojc/310405
CrossRef - Sillars, R.W.Electrical Engineers, Journal of the Institution of. 1937, 80(484), 378-394. DOI: 10.1049/jiee1.1937.0058
- Barsoukov, E.; Macdonald, J.R.; editors. Impedance Sprectroscopy: Theory, Experiment, and Applications, 2005, 2nd ed. Wiley-Interscience, New York.
CrossRef
- Foster, R. Organic Charge transfer complexes, 1969, Academic Press, London.
- Gur’yanova, E.N.; Gol’dshtein, I.P.; Romm, I.P.; Donor-Acceptor Bond, 1975, Keter Publishing House, Jerusalem.
- MEISP, March, 2002. Kumho Chemical Laboratories, Korea.
- Vennila, P.; Govindaraju, M.; Venkatesh, G. Elixir Vib. Spec. 2013, 65B, 20204-20211.
- Marcos, J.I.; Oter, J.C.; Tocon, I.L.; Arenas, J.F. Journal of Molecular Structure, 1999, 476, 139–150.
- Topaqli, A.; Bayan, S.; Spectroscopy letters. 1996, 29(2), 277-291. DOI:10.1080/00387019608001602
CrossRef - Kantarci, Z.; Bayrak, C.; Bayari, S.; J.Mol.Struct. 1997, 407, 155-163. DOI: 10.1016/S0022-2860(96)09739-6
CrossRef
- Bayari, S.; Topaqli, A.; Aydinli, A. The Spectroscopy Letts. 1994, 27(9), 1083-1096. DOI:10.1080/00387019408006967
CrossRef
- Akyuz, S.; Pasaoglu, H.; Davies, J.E.D. J. Mol. Struct. 1994, 317, 215-221. DOI:10.1016/00222860(93)07851M
- Gil, V.M.S.; Murrel, J.N. Trans. Faraday Soc. 1964, 60, 248-255. DOI: 10.1039/TF9646000248
CrossRef
- Baruah, S.K.; Baruah, P.K. Asian J. Chem. 2004, 16(2), 688-694.
- Rzokee, A.A.; Ahmad, A. Journal of molecular Structure, 2014, 1076, 453–460. DOI:10.1016/j.molstruc.2014.08.002
CrossRef
- Alexaner, L.; Klug, H.P. Journal of Applied Physics, 1950, 21, 137-142. DOI: 10.1063/1.1699612
CrossRef
- Suman, C.K.; Prasad, K.; Choudhary, R.N.P. Indian Journal of Engineering & Materials Sciences, 2008, 15, 157-162.
- Barde, R.V.; Nemade, R.K.; Waghuley, S.A. Journal of Asian Ceramic Societies, 2015, 3, 116-122. DOI:10.1016/j.jascer.2014.11.006
CrossRef
- Hafidi, E.; El Omari, M.; El.Omari, M.; Bentayeb, A. Bennazha, J. El Maadi, A. Chehbouni M. Arabian Journal of Chemistry, 2013, 6, 253–263. DOI: 10.1016/j.arabjc.2011.01.028
CrossRef
- Plocharski, J.; Wieczoreck, W. Solid State Ionics, 1988, 28-30, 979-982. DOI:10.1016/0167-2738(88)90315-3
CrossRef
- Suman, C.K.; Prasad, K.; Choudhary, R.N.P.; Adv. Appl. Ceram. 2005, 104, 294-299. DOI:10.1179/174367605X62580
CrossRef
- Suman, C.K.; Prasad, K.; Choudhary, R.N.P. J. Mater. Sci. 2006, 41, 369-375. DOI: 10.1007/s10853-005-2620-5
CrossRef
- Jianjun, L.; Duan, CG.;Yin, WG.; Mei, W.N.; Smith R.W.; Hardy, John R. Physical Review B. 2004, 70, 144106(1-7). DOI: 10.1103/PhysRevB.70.144106
CrossRef
- Singh, N.K.;Kumar, P.; Kumar, A.; Sharma, S. Journal of Engineering and Technology Research, 2012, 4(6), 104-113. DOI: 10.5897/JETR12.002
- Shirsath, S.E.; Jadhav, S.S.; Toksha, B.G.; Patange S.M.; Jadhav, K.M. Scr. Mater. 2011, 64, 773-776. DOI:10.1016/j.scriptamat.2010.12.043
CrossRef
- Stoops, W.N. J. Am. Chem. Soc. 1934, 56(7), 1480–1483. DOI: 10.1021/ja01322a011
CrossRef
- Hazen, T.; Wangsgard, P.; J. Electrochem. Soc. 1946, 90(1), 361-375. DOI: 10.1149/1.3071752
CrossRef
- Nishizaki, S.; Kusakawa, H.; Bull. Chem. Soc. Jpn. 1963, 36, 1681-1683.
CrossRef
- Singh, R.A.; Singh, V,K.; 1997. Bull. Mater. Sci. 1997, 20(3), 305-315.
CrossRef
- Naceur, H.; Megriche, A.; El Maaoui, M.; Oriental Journal of Chemistry, 2013, 29(3), 937-944. DOI: 10.13005/ojc/290311
CrossRef - Jonscher, A.K. Nature, 1977, 267, 673-679. DOI:10.1038/267673a0
CrossRef
- Elliott, S.R. Philos.Mag. 1977, 36, 1291-1304. DOI:10.1080/14786437708238517
CrossRef
- Ali, A.A.; Shaaban, M.H.; Solid State Sci. 2010, 12, 2148-2154. DOI:10.1016/j.solidstatesciences.2010.09.016
CrossRef


![]()


