High Resolution Rp-Hplc Method for The Determination of Nevirapine and Associated Impurities.
DOI : http://dx.doi.org/10.13005/ojc/320246
Download this article as:
![]()
Objective of the present research work isto develop a sensitive, selective and accurate new RPHPLC method with UV detection and determination for estimation of Nevirapine (NVP)and its impurities in bulk drug.The separation and quantification was achieved with KromosilC 18 isocratic column, (150 mm × 4.6 mm i.d., particle size 3.5μm, maintained at ambient temperature), HPLC system (Peak LC P7000), a mixture of 20%acetonitrile, 80% buffer (sodium per chlorate) (v/v), at pH of 4.8 and the flow rate was set at 1.0 ml/min. and UV detection at 220 nm. The retention time for NVP, Impurity-A and Impurity-B were found to be 5.5, 7.8, 3.4 min respectively. The method was validated for Linearity, Accuracy, and Precision. The Limit of detection of NVP, Impurity-A and Impurity-B were found to be 0.03, 0.03, 0.03(µg/ml) respectively.
KEYWORDS:Nevirapine; ICH guidelines; RP-HPLC; RS Method; Validation
Introduction
NVP is a non-nucleoside reverse transcriptase inhibitor used to treat HIV-1 and AIDS. Possible side effects of NVP are Diarrhea, headache, mild nausea or stomach pain, tiredness, vomiting. Some severe allergic reactions like rash, tightness in the chest, swelling of the mouth, face, lips, or tongue, itching, hives, difficulty breathing.
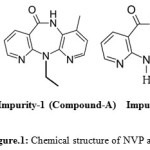 |
Figure 1: Chemical structure of NVP and its Impurities. |
Materials and Methods
Pure forms (Above 99%) of NVP and Impurity-A, Impurity-B were obtained as giftsamples from Hetero Labs, Hyderabad, India. HPLC grade solvents (Methanol, Acetonitrile, water) were procured from Merck, Mumbai, India.The mobile phase and all the solutions were filtered through a 0.45 mm membranesprior(Merckmillipore) to use. Per chloric acid was purchased from S.D. Fine Chem Ltd., Mumbai, India.
Preparation of Mobile phase:
Acetonitrile and Sodium per chlorate (pH: 4.8) were taken in 20:80 ratio and mixed well. The pH of the solution was adjusted to 4.8 with Perchloric acid. The prepared mobile phase was filtered through 0.45 mm filter membrane.
Preparation of stock solutions:
- NVP stock solution: 10 mg of NVP drug was dissolved in 100 ml Acetonitrile to obtain 100 µg/ml.
- Impurity-A stock solution: 20 mg of standard Impurity-A was dissolved in 100 ml Acetonitrile to obtain 200 µg/ml
- Impurity-B stock solution: 20 mg of standard Impurity-B was dissolved in 100 ml Acetonitrile to obtain 200 µg/ml
Preparation of standard solutions:
0.5ml of standard stock and 0.5ml of impurities stock solutions are taken in to 100ml volumetric flask and make up to 100 ml with Acetonitrile to obtain 0.5ppm of NVP and 1ppm of impurity-A and impurity-B. The standard concentration equal to unknown impurity spec (0.1%) and impurity-A and B concentration equal to 0.2% (as per USP limit)
Preparation of Sample Solution
50mg of API sample taken in to 100ml of Acetonitrile to obtain500 µg/ml concentration sample solution.
Apparatus and chromatographic condition
The method was developed and validated with HPLC system (Peak LC P7000) with isocratic pump, manual rheodyne injector with 20 µL volume loop and UV- VIS detector(UV7000) and PEAK Chromatographic version 1.06 . The API and impurity were scanned with UV-Visible spectrophotometer Tech comp UV2301 with Hitachi software. Kromasil C18 column (100mm ×4.6mm×3.5µ) RP-18 HPLCcolumn (150 × 4.6 mm, 3.5micron) was usedfor separation. HPLC detector wavelength was fixed at 220 nm. Analysis was performed at ambient temperature.
Results and Discussion
The aim of this work is to develop a RPHPLC method to quantify NVP and Impurity-A, Impurity-Bin Bulk drug. Previously few methods[5-19] are available for analysis of NVP in formulations and bulk drug.Ch Venkata Reddiah et al [20] reported one HPLC method for analysis of NVP and its impurities.While developing method at initial stage of the method development trials done with NH4H2PO4, Sodium per chloratebuffer solution at different pHandacetonitrile as solvent and C18 column but theseparation of NVPand Impurity-Ais not good. Finally the best separation with good elutionwas achieved with Sodium per chlorateand acetonitrile at pH 4.8.Diluent and standard solution represented infigure-2 and 3. NVP and Impurity-A, Impurity-Bare well separated and the peak shape, tailing factor (less than 2.0) and resolution also within the limit.
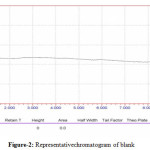 |
Figure 2: Represent ativechromatogram of blank
|
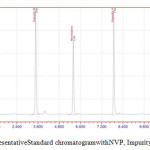 |
Figure 3: Representative Standard chromatogram with NVP, Impurity-A, Impurity-B
|
System suitability is an important test of method development of analytical procedures. System suitability test parameters are established for the developed method. Freshly prepared standard solution in to the system for three replicate injections (at 10 µg/ml, 20 µg/ml, 30 µg/ml) and calculated the percentage relative standard deviation(RSD) for area and retention time and the results found to be satisfactory. Three replicate standard solution results tabulated the results in table.1.
Table 1: System suitability test results of NVP, Impurity-A, Impurity-B
|
|
System suitability of NVP |
||||||
|
No of Injections |
CONCENTRAION ( µg/ml) |
R.T |
RESOLUTION |
T.PLATES |
TAILING FACTOR |
Peak Area |
|
|
1 |
10 |
5.509 |
16.24 |
26581 |
1.22 |
69812 |
|
|
2 |
10 |
5.505 |
16.31 |
27371 |
1.16 |
65957 |
|
|
3 |
10 |
5.490 |
15.83 |
27005 |
1.18 |
67781 |
|
|
1 |
20 |
5.492 |
15.78 |
26585 |
1.22 |
91533 |
|
|
2 |
20 |
5.497 |
16.01 |
27279 |
1.20 |
76300 |
|
|
3 |
20 |
5.517 |
16.27 |
26586 |
1.20 |
76609 |
|
|
1 |
30 |
5.525 |
16.08 |
26723 |
1.18 |
98420 |
|
|
2 |
30 |
5.515 |
15.89 |
26609 |
1.12 |
96883 |
|
|
3 |
30 |
5.503 |
16.00 |
27055 |
1.15 |
95925 |
|
|
System suitability of Impurity-A |
|||||||
|
1 |
10 |
7.847 |
17.75 |
59757 |
1.73 |
67747 |
|
|
2 |
10 |
7.852 |
17.55 |
54625 |
1.64 |
67779 |
|
|
3 |
10 |
7.852 |
17.72 |
55822 |
1.59 |
70602 |
|
|
1 |
20 |
7.825 |
17.63 |
57987 |
1.60 |
84307 |
|
|
2 |
20 |
7.857 |
17.96 |
58670 |
1.61 |
81767 |
|
|
3 |
20 |
7.839 |
17.52 |
58453 |
1.62 |
84501 |
|
|
1 |
30 |
7.857 |
17.70 |
60075 |
1.56 |
101203 |
|
|
2 |
30 |
7.850 |
17.26 |
53905 |
1.67 |
103745 |
|
|
3 |
30 |
7.850 |
17.78 |
58217 |
1.60 |
103959 |
|
|
System suitability of Impurity-B |
|||||||
|
1 |
10 |
3.305 |
0.0 |
9423 |
1.35 |
83795 |
|
|
2 |
10 |
3.293 |
0.0 |
9106 |
1.40 |
80442 |
|
|
3 |
10 |
3.307 |
0.0 |
8639 |
1.37 |
90287 |
|
|
1 |
20 |
3.302 |
0.0 |
8533 |
1.37 |
83795 |
|
|
2 |
20 |
3.303 |
0.0 |
8789 |
1.39 |
80442 |
|
|
3 |
20 |
3.274 |
0.0 |
8689 |
1.35 |
90287 |
|
|
1 |
30 |
3.302 |
0.0 |
8943 |
1.39 |
114618 |
|
|
2 |
30 |
3.303 |
0.0 |
8897 |
1.38 |
103693 |
|
|
3 |
30 |
3.274 |
0.0 |
8962 |
1.33 |
108958 |
|
Method validation
Once the HPLC method development was over, validated the developed method as perICH and FDA [1-5] guidelines with parameters like, linearity, precision, accuracy and range, ruggedness, robustness etc.
Precision of the developed method was evaluated by carrying out sixdifferent sample preparations for all individual and combination products. Percentage relative standard deviation (% RSD) was found to beless than 1% for within a day and day to dayvariations, which proves that that method isprecise. Results were shown in Table-2.
Table 2: Precision results of NVP, Impurity-A, Impurity-B
| Injections | NVP | Impurity-A |
Impurity-B |
| 1 | 13996 | 17124 | 16511 |
| 2 | 14167 | 17306 | 16553 |
| 3 | 13845 | 17098 | 16498 |
| 4 | 14128 | 17185 | 16435 |
| 5 | 13855 | 17254 | 16584 |
| 6 | 13871 | 17068 | 16472 |
| % RSD | 0.936 | 0.495 | 0.298 |
For linearity test the standard solution was taken as 100% concentration and linearity range was fixed 25%,50%,75%,100%,125%,150%.200% Linearity solutions are prepared from stock solutions and standard solution by serial dilution. The linearity results were given in Table.3. The linearity graph was shown in Graph.1, Graph.2 and Graph.3.
Table 3: Linearity results of NVP, Impurity-A, Impurity-B
| Percentage of Concentration | NVP | Impurity-A | Impurity-B |
| 25 % | 9587 | 11334 | 9668 |
| 50% | 10851 | 13559 | 12568 |
| 75% | 12574 | 15451 | 14689 |
| 100% | 13841 | 17239 | 16626 |
| 125% | 15345 | 18885 | 19224 |
| 150% | 16629 | 20975 | 21277 |
| 200% | 18316 | 23140 | 23974 |
| y=mx+c | y=11750x+8039 | y=7800x+9458 | y=9394x+7498 |
| Co-relationCoefficient | 0.998 | r2=0.998 | 0.998 |
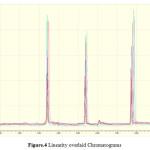 |
Figure 4: Linearity overlaid Chromatograms |
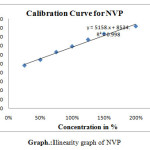 |
scheme 1: linearity graph of NVP |
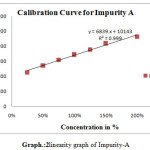 |
Scheme 2: linearity graph of Impurity-A |
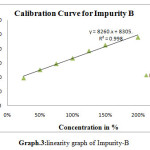 |
Scheme 3: linearity graph of Impurity-B |
The ruggedness of the method was determined by carrying out the experiment on other HPLC by different Analysts using different columns of similar types. The percentage RSD of six different preparations assay values with two different instruments, analysts and columns were given in table.4. Robustness of the method was determined by making small changes in the chromatographic conditions and found to be unaffected by small changes likepH changes ± 0.1, flow rate ± 1%, wavelength ±2 nm, temperature ± 2o C, and ± 2% change in organic solvent in the mobile phase. The Robustnessresults are shown in the Table 5.The LOQ and LOD concentrations of developed method are given in Table.4 Analysis of NVP, Impurity-A, Impurity-B in analyzed in NVP Bulk drug by using developed HPLC method. The chromatogram was given shown in Figure.4
Table 4: Ruggedness results
|
Ruggedness |
|||
|
Test |
NVP |
Imp-A |
Imp-B |
|
Standard solution Area |
13996
|
17124 |
16511 |
|
Mean of Ruggedness Six injections peak area |
13856 |
16971 |
16418 |
|
Percentage of Change in peak area |
1.000% |
0.893% |
0.563% |
Table 5: Robustness results
|
Robustness |
||||||
|
Change in Parameter |
NVP |
Percentage of Change in peak area |
Imp-A |
Percentage of Change in peak area |
Imp-B |
Percentage of Change in peak area |
|
Standard solution Area |
13996
|
0.000 |
17124 |
0.000 |
16511 |
0.000 |
|
pH at 4.6 |
13745 |
1.793 |
16954 |
0.992 |
16452 |
0.537 |
|
pH at 4.9 |
13895 |
0.721 |
16977 |
0.858 |
16398 |
0.684 |
|
flow rate at 1.1 ml/min |
13915 |
0.578 |
17049 |
0.437 |
16477 |
0.205 |
|
flow rate at 0.9 ml/min |
13887 |
0.778 |
17138 |
0.081 |
16402 |
0.660 |
|
wavelength 222 nm |
13752 |
1.743 |
17089 |
0.204 |
16582 |
0.430 |
|
wavelength 218 nm |
13790 |
1.471 |
17055 |
0.402 |
16601 |
0.545 |
Table 6: The LOQ and LOD concentrations of NVP, Impurity-A, Impurity-B
|
S.NO |
Parameter |
NVP |
Imp-A |
Imp-B |
|
1 |
LOQ (µg/ml) |
0.1 |
0.1 |
0.1 |
|
2 |
LOD(µg/ml) |
0.03 |
0.03 |
0.03 |
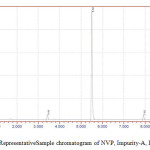 |
Figure 5: Representative Sample chromatogram of NVP, Impurity-A, Impurity-B |
Forced Degradation Studies
50 mg of NVP was diluted in 100ml of 0.1 N HCl. and heated up to 400oC. 50 mg of NVP was diluted in 100ml of 0.1 NaOH and heated up to400oC.50 mg of NVP was taken in 50 ml of H2O2 and make up to 100ml with diluents. The three prepared solutions are injected and calculated percentage of degradation. Degradation peaks of NVP at different conditions are shown in Figure.7 to Figure.9.
Table 7: Degradation study results of NVP, Impurity-A, Impurity-B
| S.No. | Degrading Agent | Drug | Initial concentration of drug before degradation (μg/ml) | Final concentration of drug after degradation (μg/ml) | % of Degradation |
| 1 | No degrading agent | NVP | 1195565 | 1195565 | 0.00 |
| 2 | 0.1 N HCL | NVP | 1195565 | 1087081 | 9.07 |
| 3 | 0.1 M NaOH | NVP | 1195565 | 1140772 | 4.58 |
| 4 | 50 % H2O2 | NVP | 1195565 | 893682 | 25.25 |
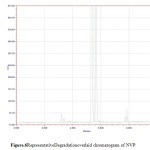 |
Figure 6: Representative Degradationoverlaid chromatogram of NVP |
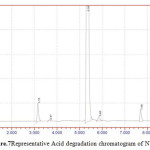 |
Figure 7: Representative Acid degradation chromatogram of NVP |
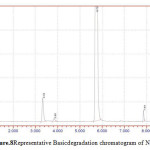 |
Figure 8: Representative Basic degradation chromatogram of NVP |
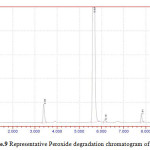 |
Figure 9: Representative Peroxide degradation chromatogram of NVP |
Conclusion
The method was developed at 220 nm UV-Wave length. The mobile phase was fixed as Aceteonitrile and Buffer on the basis of drug solubility. The ratio of organic solvent and buffer was confirmed on trail and error basis. NH4H2PO4 and Perchloric acidare used as buffer. Method was finally developed with Perchloric acid at pH 4.8. The method was validated according to ICH guidelines. There us no interference in blank injection.The precision RSD of NVP, Impurity-A, Impurity-B are below 1.0 The linearity range was fixed between 25% to 200%.The correlation coefficient is 0.998.The ruggedness and robustness tests are passed.The L.O.Q ranges of NVP,Imp-A and IMP-B are 0.1 µg/ml and LOD ranges are 0.03 µg/ml. The NVP degradation study was carried out at three conditons. NVP 25.25% degraded in peroxide condtion.9.07 % degraded in Acidic condition. 4.58% degraded in Basic condition. The developed RPHPLC method was validated with precision, linearity, accuracy and proved to be sensitive and effective for the determination of NVP and its relative substances (Impurity-A, Impurity-B) during stability testing of the bulk drug.We can apply this method for routine quality control analysis in bulk drug manufacturing industries.
References
- Sweetman S.C., Martindale, The Complete Drug Reference, Edn. 33, Pharmaceutical Press,London,2002.
- Montvale N J, Physician’s Desk Reference, Edn.56, Medical Economics Company Inc,Montvale,2003.
- International Conference on Harmonization, Q2A: Text on Validation of Analytical Procedures, Federal Register, 1995,60(40), 11260–11262. 48.
- Validation of Analytical Procedures, Text And Methodology Q2(R1),Federal Register, 1997, 62( 96) p. 27463-7
- Kapoor N, Khandavilli S, Panchagnula R. Simultaneous determination of lamivudine, stavudine and nevirapine in antiretroviral fixed dose combinations by high performance liquid chromatography. AnalyticaChimica Acta,2006, 570:41-5
CrossRef - Anantha Kumar D, Naveen Babu MN, SeshagiriRao JVLN, JayathirthRao V. Simultaneous determination of lamivudine, zidovudine and nevirapine in tablet dosage forms by RP-HPLC method.Rasayan Journal of Chemistry, 2010, 3:94-9.
- Md. S. Maqsood Ahmed, J. Sudhakar Reddy, I.E. Chakravarth,K. Prabhavathi, A simple spectrophotometric determination of Nevirapine in pharmaceutical dosage form , J. Chem. Pharm. Res. 2011,3(4):172-176.
- Anjali Joshi, Moji ChristianahAdeyeye. Reversed Phase LC-UV Method Development and Validation for Simultaneous determination of three antiretroviral: lamivudine, zidovudine, nevirapine and possible degradants in a Fixed Dose Pharmaceutical Product. J Pharma Techno Drug Res, 2012,1, 1-4.
- Palella FJ, Jr., Delaney KM, Moorman AC, Loveless MO, Fuhrer J, Satten GA, et al.: Declining morbidity and mortality among patients with advanced human immunodeficiency virus infection. HIV Outpatient Study Investigators. N Engl J Med ,1998,338;(13);853-60.
CrossRef - Solomon G, Hymete A, Mohamed AMI, Bekhit AA, HPTLC-densitometric method development and validation for simultaneous determination of lamivudine, nevirapine and zidovudine in fixed dose combinations. Thai Journal of Pharmaceutical Sciences, 2010, 35:77-88.
- PrasadaRao CH et al, Development and validation of RP-HPLC method for the estimation of Nevirapine in bulk drug and tablets,J. Pharm. Sci. & Res. Vol.1(2),2009,78-82.
- MinaketanSahoo, Stability indicating RP-HPLC method for determination of nevirapine in pure and tablet form Der PharmaChemica, 2013, 5(2):103-110.
- Ravisankar et al, Development of A New RPHPLC Method For The Estimation Of Nevirapine In Tablet Dosage Form , Int J Pharm Pharm Sci,2013, 5(3)505-511
- Pav JW HPLC-UV method for the quantitation of nevirapine in biological matrices following solid phase extraction, J Pharm Biomed Anal. 1999,20(1-2):91-98.
CrossRef - Halde S, Simple, precise and accurate HPLC method of analysis for nevirapine suspension from human plasma. Indian J Pharm Sci.2011,73(4):416-421.
- J. V. L. N. SESHAGIRI RAO, A New Validated RP- HPLC Method for the Determination of Nevirapine in Human Plasma, E-Journal of Chemistry, 2010,7(3), 821-826.
CrossRef - KokkulaSandhya, RP-HPLC Method Development And Validation For Simultaneous Estimation Of Lamivudine, Zidovudine And Nevirapine In Tablet Dosage Form, IAJPR.2014,4(4), 2133-2140.
- S. DharmarajSanthosam, Development and Validation of RP-HPLC Method for the Simultaneous Estimation of Lamivudine, Zidovudine and Nevirapine from Bulk and Tablet Dosage Form, International Journal of Pharmaceutical And Chemical Sciences,2013,2 (4),1883-1887.
- PurnimaHamrapurkar, Determination of Nevirapine in Human Plasma by High Performance Liquid Chromatography with Ultraviolet Detection, phamtech,2010,2(2) 1316-1324.
- Ch VenkataReddiah, Stability Indicating HPLC Method For Impurities Estimation Of Nevirapine In Extended Release Tablet Dose, Pharmacophore,2013,4 (2), 50-58.


ISSN Online: 2231-5039

![]()


