Extraction of Bioactive Polyphenols with High Antioxidant Activity from Bilberry (Vacciniummyrtillus L.) Processing Waste
Marcello Fidaleo1, Roberto Lavecchia2 and Antonio Zuorro2*
1Department for Innovation in Biological, Agro-Food and Forest Systems, University of Tuscia, Viterbo, Italy 2Department of Chemical Engineering, Materials and Environment, Sapienza University, Roma, Italy. Corresponding author Email: antonio.zuorro@uniroma1.it
DOI : http://dx.doi.org/10.13005/ojc/320201
Article Received on :
Article Accepted on :
Article Published : 10 May 2016
Bioactive polyphenols were extracted from the peel fraction of bilberry processing waste using aqueous ethanol as solvent. A response surface methodology was used to evaluate the effects of liquid-to-solid ratio (R), solvent composition (C), extraction time (E) and temperature (T) on the extraction yield. The following optimal conditions were determined: R = 30 mL/g, C = 57%, E = 160 min, T = 40 °C. Phenolic extracts with a polyphenol content of 83.75 ± 4.16 mg GAE/g and an antioxidant activity of 7.64 ± 0.43 mmol TE/g were also produced using a batch extractor operating under optimal process conditions.
KEYWORDS:Bilberry; Polyphenols; Extraction; Antioxidant activity; Agro-industrial wastes
Download this article as:| Copy the following to cite this article: Fidaleo M, Lavecchia R, Zuorro A. Extraction of Bioactive Polyphenols with High Antioxidant Activity from Bilberry (Vacciniummyrtillus L.) Processing Waste. Orient J Chem 2016;32(2) |
| Copy the following to cite this URL: Fidaleo M, Lavecchia R, Zuorro A. Extraction of Bioactive Polyphenols with High Antioxidant Activity from Bilberry (Vacciniummyrtillus L.) Processing Waste. Orient J Chem 2016;32(2). Available from: http://www.orientjchem.org/?p=15969 |
Introduction
In recent years, environmental concerns and sustainability issues have stimulated efforts to develop suitable strategies for the efficient management of agro-industrial wastes. Current approaches are mostly based on low-value applications, such as composting, energy production and animal feeding. However, the presence of several value-added compounds (e.g., polyphenols, carotenoids and polysaccharides) in food and vegetable wastes make them promising renewable resources for the recovery of these substances1.
Polyphenols are a class of plant secondary metabolites exhibiting high antioxidant activity and other important properties such antimicrobial activity2, reduction of inflammation3 and inhibition of the formation and growth of tumors4. The antioxidant activity of these compounds is due to their ability to quench reactive oxygen species (ROS) and to stimulate the endogenous defense system5. For these reason, an adequate dietary intake of polyphenols is thought to reduce the risk of oxidative stress-related degenerative diseases6.
Bilberry (Vacciniummyrtillus L.) is a perennial shrub native to Northern Europe and cultivated for fruit production in many parts of the world. Bilberry fruits are a very rich source of polyphenols, particularly anthocyanins and flavanols7. According to Giovanelli and Buratti8, the polyphenol content of bilberry is approximately 600 mg/100 g and is two to three times higher than in North-American highbush blueberry (V. corymbosum). Studies have also shown that the amount of polyphenols in bilberry is closely related to the developmental stage of the plant and that they tend to accumulate in the outer part of the fruit, where they perform their biological functions. Riihinen et al.9 found an anthocyanin content in the fruit peel over 20 times higher than in the pulp and a similar tissue-specific distribution was observed for quercetin and hydroxycinnamic acids.
From the industrial processing of bilberries into juices, jams and purees, a solid waste consisting mainly of the fruit skins and seeds is generated. This material is available in relatively large amounts in manyEuropean and American countries and is usually disposed of or used for composting or animal feeding. In contrast, its potential use as a source of polyphenols for pharmaceutical, nutraceutical or cosmetic applications has been the subject of only limited attention. For example, Aaby et al.10 showed that extracts from bilberry press residue exhibited promising anti proliferative effects on three human colon cancer lines. In another study, functional milk products with high antioxidant capacity were obtained using phenolic extracts from bilberry waste11.
The aim of the present study was to develop a simple and environmentally friendly procedure, with a view to industrial scale-up, for the recovery of polyphenols from bilberry processing waste.To this end, aqueous solutions of ethanol, a ‘Generally Recognized As Safe’ (GRAS) compound,were used as solvent and the operating conditions were varied within ranges of practical interest. Another purpose of this study was to optimize the extraction process and evaluate the characteristics of the polyphenol extracts obtained under optimal process conditions.
Materials and methods
Chemicals and plant material
Ethanol (CAS 64-17-5), methanol (CAS 67-56-1) and hydrochloric acid (CAS 7647-01-0) were obtained from Carlo Erba (Milano, Italy). Gallic acid (CAS 149-91-7), Trolox (6-Hydroxy-2,5,7,8-tetramethylchroman-2-carboxylic acid, CAS 53188-07-1), DPPH (2,2-diphenyl-1-picrylhydrazyl, CAS 1898-66-4) and the Folin-Ciocalteu reagent were purchased from Sigma-Aldrich (Milano, Italy). All chemicals were reagent grade and used without further purification.
Bilberry residues were obtained from “Rigoni di Asiago SRL”, a fruit transformation company located in Asiago (VI, Italy). The waste consisted mainly of the fruit skins and was stored in plastic bags at –20 °C. When needed, an aliquot of the frozen material was thawed in air at room temperature and assayed for moisture and polyphenols.
Analytical methods
Moisture content was determined by drying to constant weight. Measurements were made with an electronic moisture analyzer (MAC 50/1, Radwag, Poland).
The polyphenol content of bilberry residues was determined using a three-stage extraction procedure12. Specifically, 1 g of plant material and the appropriate amount of 50% (v/v) aqueous ethanol (100, 50 and 20 mL in the first, second and third stage, respectively) were placed in screw-top glass flasks. After 90-min stirring at 40 °C, the solution was filtered at 0.45 μm and assayed for total polyphenols. The polyphenol content of the plant material was calculated as the sum of the values obtained in each stage.
Total polyphenols were determined by the Folin-Ciocalteumethod with some modifications13. The results were expressed as gallic acid equivalents (GAE) per unit weight or volume of sample using a calibration curve obtained with gallic acid standards.
Antioxidant activity was determined by the DPPH assay, according to the procedure described by Brand-Williams et al.14. The results were expressed as Trolox equivalents (TE) per unit weight or volume of sample using a calibration curve obtained with Trolox standards.
Table 1: Actual and coded levels of the factors of the experimental design
| Factor | Unit |
Coded level |
||||
|
–2 |
–1 |
0 |
+1 |
+2 |
||
| Liquid-to-solid ratio (R) | mL/g |
10 |
20 |
30 |
40 |
50 |
| Solventcomposition (C) | % v/v |
10 |
30 |
50 |
70 |
90 |
| Extraction time (E) | min |
30 |
90 |
150 |
210 |
270 |
| Temperature (T) | °C |
20 |
30 |
40 |
50 |
60 |
Extraction procedure
The extraction of polyphenols from bilberry residues was performed in batch mode using aqueous ethanol of various concentrations as solvent. Appropriate amounts of plant material and solvent were initially loaded into screw-cap flasks. The flasks were placed in a water bath thermostated at the desired temperature (±0.1 °C) and were magnetically stirred. At the selected time, an aliquot of the liquid was taken, passed through a 45-μm nylon filter and assayed for total polyphenols.
A Pyrex glass vessel (1.5-L working volume) provided with a mechanical stirrer (two-blade 60-mm impeller) and a thermostated water jacket was used to produce bilberry extracts. About 40 g of plant material were loaded into the extractor together with the appropriate amount of aqueous ethanol. The stirring speed was set at 300 rpm. At the end of extraction, the vessel was emptied and the suspension filtered on paper. The liquid was evaporated in a Rotavapor (R-215, BÜCHI Labortechnik AG, Switzerland) equipped with a vacuum controller and a diaphragm pump. Evaporation was carried out at 40 °C for about 2 h by reducing the pressure, step wise or continuously, down to 15–20 mbar. The dried extract was weighed and assayed for total polyphenols and antioxidant activity.
Table 2: Experimental design layout and observed extraction yields (y).SO is the standard order and RO the run order of experiments
|
SO |
RO |
Coded level |
Response |
|||
|
|
x1 |
x2 |
x3 |
x4 |
y (%) |
|
|
1 |
3 |
–1 |
–1 |
–1 |
–1 |
51.4 ± 1.2 |
|
2 |
12 |
+1 |
–1 |
–1 |
–1 |
57.4 ± 1.0 |
|
3 |
21 |
–1 |
+1 |
–1 |
–1 |
61.7 ± 1.7 |
|
4 |
1 |
+1 |
+1 |
–1 |
–1 |
71.9 ± 1.8 |
|
5 |
27 |
–1 |
–1 |
+1 |
–1 |
54.8 ± 1.4 |
|
6 |
9 |
+1 |
–1 |
+1 |
–1 |
58.0 ± 1.5 |
|
7 |
5 |
–1 |
+1 |
+1 |
–1 |
62.8 ± 1.2 |
|
8 |
26 |
+1 |
+1 |
+1 |
–1 |
68.4 ± 2.0 |
|
9 |
20 |
–1 |
–1 |
–1 |
+1 |
73.9 ± 2.2 |
|
10 |
10 |
+1 |
–1 |
–1 |
+1 |
79.7 ± 1.6 |
|
11 |
25 |
–1 |
+1 |
–1 |
+1 |
72.1 ± 2.1 |
|
12 |
17 |
+1 |
+1 |
–1 |
+1 |
86.0 ± 1.8 |
|
13 |
16 |
–1 |
–1 |
+1 |
+1 |
75.2 ± 1.6 |
|
14 |
18 |
+1 |
–1 |
+1 |
+1 |
80.7 ± 1.5 |
|
15 |
23 |
–1 |
+1 |
+1 |
+1 |
78.9 ± 1.9 |
|
16 |
29 |
+1 |
+1 |
+1 |
+1 |
86.6 ± 1.7 |
|
17 |
11 |
–2 |
0 |
0 |
0 |
60.2 ± 1.3 |
|
18 |
30 |
+2 |
0 |
0 |
0 |
83.8 ± 2.0 |
|
19 |
24 |
0 |
–2 |
0 |
0 |
46.0 ± 1.2 |
|
20 |
28 |
0 |
+2 |
0 |
0 |
64.0 ± 1.8 |
|
21 |
7 |
0 |
0 |
–2 |
0 |
66.5 ± 1.6 |
|
22 |
22 |
0 |
0 |
+2 |
0 |
70.4 ± 2.1 |
|
23 |
13 |
0 |
0 |
0 |
–2 |
68.7 ± 1.6 |
|
24 |
4 |
0 |
0 |
0 |
+2 |
92.9 ± 1.9 |
|
25 |
14 |
0 |
0 |
0 |
0 |
80.9 ± 2.2 |
|
26 |
2 |
0 |
0 |
0 |
0 |
80.7 ± 1.9 |
|
27 |
8 |
0 |
0 |
0 |
0 |
73.7 ± 2.0 |
|
28 |
15 |
0 |
0 |
0 |
0 |
76.1 ± 1.8 |
|
29 |
6 |
0 |
0 |
0 |
0 |
80.5 ± 1.9 |
|
30 |
19 |
0 |
0 |
0 |
0 |
74.3 ± 1.7 |
Experimental design
A central composite design (CCD) was used to investigate the effects of liquid-to-solid ratio (R), aqueous ethanol concentration (C), extraction time (E) and temperature (T) on the recovery of polyphenols from bilberry residues The CCD consisted of a full two-level factorial design (16 runs), a replicated central point (6 runs) and axial points at distance ±α from the central point (8 runs). The value of α was taken as (24)1/4 = 2 to ensure rotatability of the design15.
Factor levels were chosen to cover a range of values of practical interest. They are reported in Table 1 in both actual (Xi) and coded (xi) values, the latter being obtained by the following transformations
where Xi,0 is the actual value of the i-th factor at the center-point level and ΔXi is the step change value for that factor.
The extraction yield of polyphenols (y), expressed as the percentage amount of extracted polyphenols to the initial amount of polyphenols in the plant sample, was used as the response variable.
Overall, the experimental design consisted of 30 runs (Table 2), which were performed in random order to minimize the effects of uncontrolled factors.
The statistical software JMP®(version 11, SAS Institute, Cary, NC, USA) was used forthe design of experiments and the analysis of the results.
Results and Discussion
Polyphenol content of bilberry residues
The moisture content of bilberry peels was about 57% (w/w). The total polyphenol content determined by the three-stage extraction procedure was 1.19 ± 0.12 g GAE per 100 g fw, corresponding to 27.83 ± 2.81 mg GAE/g dw. This value is higher than those reported for similar agro-industrial wastes. For example, values close to 14 mg GAE/g were determined for grape pomace16 and carrot peel waste17. A polyphenol content of 10.85 mg GAE/g was found in olive pomace18, while 8.2 and 11.4 mg GAE/g were obtained for kiwi and apple peel wastes19. Finally, artichoke bracts and stems,the two major components of artichoke processing waste, were found to possess a polyphenol content of 10.23 and 16.36 mg GAE/g, respectively20. Therefore, based on the total phenolic content, it can be said that bilberry residues are an important and potentially valuable source of polyphenols.
Modelling of polyphenol extraction
The experimental design results are shown in Table 2. The polyphenol extraction yields (y) were correlated in terms of the dimensionless independent variables (xi) by the following full second-order polynomial equation:

where a0 is the intercept, ai, aii and aij are the linear, pure quadratic and interaction regression coefficients, and xi are the coded variables defined as in Eq. (1). After eliminating the non-significant terms (α = 0.05), the following reduced hierarchical model was obtained:

Table 3 reports the estimates of the coefficients in Eq. (3) obtained by least-squares fitting together with their standard errors, t-values and p-values. Examination of the p-values reveals that, with the exception of a3, all the coefficients of the reduced model were statistically significant at the 95% confidence level. However, the term a3x3 was retained in the model to ensure hierarchy. We also note that all the interaction coefficients were not significant, this implying that each factor exerted its effect independently of the others.
Table 3: Estimates of the regression coefficients in Eq. (3) together with their corresponding standard errors (s), t-values (t), and p-values (p)
|
Coefficient |
Value |
s |
t |
p |
| a0 |
77.367 |
1.091 |
70.927 |
<0.0001 |
| a1 |
4.372 |
0.771 |
5.668 |
<0.0001 |
| a2 |
3.886 |
0.771 |
5.038 |
<0.0001 |
| a3 |
0.799 |
0.771 |
1.036 |
0.311 |
| a4 |
8.127 |
0.771 |
10.537 |
<0.0001 |
| a22 |
–5.489 |
0.708 |
–7.747 |
<0.0001 |
| a33 |
–2.124 |
0.708 |
–2.999 |
0.006 |
Overall, the model provided a good fit to the data (Fig. 1), with a coefficient of determination (R2) of 0.91 and an average percent difference between experimental and calculated extraction yields of about 4%. Moreover, ANOVA analysis indicated that the lack of fit was not significant and hence that the reduced model described by Eq. (3) is statistically sound.To check for the accuracy and the predictive capability of the model, seven additional experiments were performed (Table 4). Validation runs were conducted both inside (trials 1–4) and outside (trials 5–7) the factorial space. The mean difference between the observed and predicted yields was 5.5% and all of the predicted valuesfell inside the 95%-prediction intervals, further validating the model described by Eq. (3).
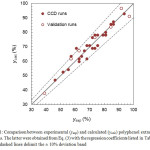 |
Figure 1: Comparison between experimental (yexp) and calculated (ycalc) polyphenol extraction yields. The latter were obtained from Eq. (3) with the regression coefficients listed in Table 3. The dashed lines delimit the ± 10% deviation band Click here to View figure |
Fig. 2 shows the response surface plots of the polyphenol extraction yield as a function of two factors varying in the factorial part of the design(–1 ≤ xi ≤ +1) while setting the others to their center-point values. As is evident from Fig. 2a, when plotting the yield against liquid-to-solid ratio (R) and temperature (T), a planar response surface is observed, in accordance with the linear dependence of y on x1 and x4in Eq. (3). Since the associated model coefficients, a1and a4, are both positive, it follows that an increase in R or T improves the efficiency of polyphenol extraction. This can be easily explained by considering that higher liquid-to-solid ratios enhance the mass-transfer of the polyphenols into the solvent21 and that temperature has a positive effect on the extraction kinetics, which can be attributed to the weakening of the solute–matrix interactions and/or to its influence on the properties of the solvent22. Sincea4is greater thana1, it follows that temperature has a more pronounced effect than liquid-to-solid ratio on polyphenol recovery.
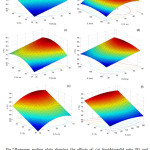 |
Figure 2: Response surface plots showing the effects of: (a) liquid-to-solid ratio (R) and temperature (T); (b) solvent composition (C) and extraction time (E); (c) liquid-to-solid ratio (R) and solvent composition (C); (d) liquid-to-solid ratio (R) and extraction time (E); (e) solvent composition (C) and temperature (T); and (f) extraction time (E) and temperature (T) on the polyphenol extraction yield (y). For each surface plot, the levels of the other factors are held at their central values Click here to View figure |
When the levels of R and T are kept constant, the response surface displays a maximum-like behavior (Fig. 2b). To better investigate the effects of solvent composition (C) and extraction time(E), the right-hand side of Eq. (3) was differentiated with respect to x2 and x3 (with x1 = x4 = 0) and equated to zero. The following stationary point coordinates were obtained: x2S = 0.35 and x3S = 0.19 or, in terms of uncoded variables: C = 57.1% (v/v) and E = 161.3 min.From the above analysis and the plots reported in Figs. 2c to 2f, it can be said that the response surface can be described as a “rising ridge”. Therefore, for any given value of R and T, the polyphenol extraction yield can be maximized by setting the solvent composition and the extraction time to their optimal levels. Regarding the latter two variables, we note that solvent composition has a much greater effect on polyphenol extraction, being a2 almost five times higher than a3.
The existence of an optimum aqueous ethanol concentration for the recovery of polyphenols, lying roughly between 50 and 60% (v/v) ethanol, has been reportedin several other studies on plant wastes, such as peanut skins23, olive leaves24, kiwifruit residues25 and potato peels26. An explanation can be given by the fact that the various polyphenols present in bilberry skins have different affinities for ethanol and water. Accordingly, an optimal aqueous ethanol concentration may exist which maximizes the total amount of polyphenols extracted27. However, it cannot be excluded that other solvent-related effects, e.g., solvent-induced perturbations of solute–matrix interactions or swelling, are alsoinvolved28. Swelling occurs when solvent molecules adsorb on specific functional groups of the structural plant components such as cellulose and lignin, causing an expansion of the plant tissues. This increases solvent penetration in the plant matrix, improving the extraction of matrix-bound compounds. Due to their small molar volume, high hydrogen bonding capability and large basicity, ethanol and water are effective swelling agents29, which suggests that swelling phenomena may play a role in the extraction process.
Production and characteristics of dry bilberry extracts
Dry bilberry extracts were produced as described in the Experimental section by vacuum evaporation of the polyphenol solution obtained in the mechanically stirred vessel operated under optimum extraction conditions. The conditions were set as follows: R = 30 mL/g, C = 57% (v/v), E = 160 min, T = 40 °C. The resulting dry extracts had a moisture content of 5.8 ± 0.2 (% w/w)and a polyphenol content of 83.75 ± 4.16 mg GAE/g dw. The antioxidant activity, expressed as Trolox equivalents (TE), was 7.64 ± 0.43 mmol TE/g dw. It is interesting to compare this value with those obtained for extracts from different plant materials. Gong et al.30 report an antioxidant activity of 0.3 to 1.83 mmol TE/g for alcoholic extracts from marigold (Tageteserecta L.) residues. In the case of grape pomace31, values ranging from 0.9 to 2.34 mmol TE/g were determined, while extracts from Jatropha curcas L.32had an antioxidant activity of 8.53–8.84 mmol TE/g. It is also of interest to consider that raw cocoa beans33 and commercial cocoa powders34, which are well-known rich sources of antioxidant phenolic compounds, exhibited antioxidant activities ranging from 0.1 to 3 mmol TE/g.
From the above results, it can be concluded that dry bilberry extracts obtained from bilberry skins under optimized extraction conditions have a very high antioxidant capacity and could, therefore, be used as valuable functional ingredients in pharmaceutical,nutraceutical and cosmetic products.
Table 4:Experimental (yexp) and predicted (ypred) polyphenol extraction yields for model validation together with the 95%-prediction intervals (PI). Superscripts in the first column denote experiments performed inside (in) and outside (out) the factorial region
| Trial |
R (mL/g) |
C (% v/v) |
E (min) |
T (°C) |
yexp (%) |
ypred (%) |
PI (%) |
| 1in |
25 |
50 |
180 |
50 |
84.5 |
83.18 |
74.9 –91.5 |
| 2in |
30 |
60 |
210 |
40 |
73.5 |
76.61 |
68.4–84.8 |
| 3in |
25 |
40 |
150 |
35 |
63.2 |
67.80 |
59.6–76.0 |
| 4in |
45 |
50 |
150 |
55 |
91.0 |
96.11 |
87.3–104.9 |
| 5out |
30 |
10 |
30 |
40 |
39.0 |
37.54 |
26.0–49.0 |
| 6out |
40 |
50 |
270 |
60 |
97.4 |
91.09 |
80.7–101.5 |
| 7out |
30 |
70 |
210 |
25 |
56.6 |
62.25 |
53.6–70.9 |
Conclusions
The results of this study demonstrate that bilberry processing waste is a very rich source of polyphenols and that they can be easily recovered, in the form of a phenolic-rich extract, by an environmentally friendly extraction procedure using aqueous ethanol as solvent. We have also shown that the extraction efficiency is mainly affected by temperature, liquid-to-solid ratio and solvent composition and, to a lesser extent, by extraction time.
Future research should focus on the possibility of using mixed wild fruit wastes and the identification of bioactive compounds other than polyphenols, such as vitamins, peptides, polysaccharides and sterols, in the resulting extracts.
Acknowledgements
The authors gratefully thank “Rigoni di Asiago SRL” (Asiago, VI, Italy) for the kind gift of bilberry residues.
References
- Mirabella, N.; Castellani, V.; Sala, S.;J. Clean. Prod.2014, 65, 28–41.
CrossRef - Daglia, M.; Curr. Opin. Biotechnol.2012, 23, 174–181.
CrossRef - Sureda, A.; Tejada, S.; Bibiloni, M. D. M.; Tur, J. A.; Pons, A.; Polyphenols: Well beyond the antioxidant capacity: Polyphenol supplementation and exercise-induced oxidative stress and inflammation. Curr. Pharm. Biotechnol.2014, 15, 373–379.
CrossRef - Dai, J.; Mumper, R. J.; Molecules2010, 15, 7313–7352.
CrossRef - Landete, J. M.; Crit. Rev. Food Sci. Nutr.2013, 53, 706–721.
CrossRef - Vauzour, D.;Rodriguez-Mateos, A.; Corona, G.;Oruna-Concha, M. J.; Spencer, J. P. E.;Nutrients2010, 2, 1106–1131.
CrossRef - Manganaris, G.A;Goulas, V.; Vicente, A. R.; Terry, L. A.; J. Sci. Food Agric.2014, 94, 825–833.
CrossRef - Giovanelli, G.; Buratti, S.;FoodChem.2009, 112, 903–908.
CrossRef - Riihinen, K.;Jaakola, L.;Kärenlampi, S.;Hohtola, A.;Food Chem.2008, 110, 156–160.
CrossRef - Aaby, K.; Grimmer, S.;Holtung, L.;LWT-Food Sci. Technol.2013, 54, 257–264.
CrossRef - Fidaleo, M.; Lavecchia, R.; Maffei, G.; Zuorro, A.; Int. J. Appl. Eng. Res.2015,16, 36222–36225.
- Zuorro, A.; Lavecchia, R.; Am. J. Appl. Sci.2014, 10, 478–486.
CrossRef - Panusa, A.; Zuorro, A.; Lavecchia, R.;Marrosu, G.; Petrucci, R.;J. Agric. Food Chem.2013, 61, 4162–4168.
CrossRef - Brand-Williams, W.;Cuvelier, M. E.;Berset, C.;LWT−Food Sci. Technol.1995, 28, 25−30.
- Montgomery D.C. Design and Analysis of Experiments, 7th ed., John Wiley. New York (2009).
- Louli, V.;Ragoussis, N.; Magoulas, K.; Bioresour. Technol.2004, 92, 201–208.
CrossRef - Chantaro, P.;Devahastin, S.;Chiewchan, N.;LWT-Food Sci. Technol.2008,41, 1987–1994.
CrossRef - Zuorro, A.;Int. Rev. Model. Simul.2014, 7, 1023–1028.
- Wijngaard, H. H.; Rößle, C. H.; Brunton, N;Food Chem.2009, 116, 202–207.
CrossRef - Zuorro, A.; Am. J. Appl. Sci. 2014,11, 1463–1471.
CrossRef - Cussler E.L., Diffusion: Mass Transfer in Fuid Systems, 3rd Edition, Cambridge University Press. Cambridge (2009).
CrossRef - Spigno, G.; Tramelli, L.; De-Faveri, D. M.; J. FoodEng.2007, 81, 200–208.
CrossRef - Nepote, V.; Grosso, N.; Guzman, C.; J. Sci. Food Agric.2005, 85, 33–38.
CrossRef - Mylonaki, S.;Kiassos, E.;Makris, D.P.; Kefalas, P.;Anal. Bioanal. Chem.2008, 392, 977–985.
CrossRef - Sun-Waterhouse, D.; Wen, L.;Wibisono, R.; Melton, L.D.;Wadhwa, S.;Int. J. Food Sci. Technol.2009, 44, 2644–2652.
CrossRef - Wijngaard, H.H.;Ballay, M.;Brunton, N.;Food Chem.2012, 133, 1123–1130.
CrossRef - Liu, F.F.;Ang, C.Y.W.; Springer, D.;J. Agric. Food Chem.2000, 48, 3364–3371.
CrossRef - Zuorro, A.; Maffei, G.; Lavecchia, R.;Chem. Eng. Trans.2014, 39, 463–468.
- ElSeoud, O. A; Pure Appl. Chem.2009, 81, 697–707.
CrossRef - Gong, Y.; Liu, X.; He, W.H.; Xu, H.G.; Yuan, F.; Gao, Y.X.;Fitoterapia2012, 83, 481–489.
CrossRef - Tournour, H.H.;Segundoc, M.A.;Magalhãesc, L.M.;Barreirosc, L.;Queiroza, J.; Cunha, L.M.;Ind. Crop. Prod.2015, 74, 397–406.
CrossRef - Fu, R.; Zhang, Y.; Guo, Y.; Liu, F.; Chen, F.;Ind. Crop. Prod.2014, 58, 265–270.
CrossRef - Schinella, G.; Mosca, S.; Cienfuegos-Jovellanos, E.; Pasamar, M. A.; Muguerza, B.; Ramon, D.; Rios, J. L.; Food Res. Int.2010, 43, 1614–1623.
CrossRef - Fidaleo, M.; Fracassi, A.; Zuorro, A.; Lavecchia, R.; Moreno, S.; Sartori, C.;FoodFunct.2014, 5, 2931–2939.
CrossRef

This work is licensed under a Creative Commons Attribution 4.0 International License.
![]()
A New Edition of Web of Science
Journal Impact Factor
2022: 0.5
Five Year: 0.8
Journal is Indexed in

Cabells Whitelist
![]()


