Development and validation of Ultra violet spectrophotometric and Reversed-phase High Performance Liquid Chromatography techniques for simultaneous estimation of Brinzolamide and Brimonidine tartrate in ophthalmic suspension formulation.
Gunasekar Manoharan* and Mohammed Al Bratty
College of Pharmacy, Pharmaceutical Chemistry Department, Jazan University, AlrawdaDist, Jazan, 82726, Saudi Arabia. Corresponding author email: Shekarphd@yahoo.com
DOI : http://dx.doi.org/10.13005/ojc/320236
Article Received on :
Article Accepted on :
Article Published : 09 Apr 2016
A sensitive and fast UV spectrophotometric technique and feasible reverse phase liquid chromatographic method for the analysis of Brinzolamide and Brimonidine tartrate in ophthalmic formulation has been developed.Linearity ranges for both methods were 5 - 25 μg/ml and 1-5 μg/ml for brinzolamide and brimonidine tartrate respectively.The absorption maxima were observed at 232 and 257 nm for Brinzolamide and Brimonidine. The UV, ophthalmic formulation assay shows percentage purity ranging from 98.90 to 101.01% for Brinzolamide and 98.20 to 100.80% for Brimonidine. The mean percentage purity is 99.82% and 99.80% for Brinzolamide and Brimonidine respectively. The chromatographic retention time forBrinzolamide and Brimonidine was found to be 5.9 and 8.4 minutes respectively. The tailing factor was 0.808 and 0.860 for Brinzolamide and Brimonidine tartrate respectively. The method was validated according to the ICH guidelines and the method was found to be applicable for determination of Brinzolamide and Brimonidine tartrate from combined ophthalmic form.
KEYWORDS:Brinzolamide (BRZ); Brimonidine (BRT); HPLC and UV
Download this article as:| Copy the following to cite this article: Manoharan G, Al Bratty. High Resolution Rp-Hplc Method for The Determination of Nevirapine and Associated Impurities. Orient J Chem 2016;32(2). |
| Copy the following to cite this URL: Manoharan G, Al Bratty. Development and validation of Ultra violet spectrophotometric and Reversed-phase High Performance Liquid Chromatography techniques for simultaneous estimation of Brinzolamide and Brimonidine tartrate in ophthalmic suspension formulation. Orient J Chem 2016;32(2). Available from: http://www.orientjchem.org/?p=15226 |
Introduction
Glaucoma is adisorders characterized by a loss of visual associated with optic nerve damage and associated with intra-ocular pressure rise. Glaucoma is categorized into two forms primary open-angle glaucoma and primary angle closure glaucoma. The drugs which used to reduce intra-ocular pressure is achieved by different types of mechanism[1-2]. The first choice of drug is topical beta-blocker or prostaglandin analogues. It is necessary to combine these drugs or by adding with other types likesympathomimeticsmiotics, orcarbonic anhydrase inhibitors to maintainocular pressure [3]. Brinzolamide chemically called as 4R)-4-(ethylamino)-2-(3-methoxypropyl)-1,1-dioxo-2H,3H,4H-1λ⁶-thieno[3,2-e][1,2]thiazine-6-sulfonamide (Figure 1a) is a carbonic anhydrase inhibitor used to the patients with open-angle glaucoma to lower hypertension by decreasing the fluidamount produced by eyes.Blindness is prevented by lowering pressure inside the eye [1].Brimonidine chemically called as 5-Bromo-N-(4,5-dihydro-1H-imidazol-2-yl) quinoxalin-6-amine (Figure 1b), which is a alpha -adrenoceptor agonist, used in the reduction of intra-ocular pressure in open- angle glaucoma or ocular hypertension. Brimonidine is also used as adjunctive therapy when intra-ocular pressure is inadequate[4-6].
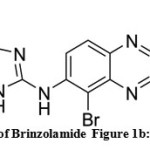 |
Figure 1a: chemical structure of Brinzolamide Figure 1b: chemical structure of Brimonidine Click here to View figure |
Literature review reveals several methods developed has been reported for Brinzolamideestimation in biological fluids and there are some methods reported by voltammetry [7], spectroscopy [8], HPTLC HPLC, UPL Cand capillary electrophoresis [9-11]. Two methods were only reported for estimation of this combination first is HPTLC [12]and the other is HPLC method [13-15]. The latter does not fulfil all requirements of validation. Method development of simultaneousUV and HPLC estimation for this combination is our new method will ful fil all requirements of validation according to ICH guidelines. It should be characterized by simplicity, fast analysis, sensitivity and suitability for routine pharmaceutical analysis.
Materials and Methods
Chemicals and Reagents
The working standard of Brinzolamide and Brimonidine was purchased from Sigma, UK. The Marketed sample of Brimonidine Tartrate 0.2% and Brinzolamide 1% ophthalmic preparation ‘Simbrinza’ were from Alcon Laboratories (UK) Ltd, purchased from the local Pharmacy, Jazan, KSA. Acetonitrile and MethanolHPLC grade was purchased from Merck, Darmstadt, Germany, Triethylamine and Orthophosphoricacids purchased from Fisher Scientific (UK).
Pharmaceutical preparation
Simbrinza eye drops; Alcon Laboratories (U.K) contains (Brimonidine Tartrate 0.2% and Brinzolamide) 1%) B.NO: AMCM3111
Instrumentation
UV spectrophotometer
A double beamUV-visible spectrophotometer-Shimadzu, UV-1601 (Japan) matched with quartz cells corresponding to 1 cm path length.
HPLC instrumentation and chromatographic condition
HPLC system of Shimadzu LC-20 AT, with an auto sampler (SIL-20AC HT, Shimadzu, Japan) and SPD-10 detector (SPD- M20A, Japan) was used. For data recording the LC-solution software used. A Zorbax Eclipse Plus, Agilent Technologycolumn (150mm x 4.6mm, 5μmwas used, ) Pore size of the column 95Å. For degassing mobile phase, power sonic 505 ultrasonic baths (Hwashin technology, Seoul, Korea) was used.By using oven (CTO-20AC) column was maintained at a temperature of 39ºC and 1.0 ml/min was the flow rate. Analysis was carried over with 20μl injection volume usingSPD-10 detection at 260nm. 10 minutes was set as run time.
Preparation of Standard Stock Solution for UV
The standard stock solution of Brinzolamide and Brimonidinewere prepared by dissolving separately 3 mg of Brinzolamide and Brimonidinepowder respectively in 100 ml 0.1 M HCl. Both Brinzolamide and Brimonidine powder freely soluble in 0.1 M HCl and does not have any interference in the absorption peaks. Accurate volumes transferred to two sets of calibrated 10 ml flask.
Development of the method
The stock solution suitably diluted with 0.1 M HCL so as to contain 5 – 25 μg/ml and 1-5 μg/ml Brinzolamide and Brimonidine respectively. The prepared solutions were scanned in the UV region between 200 nm – 400 nm. The Brinzolamide exhibited λ max at 232nm and Brimonidine exhibited λ max at 257nm. The individual drug concentration present in the mixture was determined against the calibration curve in quantization mode.
Analysis of Ophthalmic Suspension
1 ml suspension was taken from formulation and transferred tovolumetric flask 100 ml and diluted up to 100 ml with 0.1 M HCl, which is equivalent to 20 μg/ml of Brimonidine and 100 μg/ml of Brinzolamide. From this stock, 1 ml of solution was diluted with 0.1 M HCl to 10 ml, which contains 2μg/ml of Brimonidine and 10μg/ml of Brinzolamide. The mixture kept stand for 15 min,to ensure complete solubility of the drug by intermittent sonication, and filtered through a 0.45 μm membrane filter. The concentrations were determined by measuring the absorbance of the sample at Brimonidine 257nm and Brinzolamide 232 nm. The results were calculated against the calibration curve in quantization mode.
Preparation of Standard solution for HPLC
Preparation of Mobile phase
Triethylamine phosphate buffer was prepared using 4.0 ml of triethylamine in 1000 ml of water by using phosphoric acid pH adjusted to a 5.0 (±0.5). It was filtered with 0.45μ membrane filters and degassed in an ultrasonic bath for 10 minutes. The ratio of buffer, acetonitrile and methanol was 75:20:05, v/v.
Preparation of Brinzolamide Stock solution
Accurately 5 mg of Brinzolamide working standard was taken in 100 ml volumetric flask and dissolved by mobile phase and diluted to 25 ml of mobile phase and sonicated for 10 minutes and 75ml of mobile phase was added to the mark and cooled to room temperature.1 ml of standard stock solution was diluted to 10ml with mobile phase to obtain a concentration of 5 μg/ml.
Preparation of Brimonidine Stock solution
Accurately 1 mg of Brimonidine working standard was taken in 100 ml volumetric flask and dissolved by mobile phase and diluted to 25 ml of mobile phase and sonicated for 10 minutes and 75ml of mobile phase was added to the mark and cooled to room temperature.1 ml of standard stock solution was diluted to 10ml with mobile phase to obtain a concentration of 1 μg/ml.
Preparation of sample solution
Sample bottles were shaken well before use. 10 ml of ophthalmic suspension were taken into a dried volumetric flask 100 ml. About 50 ml of mobile phase was added to dilute and stand for 15 minutes and diluted to mark with mobile phase. The resulting solution was filtered through What man 1 filter paper. 10 ml of the resulting solution was diluted to 50 ml with mobile phase and filtered by 0.45μ disc filter.
Method validation
The present method was conducted to obtain a new, sensitive and convenient method for simultaneous estimation by HPLC from ophthalmic formulation.The experimental method was validated according to the ICH guidelines recommendation sand USP-30 for parameters such as, system suitability, accuracy, precision,linearity and specificity.
System suitability
System suitability parameters like resolution, retention time, tailing factor and column theoretical plates was performed by injecting six replicates of standards and two replicates of sample preparation at a 100% level to cross verify the accuracy and precision of the chromatographic system.
Linearity
The linearity of chromatographic method was established by plotting a graph to concentration vs peak area of Brinzolamide and Brimonidine standard and determining the correlation coefficients (R2) of the two compounds. For the linearity studies of Brinzolamide and Brimonidine the specific range was determined at 5 – 25 μg/ml and 1-5 μg/ml for Brinzolamide and Brimonidine tartrate respectively were injected into the HPLC system. For 60 minutes column was equilibrated with the mobile phase before injection of the solutions.
Table 1: Quantitative Estimation OfBrinzolamide And BrimonidineIn Ophthalmic Formulation
|
Ophthalmic sample |
Label claim (mg/ml) |
Amount present |
Percentage Label claim |
Percentage deviation |
|
Brinzolamide |
10 |
9.96 |
99.20 |
-0.80 |
|
Brimonidine |
2 |
2.21 |
100.19 |
+0.19 |
*Each value is a mean of six readings
Accuracy
The method accuracy was determined by recovery experiments. The recovery was performed by adding Brinzolamide and Brimonidine working standards to placebo (excipients mixture) in the range of test concentration (60%, 80% and100 %) and expressed as percent (%) recovered. Three samples were prepared for each recovery level. The recovery statistical results are
Precision
The intraday and interday precision of the analyzed method was determined by analyzing the sample responses 4 repeats on the same day and 4 different days of a week for 4 different concentrations of standard solutions of Brinzolamide and Brimonidine. 10 – 25 μg/ml and 2-5 μg/ml for brinzolamide and brimonidine tartrate respectively, and results are represented in terms of % RSD.
Table 2: UV Statistical Data
|
Ophthalmic sample |
Standard deviation (S.D) |
Relative Standard deviation (RSD) |
Relative Standard deviation % RSD |
Standard Error of mean (S.E) |
|
Brinzolamide |
0.006519 |
0.00627 |
0.627 |
0.0797 |
|
Brimonidine |
0.0010 |
0.001048 |
0.1048 |
0.1311 |
* Each value is a mean of six readings
Specificity
The analytical method specificity is to measure the compound accurately in presence of interferences like excipients, degradants and matrix components. The UV spectrum and HPLC of standard mixture and formulation shows specificity of method. The UV spectrophotometric and HPLC method is able to access the analyte in presence of excipients.
Statistical Parameters
The results of assay obtained are subjected to the following statistical analysis, standard deviation, relative standard deviation, coefficient of variation and standard error.
Result and Discussion
The UV spectrum of Brinzolamide and Brimonidine are showed in figure 2. The maxima absorption was observed at 232 and 257 nm for Brinzolamide and Brimonidine. Brimonidine attached to chomophoric molecule, increase both its wave length and intensity of absorption maximum. Increase in conjugation, increase absorbance of light to higherl, bathochromic shift with hyperchromic effects of Brimonidine are showed in figure 2.
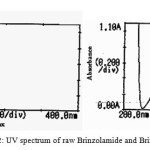 |
Figure 2: UV spectrum of raw Brinzolamide and Brimonidine |
The linearity of calibration curve of Brinzolamide and Brimonidine shows that obeyance of Beer’s law was confirmed, which are represented in figure 3. Brinzolamide linearity concentration range of 5-25μg/ml and Brimonidine linearity range of 1-5μg/ml. The overlying spectra for the linearity of Brinzolamide and Brimonidine and spectrum of sample formulation are presented in figure 4. The concentration of Brinzolamide 15μg/ml and Brimonidine 3μg/ml was taken for quantitative estimation.
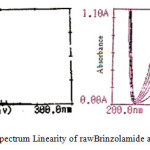 |
Figure 3: UV spectrum Linearity of rawBrinzolamide and Brimonidine |
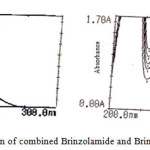 |
Figure 4: Quantitative estimation of combined Brinzolamide and Brimonidine in ophthalmic formulation |
The ophthalmic formulation shows percentage purity value ranging from 98.60-100.20 % for Brinzolamide and 99.98-100.16 % for Brimonidine. The % deviation was found to lie between -1.4 – +0.2 for Brinzolamide and -0.1 – +0.2 for Brimonidine. The relative standard deviation values are found to be below 2% indicating the methodology precision and low standard error values show the method accuracy.The quantitative estimation of Brinzolamide and Brimonidinein ophthalmic formulation is shown in table 1. The statistical data is given in table 2. The limit of detection and limit of quantification for Brinzolamide and Brimonidine were calculated and values are given in table in table 3.
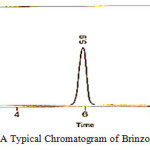 |
Figure 5: A Typical Chromatogram of Brinzolamide Standard |
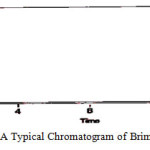 |
Figure 6: A Typical Chromatogram of Brimonidine Standard Click here to View figure |
Table 3: Results Of UV Limit Of Detection (LOD) & Limit Of Quantification LOQ
|
Parameters |
Brinzolamide |
Brimonidine |
| LOD (μg/ml) |
0.51 |
0.41 |
|
LOQ (μg/ml) |
1.57 |
1.21 |
Table 4: HPLC Linearity Data For Brimonidine
| SNo |
Concentration (mg/ml)
|
Peak area
|
| 1 |
1 |
3436.94 |
| 2 |
2 |
3760.64 |
| 3 |
3 |
4090.95 |
| 4 |
4 |
4427.75 |
| 5 |
5 |
4759.29 |
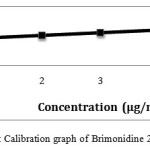 |
Figure 7: Calibration graph of Brimonidine 2-5 μg/ml precisionClick here to View figure |
The chromatogram of Brinzolamide and Brimonidine are presented in figure 5 and 6. Wavelength was selected by scanning all standard drugs over a wide range of wavelength 200-400nm. Both the components show reasonably good response at 260 nm.Linearity was evaluated by plotting peak area as a functional of analyte concentration for both Brinzolamide and Brimonidine. Thegraphical representation was given in figure 7 and 8; data is presented in table 4 and 5.
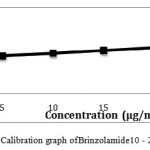 |
Figure 8: Calibration graph of Brinzolamide10 – 25 μg/ml precision |
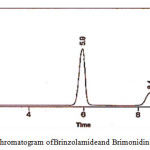 |
Figure 9: Chromatogram of Brinzolamideand Brimonidinein ophthalmic formulation |
Table 5: HPLC Linearity Data For Brinzolamide
| SNo |
Concentration (mg/ml)
|
Peak area
|
| 1 |
5 |
11903.78 |
| 2 |
10 |
12763.24 |
| 3 |
15 |
13628.45 |
| 4 |
20 |
14493.95 |
| 5 |
25 |
15358.19 |
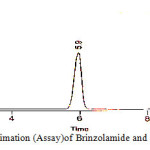 |
Figure 10: Quantitative estimation (Assay)of Brinzolamide and Brimonidinein ophthalmic formulation |
The specific range was determined from linearity studies, for both drugs and found to be 1-5 mg/ml for Brimonidine and 5-25 mg/ml for Brinzolamide. The data was analyzed by linear regression least square fit method. The slop, intercept, correlation coefficient and regression equation were also determined and the data are presented in table 6.
Table 6: Results of Statistical Parameters
| SNo | Parameters | Brinzolamide | Brimonidine |
|
1 |
Standard deviation (SD) |
4.353 |
13.933 |
|
2 |
Relative standard deviation (RSD) |
0.00574 |
0.0101 |
|
3 |
% RSD |
0.574 |
1.011 |
|
4 |
Standard error (SE) |
0.02347 |
0.0836 |
|
5 |
Correlation Coefficient (r) |
0.9983 |
0.9996 |
|
6 |
Slope (a) |
33.1181 |
86.395 |
|
7 |
Intercept (b) |
1503.26 |
11037.67 |
|
8 |
Regression equation Y = (a X + b) |
Y = 33.1181 X + 1503.26
|
Y = 86.395 X + 11037.67
|
The suitability parameters of the system like resolution, tailing factor, retention time and theoretical plates for the developed RP-HPLC method are presented in figure 9; the data are presented in table 7.
Table 7: Results Of System Suitability Parameters
| SNo | Parameters |
Brinzolamide
Brimonidine
1
Theoretical plates
8948
8303
2
Tailing factor
0.808
0.860
3
Resolution factor
8.33
8.33
4
Retention time
5.9
8.4
5
Calibration range or Linear dynamic range
1-5
5-25
The chromatographic retention time for Brinzolamide and Brimonidine was found to be 5.9 and 8.4 minutes respectively. This is well within the specific limits of 10-15 minutes. The high – resolution value of 8.33 Brimonidine indicates complete separation of the drugs. The tailing factor was found to be 0.808 and 0.860 for Brinzolamide and Brimonidine respectively. The peaks are symmetrical and theoretical plates for Brinzolamide and Brimonidine were 8948 and 8308 respectively which shows the column efficient performance. The limit of detection and limit of quantification for Brinzolamide and Brimonidine are presented in table 8. The quantitative estimation of Brinzolamide and Brimonidine ophthalmic formulation was carried out by RP-HPLC method using Triethylamine phosphate buffer, acetonitrile and methanol was 75:20:05, v/v using C18 column as the stationary phase. The quantitative estimation of the suspension formulation is presented in table 9 and graphically presented in figure 10.
Table 8: Results OfLimit Of Detection (LOD) and Limit Of Quantification LOQ
|
Parameters
|
Brinzolamide | Brimonidine |
|
LOD (ng/ml)
|
0.430
|
0.530
|
|
LOQ (ng/ml)
|
1.310
|
1.610
|
Table 9: Quantitative Estimation (Assay) Of Data Of Brinzolamide And Brimonidine From Ophthalmic Formulation
|
S No |
Drug
|
Label claim (mg/ml) |
Amount found |
Mean amount |
Percentage purity |
Mean percentage |
% Deviation |
|
1 |
Brinzolamide |
10 |
9.97 9.91 10.02 10.04 10.01 |
9.95 |
99.40 98.22 100.44 100.80 100.20 |
99.80 |
– 0.6 -1.8 -0.4 +0.8 +0.2 |
|
2 |
Brimonidine |
2 |
1.94 1.96 2.05 2.02 1.98 |
1.95 |
98.90 99.20 101.01 100.40 99.62 |
99.82 |
-1.1 -0.8 +1.1 +0.4 -0.4 |
The ophthalmic formulation assay shows percentage purity ranging from 98.90 to 101.01% for Brinzolamide and 98.20 to 100.80% for Brimonidine. The mean percentage purity is 99.82% and 99.80% for Brinzolamide and Brimonidine respectively. The percentage deviation was found to be -1.1 to +1.1% and – 1.8 to +0.8 for Brinzolamide and Brimonidine respectively. The RSD values are below 2% indicating the method precision and the accuracy of the method shown by the low standard error values. This shows a good index of accuracy and reproducibility of the developed method. All the parameters including flow rate, detection wavelength sensitivity was maintained constant.
Conclusion
The proposed and developed UV and RP-HPLC method is precise, accurate, and sensitive. The method is rapid, reproducible, and economical and does not have any interference due to the excipients in the pharmaceutical preparations.
Acknowledgement
The authors are thankful and acknowledge Jazan University for financial support and required facilities to carry out this research work through a scientific research grant.
References
- BMJ Group. British national formulary 62. (1stedn), Pharmaceutical Press, London. 2011.
- Narendra, A.; Deepika, D.; Annapurna, M.M. E-J Chem.2012, 9, 1327- 1331
CrossRef - Gandhi,L.R.;Dewani, A.P.;Bakal,R.L.;Shiradkar,M.R.;Chande,A.V. Int. J. Pharm. 20113 (7), 21–26
- Naeem, R.S.; Muhammad, A.;UllahKhanand, I.I.M. Quim. Nova.2011,1 (6) 200–209
- Fahim, N.K.;Beheshti, H.R.;Feizy, J.;Janati, S.S.F.GIDA dergisi. 2012,37, 127-132
- Bhatta, R.S.;Chandasana, H.;Rathi, C.; Kumar, D.;Chhonker, Y.S.; Jain, G.K.J Pharm Biomed Anal. 2011,54, 1096-1100
CrossRef - Alberts, P.; Stander, M.A.; Villiers, A.D. South African Journal for Enology and Viticulture. 2011,32, 51-59
- Nagori, B.P.;Maru, A.;Muysuni, P.; Gupta, S.J Chem Pharm Res.2011,3, 866-874
- Wanare, R.S.;Kabra, A.O.;Deshmukh, A.;Aher, N.Int J Compreh Pharm.2012,3, 1-4
- Rele, R.V.;Mhatre, V.V.;Parab, J.M.;Warkar, C.B.J Chem Pharm Res. 2011,3,138-144.
- Sharma, N.;Rao, S.S.; Reddy, A.M.J Chromatogr Sci. 2012, 50, 745- 755
- Mehta, J.; Patel, V.;Kshatri, N.;Vyas, N.Anal. Methods. 2010,2, 1737-1744
CrossRef - Shokraneh, F.; Dabirsiaghi, A.; Adib,N. Orient J. Chem. 2012,28(1), 237-241
- Jain, P.S.;Khatal, R.N.;Jivani, H.N.; Surana, S.J.J Chromatograph SeparatTechniq.2011, 2, 113-117
- Phogat, A.; Kumar, M.S.;Mahadevan, N.Int J Rec Adv Pharm Res.2011, 3, 31-36

This work is licensed under a Creative Commons Attribution 4.0 International License.
![]()
A New Edition of Web of Science
Journal Impact Factor
2022: 0.5
Five Year: 0.8
Journal is Indexed in

Cabells Whitelist
![]()


