Development and Validation of Hplc-Ms/Ms Method for Rivaroxaban Quantitation in Human Plasma Using Solid Phase Extraction Procedure
G. Srinivas Reddy1*, S. L. N .Prasad Reddy2 and L. Shiva Kumar Reddy1
1Research Scholar, Department of Pharmaceutical sciences, Jawaharlal Nehru Technical University, Hyderabad Andhra Pradesh, INDIA 2Principal, Sanskruthi college of pharmacy, Ghatkesar, Hyderabad, Andhrapradesh India. Corresponding author Email: srinupharma@gmail.com
DOI : http://dx.doi.org/10.13005/ojc/320240
Article Received on :
Article Accepted on :
Article Published : 13 May 2016
A bioanalytical method was developed and validated using High Performance liquid chromatography–tandem mass spectrometry (HPLC-MS/MS) technique for the determination of Rivaroxaban in human plasma. The samples were extracted using solid-phase extraction (SPE) technique wherein Rivaroxaban D4 has been used as the internal standard. The use of isocratic Liquid chromatography (LC) method has enabled to achieve 2.0 minutes along with their respective internal standard using a Phenomenex Gemini C18, 50*4.6mm, 5µ column. The developed method was specific and sensitive having no interfering peaks in the drug free plasma. The method was validated for a linear range of 2.00-500.93 ng/mL for Rivaroxaban with a correlation coefficient ≥ 0.99. The limit of detection (LOD) of 2 ng/mL for Rivaroxaban a signal-to noise (S/N) >10 was achieved, Electrospray ionization source in positive mode was used for the detections of Rivaroxaban and IS. Precursor to product ion transition of m/z 436.20 > 144.80 for rivaroxaban and m/z 440.20 > 144.70 for IS were used in multiple reaction monitoring mode. Intra-run precision (%CV) ranged from 3.8% to 0.9% for Rivaroxaban. Inter-run accuracy(%Bias) ranged from -3.1% to -1.9% for Rivaroxaban .The overall recoveries for Rivaroxaban, Rivaroxaban D4 were found to be >96%. Rivaroxaban was found to be stable at various temperatures and for about 5 freeze-thaw cycles and reconstituted samples were stable up to 72 hours post to extraction. The developed and validated method was found to be precise, reproducible and a high throughput of analyzing more than 400 samples per day could be achieved with a shorter run time of 2.0 minutes. The developed method is useful to measuring Rivaroxaban plasmatic concentrations in pharmacokinetics studies and in therapeutic drug monitoring.
KEYWORDS:Rivaroxaban; Rivaroxaban D4; SPE; HPLC-MS/MS; Human plasma; Method validation
Download this article as:| Copy the following to cite this article: Reddy G. S, Reddy S. L. N. P, Reddy L. S. K. Development and Validation of Hplc-Ms/Ms Method for Rivaroxaban Quantitation in Human Plasma Using Solid Phase Extraction Procedure. Orient J Chem 2016;32(2) |
| Copy the following to cite this URL: Reddy G. S, Reddy S. L. N. P, Reddy L. S. K. Development and Validation of Hplc-Ms/Ms Method for Rivaroxaban Quantitation in Human Plasma Using Solid Phase Extraction Procedure. Orient J Chem 2016;32(2). Available from: http://www.orientjchem.org/?p=16064 |
Introduction
Rivaroxaban
(S)-5-chloro-N-{[2-oxo-3-[4-(3-oxomorpholin-4-yl) phenyl] oxazolidin-5-yl] methyl} thiophene-2-carboxamide (RIV) is an oral anticoagulant. Anticoagulants are given to prevent the blood from clotting or prevent to existing clots from getting larger. Clots can block the blood flow to the heart muscle or block the blood flow to the brain. These cause a heart attack or a stroke. Rivaroxaban (RIV), an oral oxazolidinone-based anticoagulant, is a potent, selective direct inhibitor of factor Xa that is used in the prevention of venous thromboembolism in adult patients after total hip replacement or total knee replacement surgery[1]. Rivaroxaban (Figure 1) is a small molecule (molecular mass: 436 g mol-1) that is almost insoluble in water and exhibits high plasma protein binding (92–95%) in humans, with serum albumin being the main binding component.
The potency of factor Xa inhibition occurs primarily as a result of RIV binding with high selectivity to the S1 and S4 pockets of the serine endopeptidase (Duggan et al., 2009). Inhibition of factor Xa interrupts the intrinsic and extrinsic pathway of the blood coagulation cascade, inhibiting both thrombin formation and development of thrombi[1,2].
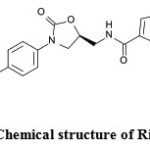 |
Figure 1: Chemical structure of Rivaroxaban Click here to View figure |
RIV does not inhibit thrombin (activated Factor II), and has no effects on platelets have been demonstrated (Pezborn et al., 2007; Terry et al., 2009). al., 2009).
A literature survey revealed few Spectrophotometric methods[12] and liquid chromatography (LC) assay methods [13]that have been reported for the determination of Rivaroxaban in bulk drug and pharmaceutical dosage forms, but there are no reported methods for estimation of Rivaroxaban in human plasma by using LC-MS/MS methods.
This manuscript describes a rapid, sensitive and suitable methodology for quantization of Rivaroxaban in human plasma. The Rivaroxaban was extracted from plasma by using solid phase extraction. The inter-day and intraday batch precision and accuracy were ≤15 and >85% -<115% in human plasma, respectively. A linear regression (1/x2) was used to perform the calibration over an analytical range of 2.00-500.93ng/ml.
Experimental
Materials and Methods
Chemicals and Reagents
Ammonium formate (AR grade), formic acid (85%synthesis),orthophosphoricacid(AR),Dimethyl sulphoxide (DMSO) were obtained from Merck.Methanol and acetonitrile (HPLC grade) was purchased from Qualigens (India) Ltd., Mumbai. And all aqueous solutions including the buffer for the mobile phase were prepared with water (resistivity of 18.2 MΩ cm) collected from a Milli-Q gradient system of Millipore (Elix 3, Milli-Q A10 Academic).Blank human plasma (anticoagulant EDTA- K2) was collected from laxmisai pvt ltd. Strata x polymeric cartridge (30mg/1ml) was used. Rivaroxaban, Rivaroxaban D4 standards were supplied by vivan lifesciences,Mumbai.
Instrumentation and Operating Conditions
The liquid chromatography (LC) system consisted of solvent delivery (LC10ADVP), controller (LC10ADVP) and Column oven (CTO10ASVP) from Shimadzu (Kyoto, Japan). SIL HTC autosampler from Shimadzu (Kyoto, Japan) was used to inject 10 µl aliquots of the processed samples on a phenomenex Gemini C18 (50*4.6mm, 5µm) Column kept at room temperature. The isocratic mobile phase, a mixture of acetonitrile:5mm ammonium formate buffer(pH 3.5±0.3) ( 85:15 v/v) was delivered at 0.8 mL/ min into the mass spectrometer’s electrospray ionization chamber.
Quantitation was achieved by MS–MS detection in positive ion modes for the analyte and IS using a triple Quadrupole mass spectrometer API 3000 made by AB Sciex Instruments (Toronto, Canada),equipped with a turbo ion spray interface at 475°C. The ion spray voltage was set at 4500 V. The common parameters viz., nebulizer gas (NEB) was set at 8. The curtain gas and collision gas were set at10.00, 8.00 respectively. The compound parameters viz., Declustering potential (DP), collision energy (CE), Entrance potential (EP) and collision cell exit potential (CXP) were 50 V, 40eV, 10V, 13 V for Rivaroxaban and 50 V, 40eV ,10V, 13 V for Rivaroxaban D4 IS, respectively. Detection of the ions was performed in the multiple reaction monitoring (MRM) mode, the transition pairs of Rivaroxaban at the m/z 436.20 (Q1 mass) precursor ion to the m/z 144.80 product ion (Q3 mass), Rivaroxaban D4at the m/z 440.20 (Q1 mass) precursor ion to the m/z 144.70 product ion (Q3 mass), (Fig. 2). Quadrupoles Q1 and Q3 were set on unit resolution.The analytical data was processed byAnalyst software (version 1.4.2).
Preparation of RXN Stock standard and working solutions
Weighed about 2.0mg of Rivaroxaban working standard and transfer it into a 2ml volumetric flask, dissolve in about 1ml of DMSO and make up the volume with the same to get about 1mg/ml concentrated solution. Correct the final concentration of rivaroxaban accounting for its potency and actual amount weighed. Provide a batch number and store the stock solution in a refrigerator at 1-10°C. The working solutions were obtained by suitably diluting the RXN stock solution in acetonitrile and water (50:50, v/v).
Preparation of RXN D4 (Internal Standard)
Weighed about 1.0mg of Rivaroxaban D4 working standard and transfer it into a 2ml volumetric flask, dissolve in about 1ml of DMSO and make up the volume with the same to get about 0.5mg/ml concentrated solution. Correct the final concentration of rivaroxaban accounting for its potency and actual amount weighed. Provide a batch number and store the stock solution in a refrigerator at 1-10°C. Working IS solutions were prepared by suitably diluting the above-mentioned stock solution a fresh before use.
Preparation of Calibration Standards and Quality Control (QC) Samples
The working calibration standards solutions of Rivaroxaban were prepared by serial dilutions in methanol: water (50:50, v/v) from stock solution. Calibration standards were prepared by spiking 20µl of appropriate standard solution into 980 µl of drug free human plasma. Effective calibration concentrations in the plasma matrix were 2.00, 4.00, 15.00, 50.01, 100.02, 225.06, 400.04, 500.93 ng/ml. The quality control samples were prepared at three concentration levels 5.99, 211.54 and 381.90 ng/ml (low, medium, and high quality controls, respectively),in plasma matrix by separately prepared stock solution. All stock solutions and calibration standards solution were stored at 1-10°C until use.
Sample Procedure
The spiked plasma samples were retrieved from the Deep freezer and thawed. The thawed samples were vortexed to ensure complete mixing of the contents. A 300 μL of the samples was pipette out into riavial. 50µl of Rivaroxaban D4( 1μg/ml )dilution was added to it as an internal standard (IS), except in blank plasma Samples and vortexed. Add 0.3ml of diluted OPA solution and vortex. On the SPE unit using starta X (30mg/ml) cartridges, condition with 1ml of methanol, equilibrate with 1ml of milli-Q water. Load the plasma sample and wash with 1ml of milli-Qwater. Finally elute with 1ml of methanol. Then evaporate the elute under dry nitrogen gas at about 50°c and 15psi for about 20minutes or till the tubes are dried. Reconstitute the evaporated tubes with 0.5ml of mobile phase and vortex. Then transfer the solution into prelabeled auto sampler vials and the solution obtained was analyzed by HPLC with MS-MS Detection.
Method Validation
The method was validated for selectivity, linearity, accuracy, precision, recovery, stability, detection limit and quantitation limit according to the principles of the FDA industry guidance [11].
Selectivity
The selectivity of this method was performed by analyzing 6 different lots of plasma, one lipid sample and one hemolyzed sample. We check the interference at the retention time of RXN at quantification limit and RXN D4 (IS) at working concentration. A human plasma sample spiked with Rivaroxaban at 2.00 ng·mL–1 and a human plasma sample spiked with IS at 1000 ng·mL–1 were analyzed according to the sample procedure described in Section 2.6.
Linearity
The linearity of calibration curve for RXN was assessed at eight concentration levels in the range of 2.00 – 500.93 ng·mL–1 in plasma samples. Peak area ratios for each solution against its corresponding concentration were measured and the calibration curve was obtained from the least-squares linear regression presented with their correlation coefficient.
A regression equation with a weighting factor of 1/ x2of Rivaroxaban to Rivaroxaban D4 concentration was judged to produce the best fit for the concentration-detector response relationship for Rivaroxaban in human plasma. Correlation Coefficient (r2) was greater than 0.99 in the concentration range of 2.0 ng/ml to 500.93ng/ml for Rivaroxaban.
Detection Limit
The detection limit was estimated from the signal-to- noise ratio. This parameter was defined as the lowest concentration level resulting in a peak area of three times the baseline noise.
Quantitation Limit
The quantitation limit was defined as the lowest concentration level that provided a peak area with a signal-to- noise ratio higher than 5, with precision (% CV) within ± 20% and accuracy (% recovery) between 80% and 120%.
Recovery
The extraction recovery of analyte at three QC samples was determined by measuring the peak area responses from plasma samples spiked with analyte before extraction with those from drug-free plasma samples extracted and spiked with same concentration of analyte after extraction. The recovery of IS at concentration of 1000 ng·mL−1 was determined in the same way. The recovery of RXN and IS were determined using six replicates. The extraction recovery at low, medium and high levels of QC samples was obtained according Equation (1):
R (%)= PSbe / PSae*100 (1)
where: R is extraction recovery, PSbe is the mean value of the peak area responses obtained from plasma samples spiked with analyte before extraction and
PSae is the mean value of the peak area responses obtained from plasma samples spiked with analyte after extraction.
Matrix Effect
The matrix effect [9] due to plasma matrix was used to evaluate the ion suppression/enhancement in a signal when comparing the absolute response of QC samples after pretreatment with the absolute response of reconstitution samples of extracted blank plasma sample spiked with analyte. The IS normalised matrix factor shall be within 0.85 to 1.15 in 4 out of 6 tested lots along with haemolytic and lipemic lots. The % CV for IS normalised matrix factor across the eight lots shall not be more than 15%.
Accuracy and Precision
The intra-day data reflects the precision and accuracy of the method under the same conditions within one day. Intra-day accuracy and precision were obtained by analyzing six replicates of three QC samples (low, medium and high levels). Accuracy was determined by the regressed (measured) concentration represented as a percentage of the target (nominal) concentration. The percent relative standard deviation (% RSD) of the regressed (measured) concentrations was used to report precision. The inter-day precision and accuracy were verified by repeating the above procedure at three different occasions.
Stability
Stability of RXN in plasma was performed using six replicates of two QC samples at low and high levels. Samples were prepared by spiking drug-free plasma with appropriate volumes of RXN standard solutions. The stability was evaluated with five studies; stability in injection medium, freeze-thaw, short-term and long-term stability as well as standard solution stability, according to described in subsequent sections.
Stability in Injection Medium
The QC samples were processed and stored under ambient conditions (25°C) in the LC vials intended to be used during routine analysis. At the following time points the samples were analyzed: Initial, 21 hours and 42 hours.
Freeze/Thaw Stability
The QC samples were analyzed after three freeze/thaw cycles. Samples were stored at approximately –20°C for 24 hours. Subsequently, the samples were thawed under ambient conditions (25°C) and then frozen for 12 hours. After three freeze/thaw cycles the samples were processed and analyzed. The results were then compared with those obtained from samples analyzed at initial moment.
Short-Term Stability
The QC samples were kept at ambient temperature (25°C) for 21 h and then processed and analyzed for short-term stability study. The results were compared with those obtained from samples analyzed at initial moment.
Long-Term Stability
The QC samples were stored at −20°C for 90 days, then extracted and analyzed for long-term stability study. The results were compared with those obtained from samples analyzed at initial moment.
Standard Solution Stability
A RXN solution at concentration of 500.93ng·mL–1 and an IS solution at 1000.0 ng·mL–1 were prepared from a fresh weighing (Sections 2.3 and 2.4). A portion of the samples was kept at ambient temperature (25°C) for 17 hours and then analyzed by the proposed method. A second portion of the samples was stored between 2°C and 8°C for 10 days and then analyzed. The results were compared with those obtained from samples analyzed at initial moment.
Results and Discussion
Sample Preparation and LC–MS/MS Analysis
The main aim of this work was to develop a rapid, selective and sensitive analytical method including an efficient and reproducible sample clean-up step for quantitative analysis of RXN in human plasma. Chromatographic separation was achieved with Phenomenex Gemini C18, 50×4.6mm,5µm column using mobile phase that consists of a mixture of 5Mm Ammonium formate buffer(pH3.5±0.3): Acetonitrile( 15:85 v/v). ISTD selection should always have similar chromatographic & ionization properties, and recovery of the analyte. Based on these properties of Rivaroxaban and were chosen as internal standards. Strata-x cartridges were used for separation or extract the drug from plasma by SPE. Good chromatograms were obtained with no significant matrix effects. Total runtime was 2.0 min with RT’s of 0.82 for Rivaroxaban and 0.82 for Rivaroxaban D4 respectively. The LC-MS/ MS method described here satisfies the requirement of routine analyses since it has a short run time (2.0 min), which has advantages over other methods described in the literature.
Rivaroxaban and internal standard Rivaroxaban D4 was ionized efficiently in the positive ionization mode and precursor or parent ion formed was (M+H) + ion. Rivaroxaban and internal standard Rivaroxaban D4 was ionized efficiently in the positive ionization mode and (M+H) + ions were formed. Hence there was a positive ionization mode at RT 2.00 min. Quadrapole mass spectrometer was employed, here parent ion was selected by first quadrapole (Q1) followed by fragmentation of the parent ion with N2 gas in the collision chamber (Q2) and then full product ion scan in the third quadrapole (Q3). In mass spectrometry, the parameters such as temperature, flow rate of curtain gas and collision gas and collision energy were optimized to obtain maximum response of the fragment ion. In case of Rivaroxaban and Rivaroxaban D4 fragmentation takes place at aromatic ring and formation of product ions at m/z 144.80 (Fig.7.1.9) and 144.70 amu respectively.
Method Validation
Selectivity
No interference peak was detected for RXN or IS (Figure 2). The acceptance criteria for RXN had a m
ean interference per batch <20% of the signal at the limit of quantification. The IS had a mean interference of <5% of the signal at the working concentration.
Linearity
The correlation coefficient for RXN over the concentration range of 2.00 ng/mL to 500.93 ng/mL was 0.9996. The average slope and intercept of regression equations were 0.0085 and -0.0002 respectively. Linearity was found to be quite satisfactory and reproducible.
Quantitation Limit
On the basis of a signal-to-noise ratio (S/N) for 5, the quantitation limit for RXN was found to be 2.00 ng·mL–1. The precision and accuracy at quantitation limit were found to be 5.5 (% CV) and 113.8 (% recovery). These results suggest that RXN in plasma at the concentrations associated with therapy can be estimated accurately.
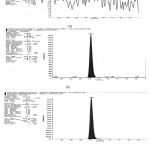 |
Figure 2: Representative mass chromatograms of (a) blank human plasma, (b) human plasma spiked with Rivaroxaban at Quantitation limit (2.00 ng·mL–1) and (c) human plasma spiked with Rivaroxaban D4 (1000 ng·mL–1) Click here to View figure |
Extraction Recovery
The percent recoveries of RXN and IS are shown in Table 1. The extraction recoveries determined were found to be between 97.6 and 97.2% for RXN and IS. The precision of the recovery at each concentration level was better than ±20%. Due to this good recovery it was not necessary to improve the extraction procedure described above.
Table 1: Assay recovery for RXN and IS.
|
RXN |
RXN D4 (IS) |
||
|
Concentration (ng·mL–1) |
Recovery (%) |
Concentration (ng·mL–1) |
Recovery (%) |
|
14.98 |
100.2 |
1000 |
97.2 |
| 76.27 |
210.95 |
96.9 |
|
| 150.52 |
382.85 |
95.6 |
|
Accuracy and Precision
The intra-day precision and accuracy data for QCs are summarized in Table 2. The international acceptance criteria (CV for precision better than 15% and recovery values for accuracy between 85% and 115%) were met [11].
The inter-day precision and accuracy data shown in Table 3 also fulfill at the international acceptance criteria [11] (CV for precision better than 15% and recovery values for accuracy between 85% and 115%).
The Intra-run precision (%CV) at DIQC, HQC, MQC and LQC level ranged from 0.9 %, 1.1%, 0.8%, and 2.2% and at LLOQQC level it was 3.8% for Rivaroxaban. The inter-run precision (%CV) at DIQC, HQC, MQC and LQC levels ranged from 1.9%, 3.4%, 0.6%, and 1.4% and at LLOQQC it was 3.8% for Rivaroxaban.
Table 2: Intra-day precision and accuracy data.
|
Intra Day |
||||
|
QC LEVEL |
Mean conc. (ng/mL) |
% CV |
Accuracy % |
|
| LLOQ QC (2.01 ng/mL) |
2.208±0.09 |
3.8 |
109.9 |
|
| LQC ( 5.99 ng/mL) |
5.713±0.13 |
2.2 |
95.4 |
|
| MQC (211.54 ng/mL |
195.975±1.55 |
0.8 |
92.6 |
|
| HQC (381.90 ng/mL) |
356.793±3.87 |
1.1 |
93.4 |
|
| DIQC (1000.18 ng/mL) |
969.375±9.13 |
0.9 |
96.9 |
|
|
Table 3. Inter-day precision and accuracy data. |
||||
|
Inter Day |
||||
|
QC LEVEL |
Mean conc. (ng/mL) |
% CV |
Accuracy % |
|
| LLOQ QC (2.01 ng/mL) |
2.197±0.07 |
3.1 |
109.3 |
|
| LQC ( 5.99 ng/mL) |
6.172±0.09 |
1.4 |
103.0 |
|
| MQC (211.54 ng/mL |
211.158±1.30 |
0.6 |
99.8 |
|
| HQC (381.90 ng/mL) |
358.745±12.22 |
3.4 |
93.9 |
|
| DIQC (1000.18 ng/mL) |
968.36±18.37 |
1.9 |
96.8 |
|
Matrix effect
The matrix factor for Rivaroxaban and Rivaroxaban D4 were calculated by comparing the area response observed in post spiked samples with that of unextracted samples at LQC and HQC level. The matrix effect was evaluated from the %CV of matrix factor at each level. Two quality control samples at each level were analyzed and the mean of %CV of the samples analyzed was found less than 15% for each QC level for Rivaroxaban and Rivaroxaban D4 [Table 4].
Table 4: Matrix effect (n=8) for Rivaroxaban and Rivaroxabane D4
|
S.No |
Parameter |
LQC |
HQC |
|||||
|
Mean Matrix Factor |
SD |
%CV |
Mean Matrix Factor |
SD |
%CV |
|||
|
1 |
Analyte area |
0.930 |
0.094 |
10.12 |
0.985 |
0.052 |
5.29 |
|
|
2 |
IS Area |
0.951 |
0.101 |
10.62 |
1.001 |
0.062 |
6.19 |
|
|
3 |
IS Normalised |
0.979 |
0.026 |
2.60 |
0.984 |
0.0211 |
2.10 |
|
Stability
The processing and storage conditions of clinical samples need to maintain the integrity of a drug or at least keep the variation of pre-analysis as minimal as possible [16]. For this reason, stability studies play an important role in a bioanalytical method development. In this study, the stability was assessed by considering five parameters; stability in injection medium, freeze-thaw, short-term and long-term stability as well as standard solution stability. The results presented in Tables 5 and 6 shows that RXN is stable under the studied conditions, since in all cases the international acceptance criteria (variation values for area smaller than 15%) were met [11].
|
Table 5: Standard solution Stability data. |
|||||||
|
Solution stability test |
Rivaroxaban |
Rivaroxaban D4 |
|||||
| Mean area |
CV (%) |
Area (%) |
Mean area |
CV (%) |
Area (%) |
||
| Short -term stock solution stability at 25°C | |||||||
| Initial (n = 6) |
892329 |
1.6 |
100 |
209388 |
1.6 |
100 |
|
| 10 hours ( n = 6) |
877117 |
1.2 |
98.1 |
206020 |
1.6 |
101.4 |
|
| Stock Dilution solution stability at 25°C | |||||||
| Initial (n = 6) |
911017 |
2.4 |
100 |
211873 |
2.2 |
100 |
|
| 18 hours ( n = 6) |
901814 |
1.8 |
99 |
208795 |
1.7 |
98.5 |
|
| Long -term stock solution stability at 2-8°C | |||||||
| Initial (n = 6) |
690740 |
2.1 |
100 |
154119 |
2.4 |
100 |
|
| 12 Days (n = 6) |
699116 |
0.8 |
101.3 |
156571 |
1.4 |
102.1 |
|
Table 6: Stability studies data.
|
Table 6. Stability studies data. |
||||||
|
Stability test |
Nominal conc. Of 5.99 ng·mL–1 |
Nominal conc. Of 381.90 ng·mL–1 |
||||
|
Measured concentration (ng·mL–1) |
CV (%) |
Area (%) |
Measured concentration (ng·mL–1) |
CV (%) |
Area (%) |
|
| Stability in injection medium | ||||||
| initial(n=6) |
5.94 |
1.70 |
97.4 |
353.40 |
1.5 |
92.5 |
| 48 hrs (n=6) |
6.21 |
1.5 |
103.7 |
388.255 |
2.4 |
101.7 |
| Freeze–thaw stability | ||||||
| Initial (n = 5) |
5.94 |
1.70 |
97.4 |
353.40 |
1.5 |
92.5 |
| After freeze–thaw cycles(6 cycles) |
6.22 |
1.7 |
104.0 |
366.99 |
1.8 |
96.1 |
| Bench top stability | ||||||
| initial(n=6) |
5.94 |
1.70 |
97.4 |
353.40 |
1.5 |
92.5 |
| 48 hrs (n=6) |
5.64 |
3.6 |
94.2 |
355.53 |
2 |
93.1 |
| Dry extract stability | ||||||
| initial(n=6) |
5.94 |
1.70 |
97.4 |
353.40 |
1.5 |
92.5 |
| 48 hrs (n=6) |
5.8 |
4.1 |
96.8 |
376.56 |
2.4 |
98.6 |
| Long-term stability at-20°c | ||||||
| initial(n=6) |
5.94 |
1.70 |
97.4 |
353.40 |
1.5 |
92.5 |
| 30 days (n = 6) |
6.04 |
3.8 |
100.8 |
386.86 |
1.2 |
101.3 |
| Long-term stability at-70°c | ||||||
| initial(n=6) |
5.94 |
1.70 |
97.4 |
353.40 |
1.5 |
92.5 |
| 30 days (n = 6) |
6.19 |
3.4 |
103.3 |
387.22 |
1.1 |
101.4 |
| Long-term stability at-20°c | ||||||
| initial(n=6) |
5.94 |
1.70 |
97.4 |
353.40 |
1.5 |
92.5 |
| 60 days (n = 6) |
5.98 |
1.9 |
99.8 |
377.16 |
4.4 |
98.8 |
| Long-term stability at-70°c | ||||||
| initial(n=6) |
5.94 |
1.70 |
97.4 |
353.40 |
1.5 |
92.5 |
| 60 days (n = 6) |
5.90 |
3.00 |
98.6 |
378.48 |
4.6 |
99.1 |
Conclusions
A simple, specific, rapid and sensitive HPLC/ESI/MS/MS method for quantification of RXN in human plasma has been successfully developed and validated. A simple and accurate solid extraction procedure and an isocratic chromatography condition using a reversed-phase column provided an assay well suited for real time analyses. The method exhibited excellent performance in terms of selectivity, linearity, accuracy, precision, recovery, stability and quantitation limit.
In addition, the reported method has a short analysis run time, an advantage over previously reported methods. Therefore, this method is suitable for therapeutic drug monitoring of RXN and can be used in pharmacokinetic or bioequivalence studies of this drug.
Acknowledgement
Authors would like to thank Department of Pharmaceutical Sciences, Jawaharlal Nehru Technological University, Hyderabad and Trident life sciences; Kukatpally, India for the technical support provided. This paper is part of research work for the grant of doctorate in Pharmaceutical science from JNT University, Hyderabad, India.
References
- DUGGAN, S.T.; SCOTT, L.J.; PLOSKER, G.L. Rivaroxaban a review of its use for the prevention of venous thromboembolism after total hip or knee replacement surgery. Drugs, 2009, 69, 1829-1851.
- PERZBORN, E.; KUBITZA, D.; MISSELWITZ, F. Rivaroxaban: A novel, oral, direct factor Xa inhibitor in clinical development for the prevention and treatment of thromboembolic disorders. Hämostaseologie, 2007, 27, 282- 289.
CrossRef - ROHDE, G. Determination of rivaroxaban – a novel, oral, direct Factor Xa inhibitor – in human plasma by high-performance liquid chromatography-tandem mass spectrometry. J. Chromatogr. B., 2008,872, 43-50.
CrossRef - SNYDER, L.R.; GLAJCH, J.L.; KIRKLAND, J.J. Practical HPLC method development. 2ed. New York: John Wiley & Sons, 1997. Chapter 1.2
- Stangier J. Clinical pharmacokinetics and pharmacodynamics ofthe oral direct thrombin inhibitor dabigatran etexilate. Clin Pharmacokinet ,2008; 47, 285–95.
CrossRef - Turpie AG, Lassen MR, Davidson BL, et al. (May 2009). “Rivaroxaban versus enoxaparin for thromboprophylaxis after total knee arthroplasty (Record 4): a randomised trial”. Lancet 373 ,2009, 1673–80.
CrossRef - ClinicalTrials.gov. “Oral Direct Factor Xa Inhibitor Rivaroxaban In Patients With Acute Symptomatic Pulmonary Embolism (PE) With Or Without Symptomatic Deep-Vein Thrombosis: Einstein-PE Evaluation”. Retrieved 2009.
- Delavenne X, Moracchini J, Laporte S, Mismetti P, Basset T. UPLC MS/MS assay for routine quantification of dabigatran – a direct thrombin inhibitor – in human plasma. J Pharm Biomed Anal, 2012; 58: 152–6.
CrossRef - P. J. Taylor, “Matrix Effects: The Achilles Heel of Quantitative High-Performance Liquid Chromatography-Electrospray-Tandem Mass Spectrometry,” Clinical Bio- chemistry, 2005, 38, p 328-334.
CrossRef - Xu, R. N. Fan. L., Rieser M. J. and El-Shourbagy T. A, “Recent Advances in High-Throughput Quantitative Bioanalysis by LC–MS/MS,” Journal of Pharmaceutical and Biomedical Analysis, 2007, 44, No. 2,342-355.
CrossRef - FDA, “Guidance for Industry, Bioanalytical Method Validation,” 2001. http://www.fda.gov/downloads/Drugs/GuidanceComplianceRegulatoryInformation/Guidances/ucm070107.pdf
- Chandra Bala Sekaran, Vankayalapati Hima Bind, Mittapalli Rupa Damayanthi and Anaparthi Sireesha, Development and validation of UV spectrophotometric method for the determination of rivaroxaban, Der Pharma Chemica, 2013, 5(4):1-5.
- Mustafa Çelebier, Tuba Reçber, Engin Koçak, Sacide Altınöz, RP-HPLC method development and validation for estimation of rivaroxaban in pharmaceutical dosage forms, Brazilian Journal of Pharmaceutical Sciences ,2013, 49, n. 2.
CrossRef

This work is licensed under a Creative Commons Attribution 4.0 International License.
![]()
A New Edition of Web of Science
Journal Impact Factor
2022: 0.5
Five Year: 0.8
Journal is Indexed in

Cabells Whitelist
![]()


