Development and Validation of A Stability-Indicating Liquid Chromatographic Method for Determination of Valsartan and Hydrochlorthiazide Using Quality by Design
Ashok K. Shakya
Faculty of Pharmacy and Medical Sciences, Al-Ahliyya Amman University, PO Box 263, Amman-19328, Jordan.
Corresponding author Email: ashokshakya@hotmail.com
DOI : http://dx.doi.org/10.13005/ojc/320203
Article Received on :
Article Accepted on :
Article Published : 09 May 2016
The present paper involves the analytical quality by design (AQbD)-based development of a simple, rapid, accurate and precise stability-indicating method for the estimation of valsartan and hydrochlorothiazide. Optimized mobile phase (v/v/v) was water (containing 0.25 ml/L triethylamine), methanol and acetonitrile (50:38:37, pH adjusted to 3.0±0.1). Chromatographic separation was achieved on Hypersil®-Gold C18 (150 x 4.6 mm, 5 µm, Thermo Fisher Scientific, USA), column at 25 ± 2 °C. The method was validated as per the “International Conference on Harmonisation” (ICH) guidelines. Chromatographic run time was 10.0 minutes. The linearity range for valsartan and hydrochlorothiazide were 1.25-64.00 µg/ml and 0.195-10.00 µg/ml respectively. The limits of detection (LOD) for valsartan and hydrochlorothiazide were 0.253 and 0.0226 μg/ml while the limits of quantitations (LOQ) were 0.767 and 0.068 μg/ml respectively, using 10µl sample. Stability studies indicate that the degradation of valsartan was higher during oxidative stress than other stress.
KEYWORDS:Valsartan; hydrochlorothiazide; Central Composite Design; Design of experiments (DoE); Analytical Quality by Design (AQbD); Response surface methodology (RSM); HPLC
Download this article as:| Copy the following to cite this article: Shakya A. K. Development and Validation of A Stability-Indicating Liquid Chromatographic Method for Determination of Valsartan and Hydrochlorthiazide Using Quality by Design. Orient J Chem 2016;32(2) |
| Copy the following to cite this URL: Shakya A. K. Development and Validation of A Stability-Indicating Liquid Chromatographic Method for Determination of Valsartan and Hydrochlorthiazide Using Quality by Design. Orient J Chem 2016;32(2). Available from: http://www.orientjchem.org/?p=15941 |
Introduction
Valsartan is a non-peptide compound, chemically describes as “(S)-3-methyl-2-(N-{[2′-(2H-1,2,3,4-tetrazol-5-yl)biphenyl-4-yl]methyl}-pentanamido)-butanoic acid”, (Val, Figure 1a) used as angiotensin II receptor antagonist having high specificity for AT1 subtype1. Angiotensin II receptor antagonists, also known as angiotensin receptor blockers (ARBs) or sartans, are a group of pharmaceuticals that modulate the renin-angiotensin-aldosterone system. Currently, there are seven ARBs (losartan, valsartan, candisartan, irbesartan, eprosartan, telmisartan and olmisartan) which are approved by USFDA and used in preventing first occurrence of atrial fibrillation than beta-blocker (atenolol) or calcium antagonist (amlodipine) therapy2. Hydrochlorothiazide chemically describes as “6-chloro-3,4-dihydro-2H-1,2,4-benzothiadiazine-7-sulfonamide” (HCT, Figure 1b) is used as diuretic in binary combination with the cardiovascular agents in order to increase their effects3-4. Several HPLC methods for the estimation of ARB along with HCT4-6 were reported during last two decades. Simultaneous determination of Val and HCT using various spectrophotometric methods7-11, HPLC12-16, HPTLC15,17, and capillary electrophoresis18 is documented. Additionally, HPLC-MS–MS was applied for the quantification of both drugs in human plasma19-21.
Although a few published methods, are stability indicating developed on random basis by modifying a single parameter (“One parameter at a time”, OPAT). ICH (ICH, Q8-R1, R2) guideline states “Quality by Design” (QbD) as “a systematic approach to development that begins with predefined objectives and emphasizes product and process understanding and process control, based on sound science and quality risk management” 22,23. Literature survey reveals that a non-stability indicating HPLC method16 was developed utilizing design of experiment protocol (DoE) for estimation of valsartan. The parameters studied were pH (2.8 to 3.2), flow-rate (0.8 to 1.2 ml/min) and detection wavelength (248 to 252 nm). Careful examination indicates that the pH and wavelength are producing moderate slight effect on the peak area, tailing factor and theoretical plate count (perturbation plots and equation)16. The composition of mobile phase was kept constant. Since the valsartan is a BCS class II drug has low solubility, a proper selection of mobile phase is requires, while HCT is having different characteristic. Keeping these parameters in mind the present method was developed. Pharmaceutical industries are paying more attentions on the development of analytical methods utilizing “Quality by Design” (QbD). Robust analytical methods which can deliver the intended performance can be developed and validated utilizing the concepts of “Analytical Quality by Design”(AQbD). AQbD uses a systematic approach to ensure quality by developing a thorough understanding of interaction of different component and process involved in analysis. The method development and validation utilising different aspects of AQbD can be improved and optimized for the routine analysis, quality control and analysis of product under development. Several analytical methods having deficiencies are still used for the quality control and analysis can be improved using the AQbD. The experimental conditions with different variables (two or more) can be optimized using “Design of experiments” (DoE) 23-29. The present work was aimed to develop, optimize and validate a sensitive, specific, precise, accurate and stability indicating method for the estimation of Val and HCT (in presence of possible degraded products) in active pharmaceutical ingredient (API) and tablets utilizing “Analytical Quality by Design”.
Material and Methods
Valsartan (Val) and Hydrochlorothiazide (HCT) were received from Hetero Pharmaceutical Ltd, Hyderabad, India. Formulation of Val and HCT were purchased from local pharmacies in India. Acetonitrile and methanol (HPLC grade) were purchased from Tedia Company (Fairfield, USA). Double distilled and deionised water was used throughout the analysis. Sodium hydroxide), hydrochloric acid and hydrogen peroxide, were purchased from Merck. Prepared mobiles phases were filtered using vacuum filtration unit (Isolab, Germany) with Nylon filters (0.22 μm). Shimadzu (Japan) analytical balance was used. The pH of the mobile phases was monitored using WTW-720 pH meter.
Instrumentation and Chromatographic conditions
Prominence UFLC System (Shimadzu® Kyota, Japan) equipped with quaternary gradient pump (model 20-AD), PDA detector (SPD-M-20A), an auto-sampler (SIL-20A) and a CBM-20A was used. The signals were acquired and analyzed using LC-solution chromatography work station software (version 1.25). The chromatographic signals were acquired between 200 to 350nm from PDA detector. The samples were analysed using Hypersil®-Gold C18 (150 × 4.6 mm, 5 µm, Thermo Fisher Scientific, USA) column and optimised mobile phase (v/v/v) consisted water (containing 0.25 ml/L triethylamine), methanol and acetonitrile (50/38/37, pH 3.0 ± 0.1, adjusted using orthophosphoric acid). All analyses were carried out at 271 nm using 10µL sample. The mobile phase flow rate was 1.0 ml/min.
Method development
Preparation of stock solutions, standards and QC samples
Stock solution (1 mg/ml) of Val and HCT were prepared separately in 50% aqueous methanol and stored in refrigerator. Working solutions, calibration standards (0.1955-10 µg/ml for HCT and 1.25-64 µg/ml for Val) and quality control samples (HCT- 0.25, 5.0 and 9.0 µg/ml; Val- 1.6, 32.0 and 57.6 µg/ml) were prepared separately as required and kept in refrigerator.
Preparation of Sample for Assay
Average weight of twenty tablets (containing 12.5 mg HCT and 80 mg Val) was determined. Tablets were triturated to a fine powder. A quantity of powder equivalent to 12.5 mg HCT and 80 mg Val was weighed accurately and transferred to 100 ml calibrated volumetric flask. Methanol (50%, 25ml) was added and contents were sonicated for 10 minutes. The volume was made up to the mark with mobile phase and filtered using 0.22 µm nylon filter (Micro-syringe filter). Appropriate dilutions were prepared for analysis.
Software aided method optimization and data analysis
Central composite design (CCD) and Box-Behnken design (BBD) are used for method development and optimization. Several factors were considered for method development including percentage of aqueous and organic phase in mobile phase. Central composite design (CCD) requires 20 experiments with 3 variables was selected in order to develop and optimise the chromatographic method. The conditions, observed responses and levels are presented in Table 1. Design Expert® software (Version 8.0.6, Stat-Ease Inc., Minneapolis, MN) was used for experimental design, data analysis and construction of regression model.

Where Y is the measured response (resolution factor Rs, or Tailing factor Tf) associated with each factor level combination: Water (A), Methanol (B) and Acetonitrile (C). The minimum and maximum volume fractions for aqueous phase and organic phases were 50-70 and 20-40 respectively. Mobile phases of different composition (v/v/v) were prepared and the pH of the mobile phase was adjusted to 3.0 ± 0.1 (using orthophosphoric acid). Retention times, ultraviolet spectrum and peak purity were used to identify different drugs. The resolution factor (Rs) and Tailing factor (Tf) were calculated using LC-solution chromatographic software and are presented in Table 1. Analysis of variance (ANOVA), a regression analysis and the plotting of response surface were performed to establish optimum conditions for the resolution and tailing factor of analytes. Fitness of the responses and test adequacy for quadratic, 2-function interaction, linear functions of variable was studied using ANOVA. P-values (P > F) less than 0.05 was considered as significant in different models. The highest-order significant polynomial equation with insignificant lack of fit (P > 0.100) was selected. The predicted residual sum of the squares (PRESS) was used as a measure of fit of the model to the points in the design.
Chromatographic analysis
Samples of Val and HCT were analysed as per protocol. 20 Different mobile phases were tested to choose the appropriate mobile phase for the analysis. System suitability parameters were evaluated for good chromatographic analysis.
Analytical Method validation
The analytical method was validated as per recommendation of “International Conference on Harmonisation” 22-23.
System Suitability
System suitability parameters were tested with six replicate injections of the Val (25.00 µg/ml) and HCT (3.906 µg/ml) sample at the start of the project. The system suitability parameters were calculated using the internal features of LC solution software as per United States Pharmacopoeia26. The parameters were retention time, peak area and height, width at half peak height, tailing factor, efficiency and height equivalent theoretical plate (HETP). System suitability was measured on the basis of precision (RSD). The precision, as measured by coefficient of variation was determined at each set parameters and it should be less than 2.
Linearity, Limit of Detection (LOD), and Limit of Quantitation
Six different calibration curves were prepared on 3 different days. To define the correlation between the response and concentration of analytes, the area was plotted against concentration of analytes with weighting factor (x, 1/x, or 1/x2). The method was evaluated by determination of the correlation coefficient and intercept values. The linear best fit line (weighting factor x) was used to measure the concentration of all samples throughout the batch. The acceptance criterion for each back calculated concentration was less than 2% from nominal values except for LOQ. A 5% significance level was used for evaluation. LOD and LOQ were determined from the calibration function.
Precision
Quality control samples (n=3) were analysed on different occasions (n=3) and three different days. The precision (RSD) of the method was determined as intraday precision (repeatability) and intermediate precision. The intermediate precision was estimated from the RSD of the analysis of the different samples prepared at the same concentration but on 3 different days, while intraday precision was calculated by analyzing the same concentration during the same day at different time.
Accuracy
Accuracy (as percentage recovery) was measured using replicate sample of analytes prepared using tablet triturate assayed earlier. Different samples (at level 80%, 100% and 120%) were prepared using tablet triturate (12.5 mg HCT and 80 mg Val as 100 %) and adding known quantity of HCT and Val (at 80% – 120% level). From these fortified samples, appropriate sample solutions were prepared, analyzed and the total amount recovered was calculated. Accuracy was calculated by comparing with true value. The concentrations were back calculated by regression equations.
Ruggedness
Ruggedness was accessed by intentionally changing the chromatographic parameters and evaluating their impact on analysis. The ruggedness of the method was evaluated on the basis of precision (RSD < 2%).
Stress studies
Stress studies were conducted using different stress conditions viz. oxidative, alkaline, acidic stress, exposure to sunlight and UV light. Sample exposed to different stressed conditions were processed, analyzed (n=3) and chromatograms were evaluated. UV spectra and peak purity were used to judge the specificity of method.
Acidic and alkaline degradation studies
Analytes (HCT 5 mg and Val 32 mg) were weighed accurately and transferred to 50 ml volumetric flask. These samples were shaken with 5 ml of either 1M hydrochloric acid (HCl) or 1M sodium hydroxide (NaOH) for 1 h. Reaction was terminated by addition of mobile phase; samples were processed and analyzed after suitable dilution.
Oxidization degradation studies
Analytes (HCT 5 mg and Val 32 mg) were weighed accurately, transferred to 50 ml volumetric flask and shaken with 5 ml H2O2 (40%) for 3h at 60 °C. After 1h the samples were diluted with mobile phase, processed and analyzed.
Photolytic degradation
A mixture of HCT and Val (1g, 12.5:80, w/w), was placed in an open watch glass and exposed to either UV-irradiation (~100 W/m2) or direct sunlight for two hours with occasionally shifting of the content using stainless steel spatula. After 2 hours, 25 mg of sample was weighed, processed as described earlier and analyzed. Similar experiments were conducted using the equivalent amount of tablets triturate (HCT 5 mg and Val 32 mg).
Results and Discussion
Method Development
Analytes were analysed using 20 different mobile phases (as per Central Composite Design protocol) and the retention time, tailing factor, resolution factor along with retaintability was calculated. HCT and Val were eluted at ~2.0 and 5.7 min using optimised mobile phase at ambient temperature. The absorption maximum of the drug at 271 nm was selected for detection, as there was no interference from excipients present in drug. The resolution factor was ~13.9. Representative chromatograms are presented as Figure 2.
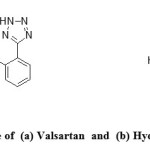 |
Figure 1: Structure of (a) Valsartan and (b) Hydrochlorothiazide Click here to View figure |
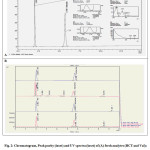 |
Figure 2: Chromatogram, Peak purity (inset) and UV spectra (inset) of (A) fresh analytes (HCT and Val); (B) Stressed study sample (1) fresh sample, (2) tablet sample exposed to oxidative stress, (3) alkaline stress and (4) acidic stress conditions. Click here to View figure |
Design of experiment and method optimization
A three factorial, Central Composite Design was used and 20 different experiments were conducted. The independent, dependent variables and observed responses are given in Table 1. The best fitted model was the quadratic model for resolution factor and retaintability factor for analytes. No statistical correlation was made for tailing factor (Tf). The comparative values of R and SD for proposed quadratic model are given in Table 2 along with regression equation generated for the selected response. Only statistically significant (p < 0.05) coefficient are included in the regressed equation after model reduction (insignificant model terms are removed to improve the model). A positive value in the equation indicates the favourable response while a negative value indicates an inverse relationship between the factor and the response. It is evident from Table 2, that factor A (buffer), has a positive impact on the resolution factor, while acetonitrile (B) and methanol (C) are having negative effect. In case of retaintability factor for valsartan these factors are producing opposite effect. Similar effects were noticed in case of study of losartan and hydrochlorothiazide using Box-Behnken design4.
Table 1: Factor level and observed responses in Central Composite design for 20 experimental trial
|
Std Run |
Type
|
Water A (v) |
Methanol B (v) |
Acetonitrile C (v) |
Resolution Factor Y1=Rs |
Retaintability Factor Y2 =Tp/Rt |
Tailing Factor for Val Y3 =Tf |
|
1 |
Factorial |
50 |
20 |
20 |
37.30 |
525.1 |
1.085 |
|
2 |
Factorial |
70 |
20 |
20 |
44.61 |
180.0 |
1.215 |
|
3 |
Factorial |
50 |
40 |
20 |
21.50 |
537.0 |
1.048 |
|
4 |
Factorial |
70 |
40 |
20 |
30.43 |
212.2 |
1.011 |
|
5 |
Factorial |
50 |
20 |
40 |
14.56 |
1230.4 |
1.107 |
|
6 |
Factorial |
70 |
20 |
40 |
24.06 |
633.1 |
1.102 |
|
7 |
Factorial |
50 |
40 |
40 |
12.25 |
1376.8 |
1.155 |
|
8 |
Factorial |
70 |
40 |
40 |
22.63 |
851.0 |
1.103 |
|
9 |
Axial |
43.18 |
30 |
30 |
15.24 |
1281.1 |
1.206 |
|
10 |
Axial |
76.82 |
30 |
30 |
35.49 |
475.1 |
1.245 |
|
11 |
Axial |
60 |
13.18 |
30 |
33.15 |
558.8 |
1.125 |
|
12 |
Axial |
60 |
46.82 |
30 |
15.58 |
631.4 |
1.110 |
|
13 |
Axial |
60 |
30 |
13.18 |
39.95 |
101.2 |
1.075 |
|
14 |
Axial |
60 |
30 |
46.82 |
14.10 |
1285.4 |
1.148 |
|
15 |
Center |
60 |
30 |
30 |
29.11 |
950.1 |
1.251 |
|
16 |
Center |
60 |
30 |
30 |
26.51 |
874.9 |
1.210 |
|
17 |
Center |
60 |
30 |
30 |
27.69 |
925.0 |
1.221 |
|
18 |
Center |
60 |
30 |
30 |
27.81 |
902.1 |
1.179 |
|
19 |
Center |
60 |
30 |
30 |
27.75 |
900.9 |
1.191 |
|
20 |
Center |
60 |
30 |
30 |
27.78 |
895.1 |
1.210 |
| Dependent FactorsY1 = Rs = Resolution Factor (HCT and Valsartan)Y2 = Tp/Rt = Retaintability of Valsartan
Y3 = Tf =Tailing factor for Valsartan |
|||||||
The coefficients for the model were estimated by least squares regression. The relationship between the response factors (Rs and retaintability) and independent factors is quadratic. An independent factor can produce different degree of response when the different factors (A, B or C) are changed simultaneously. Perturbation and two dimensional contour plots are presented as Figure 3 (a-d), which are used for studying the interaction effects of independent factors on the responses. Perturbation plot (Figure 3a, for resolution factor, Rs) indicates that the Factor B exhibits a noticeable curvature while factors C exhibit no curvature. Factor A exhibits only a slight curve. Only two of these three factors can be included on the contour plot. Figure 3b shows the contour plot for resolution factor versus independent factor B (methanol), C (acetonitrile) and A (buffer) at its center point value (C=60). As observed in perturbation plot (Figure 3a) and contour plot (Figure 3b), an increase in methanol (B) and acetonitrile (C) concentration at constant buffer concentration (A=60) decreases the resolution factor of Val and HCT. Keeping these observations in knowledge the resolution factor Rs was considered during method optimization and mobile phase selection step.
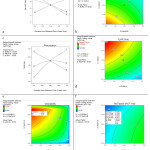 |
Figure 3: Perturbation and 2-D contour plots for (a, b,) resolution factor ; (c, d) retaintability factor for Val versus independent factor (A-buffer, B-methanol, C-acetonitrile); (e) Point prediction utilizing desirability plot, and (f) predicted point for resolution factor (Rs=14). Click here to View figure |
As far as retaintability of analytes are concerned, it is evident from Figure 3c-d and Table 2, that an increase in acetonitrile content (C) at constant methanol (B) and buffer (A) content increases the retaintability of Val. Product of factor B and C (B×C) is having positive impact on retaintability (Tp/Rt) of Val, while Factor A, A×C, B2 and C2 are having negative impact (Table 2). The correlation between retaintability and independent factors was good as the “Predicted R2” of 0.9797 is close to the “Adjusted R2” of 0.9946 as one might normally expect. All regressed equations for the response factors are given in Table 2. No statistical correlation was observed for tailing factor. Therefore, it was not considered during method optimization. After studying the statistical analysis (utilizing diagnostic tools of software) and analysing the 2D contour, 3D response surface (not shown) and perturbation plot, the mobile phase was selected for analysis.
Table 2: Regressed equation obtained for the resolution factor and retaintability factor
| Model |
SD |
R2 |
Adjusted R2 |
Predicted R2 |
PRESS# |
| Resolution Factor (Y1) | |||||
| Quadratic |
1.18 |
0.9885 |
0.9832 |
0.9532 |
65.36 |
| Regression equation of the fitted quadratic model for Y1 after model reduction (in terms of actual factors)Y1 = Rs = 26.91 +1.392.A -0.796.B – 1.745.C + 0.0327B.C – 0.00073 A2-0.0108.B2 | |||||
| Retaintability Factor (Y2) | |||||
| Quadratic |
34.24 |
0.9946 |
0.9915 |
0.9797 |
53244.5 |
| Regression equation of the fitted quadratic model for Y2 after model reduction (in terms of actual factors)Y2=Tp/Rt = -1232.74 – 6.052A + 59.611.B + 102.788C – 0.5667A.C+ 0.3999B.C – 1.128 B2 – 0.781C2 | |||||
| * Case(s) with leverage of 1.0000; #predicted residual sum of the squares (PRESS) statistics not defined. No correlation was observed for Y3=Tf, Tailing factor. | |||||
It was decided to keep the resolution factor Rs constant to 14 during optimization step. The desirability plot (Fig. 3e) and several different mobile phase compositions were generated by the software. The optimized mobile phase (having “desirability factor=0.995”) was selected for analysis utilizing desirability plot. The optimised mobile phase (v/v/v) consisted of water (containing 0.25 ml/L triethylamine), methanol and acetonitrile (50/38/37, pH 3.0 ± 0.1, adjusted using orthophosphoric acid). The observed resolution factor (Rs) was 13.8 using optimized conditions. The results indicate that the present method is capable of separating Val, HCT and degraded product with significant retaintability.
Method Validation
Analytical Validation
The “International Conference on Harmonisation” (ICH) guidelines22,23 were used for the validation of the method with respect to precision, linearity, accuracy, limit of detection (LOD), and limit of quantitation (LOQ).
System suitability
The low value of precision (RSD less than 0.65%), for retention time, peak area, peak height, tailing factor, theoretical plates, peak width and HETP, indicating the appreciable system suitability of method (Table 3).
Table 3: System suitability parameters (n=6) for Val and HCT
|
Parameter |
Tr (min.) |
Area |
Height |
Tailing Factor |
Theoretical Plate |
USP Width |
HETP |
| Val | |||||||
|
Mean |
5.831 |
212301.3 |
21503 |
1.081 |
7234.91 |
0.274 |
5.831 |
|
SD |
0.012 |
119.4 |
19.4 |
0.001 |
1.51 |
0.001 |
0.012 |
|
RSD |
0.21 |
0.06 |
0.09 |
0.09 |
0.02 |
0.36 |
0.21 |
| HCT | |||||||
|
Mean |
2.029 |
173672.1 |
33283 |
1.251 |
2820.75 |
0.153 |
2.029 |
|
SD |
0.001 |
141.2 |
25.5 |
0.001 |
1.95 |
0.001 |
0.001 |
|
RSD |
0.05 |
0.08 |
0.08 |
0.08 |
0.07 |
0.65 |
0.05 |
Calibration, linearity, limit of detection (LOD) and limit of quantitation (LOQ)
Different calibration curves (n=5) were constructed which were linear over the concentration range of 1.25 to 64.00 µg/ml for Val and 0.195-10.00 µg/ml for HCT respectively. Peak areas were plotted versus concentration and linear regression was performed using Microsoft office excel 2007 software. The mean regression equation using weighting factor – x are given in Table 4. The correlation coefficient was greater than 0.9999. The LOD for valsartan and hydrochlorothiazide were 0.253 and 0.0226 μg/ml while the LOQ were 0.767 and 0.068 μg/ml respectively.
Table 4: Linearity data (n=6) of the proposed method
|
Val |
HCT |
||
|
Concentration (µg/ml) |
Mean Area |
Concentration (µg/ml) |
Mean Area |
|
1.25 |
10876 |
0.195 |
8140 |
|
2.5 |
21374 |
0.391 |
16454 |
|
5 |
42510 |
0.781 |
32689 |
|
10 |
83782 |
1.563 |
65661 |
|
15 |
126676 |
2.344 |
98180 |
|
25 |
213958 |
3.906 |
163655 |
|
40 |
344971 |
6.250 |
261762 |
|
50 |
424866 |
7.813 |
326706 |
|
64 |
547795 |
10.000 |
419273 |
|
Slope |
8559.82 |
Slope |
41884.4 |
|
Intercept |
-476.95 |
Intercept |
20.69998 |
|
r² |
0.99992 |
r² |
0.99991 |
|
y=8559.82(+66.8)x – 476.95(+496.0) |
y=41884.4(+252.9)x + 20.69(+268.9) |
||
Table 5: Precision study of the proposed method
| Drug |
Concentration (µg/ml) |
Intraday precision (n=3) |
Interday precision (n=3) |
||
|
Area Count (Mean ± SD) |
RSD |
Area Count (Mean ± SD) |
RSD |
||
| Val |
1.6 |
13218.3 ± 236.8 |
1.79 |
13512.1 ± 198.5 |
1.47 |
|
32.0 |
273436.2 ± 3056.5 |
1.12 |
286751.2 ± 765.4 |
0.27 |
|
|
57.6 |
493567.8 ± 3672.1 |
0.74 |
495732.5 ± 2324.5 |
0.47 |
|
| HCT |
0.25 |
10541.5 ± 133.2 |
1.26 |
10751.1 ± 198.5 |
1.85 |
|
5.0 |
210551.9 ± 556.2 |
0.26 |
208198.7 ± 765.4 |
0.37 |
|
|
9.0 |
377891.5 ± 875.1 |
0.23 |
382365.3 ± 1580.1 |
0.41 |
|
Precision and accuracy
The intra-day precision and inter-day precision were less than 1.79% and 1.85% respectively for different samples during the study. Low precision values (less than 2%) indicate the repeatability of the developed analytical method (Table 5). The accuracy of the method was performed by addition of analytes in samples at three different levels (80%, 100% and 120%). The percent recovery was found in the range of 98.2 to 101.0 %. The accuracy studies indicate that the present method is accurate as the greatest bias was 0.52%. (Table 6).
Table 6: Recovery Study (Accuracy of the method)
|
Drug |
Amount Taken |
Amount Added |
Amount Recovered |
RSD |
||
|
(mg) |
% |
(mg) |
Mean ± SD (mg) |
Percent |
||
|
Val
|
80.0 |
80 |
64.0 |
141.45 ± 0.43 |
98.2 |
0.44 |
|
80.0 |
100 |
80.0 |
158.39 ± 0.51 |
99.0 |
0.52 |
|
|
80.0 |
120 |
96.0 |
177.25 ± 0.28 |
100.7 |
0.28 |
|
|
HCT
|
12.5 |
80 |
10.0 |
22.35 ± 0.26 |
99.3 |
0.26 |
|
12.5 |
100 |
12.5 |
25.25 ± 0.23 |
101.0 |
0.23 |
|
|
12.5 |
120 |
15.0 |
27.27 ± 0.26 |
99.2 |
0.26 |
|
Specificity
The chromatograms obtained during method development and validation studies were analysed and evaluated. The present HPLC method is specific and selective. The peaks were well separated and no interfering peaks were observed at the retention of analytes. The peak purity indexes were more than 0.9999, indicating absence of co-eluting substance along with analytes (Figure 2).
Robustness
Robustness of the methods was illustrated by getting the resolution factor and tailing factor, when mobile phase aqueous phase content (± 1%), pH (± 0.1 units), and flow rate (± 0.1 ml/min), were deliberately varied. The deliberate changes in the method does not affect the retention time, tailing factor and area count for drug significantly (RSD < 2%). The precision revealed that different parameters did not affect influence the analysis significantly, so that the developed method was considered rugged and robust (data not shown).
Stability Studies
The stock solution and samples were stable up to 21 days (between 2-8˚C). No degraded products were noticed in these samples during studies. The peak purity was 0.995 or more during the validation studies. On exposure to hydrogen peroxide (40%, 3h), Val produces 4 minor degradation products having retention time 2.444, 3.134, 4.524 and 8.359 min. The percent of valsartan remained after oxidative stress was 70.5 and 77.5% respectively in API and tablet samples. The percent of HCT remained was more than 92.5%. No degradation products for HCT were noticed (Figure 2, Table 7). A minor degradation product for Val was noticed under alkaline and acidic stress studies. On exposure to different stress conditions, the degradation of Val and HCT in tablet was lesser than API, which might be due to presence of pharmaceutical excipients.
Table 7: Stability data under different stressed conditions
| Stress condition |
API |
Tablets |
||
|
% Val remained |
% HCT Remained |
% Val remained |
% HCT Remained |
|
| Oxidative Stress (40 % H2O2) |
70.5 |
92.5 |
77.5 |
93.5 |
| Acidic Stress (1N HCl) |
99.1 |
99.6 |
99.2 |
99.8 |
| Alkaline stress (1N NaOH) |
99.7 |
99.7 |
99.8 |
99.8 |
| Ultraviolet light (2 Hour, 100W.m-2) |
99.9 |
99.9 |
100.0 |
99.9 |
| Direct Sunlight |
99.9 |
99.9 |
100.0 |
100.0 |
| Aqueous Stability (After 21 days) |
99.9 |
99.9 |
99.9 |
99.8 |
Assay
The present method was applied for the assay of Tablet formulations of Val and HCT. The assay of Val and HCT were 99.53 and 99.42% respectively. The percent purity of Val and HCT (API) were 99.63 and 99.72% respectively. Low value of precision indicates that the method can be used precisely for the estimation of drug in formulations (Table 8).
Table 8: Assay of marketed pharmaceutical formulation and API
|
Drug/formulation |
% Assay |
SD (RSD) |
| Val & HCT Tablet | 99.53 | 0.11 (0.11) |
| 99.42 | 0.13 (0.13) | |
| Val (API) | 99.63 | 0.09 (0.09) |
| HCT (API) | 99.72 | 0.03 (0.03) |
Table 9: Summary of the regression and validation parameters
| SN | Parameters |
Val |
HCT |
| 1. | Linearity range (µg/ml, n=6) |
1.25 – 64.00 |
0.195 – 10.00 |
| 2. | Correlation coefficient (r2 ± SD) |
0.99992 ± 0.00003 |
0.99991 ± 0.00005 |
| 3. | Slope (Mean) |
8559.82 |
41884.40 |
| 4. | Intercept (Mean) |
-476.95 |
20.69 |
| 5. | Limit of detection, (LOD, µg/ml) |
0.253 |
0.0226 |
| 6. | Limit of quantization,(LOQ, µg/ml) |
0.767 |
0.068 |
| 7. | Accuracy (%) |
98.2 – 100.7 |
99.2 – 101.0 |
| 8. | Intra-day Precision (%) |
0.74 – 1.79 |
0.23-1.26 |
| 9. | Inter-day Precision (%) |
0.47 – 1.47 |
0.37-1.85 |
| 10 | Assay of API (Mean ± SD) (%)Assay of Tablets (Mean ± SD) (%) |
99.63 ± 0.09 |
99.72 ± 0.03 |
|
99.53 ± 0.11 |
99.42 ± 0.13 |
The regression and validation parameters are summarised in Table 9.
Conclusion
A new HPLC method for the estimation of valsartan and hydrochlorothiazide has been developed using design of experiments using Central Composite Design and validated as per ICH guideline. The present method is simple, rapid, economical, accurate, precise, specific, robust and stability indicating. No interference has been observed from the excipients or degraded product.
Acknowledgement
Author wish to thank “Dean, Faculty of Pharmacy and Medical Sciences, Dean, Higher education and Research, Al-Ahliyya Amman University, Amman, Jordan” for providing necessary facilities.
References
- Grundy, S.M., Brewer, H.B., Cleeman, J.I., Smith, S.C., Lenfant, C., 2004. NHLBI/AHA conference proceedings. Circulation, 2004, 109, 433–438.
CrossRef - Nixon, R. M.; Müller, E.; Lowy, A.; Falvey, H. International Journal of Clinical Practice, 2009, 63(5), 766–775.
CrossRef - Bhusari, K. P.; Khedekar, P. B.; Dhole, S.; Banode, V. S. Indian Journal of Pharmaceutical Sciences, 2009, 71(5), 505–508.
CrossRef - Shakya, A.K. Jordan J. Pharm. Sci., 2015, 8, 173-185.
- Rudrapal, M; Oduri, M. U; Samidala, N. R; Kiran, B. V. V. S. S; Junejo, J. A; Singh, K. D; Chakraborty, T; Debnath M. Orient. J. Chem., 2015; 31(2). Available from:http://www.orientjchem.org/?p=8884.
- Sasidhar, R.L.C.; Vidyadhara, S.; Deepti, B.; Tejaswi, K.; Suhasini, J. Orient. J. Chem. 2014; 30(4). Available from: http://www.orientjchem.org/?p=6125
- Satana, E.; Altinay, S.; Goger, N.G.; Ozkan, S.A.; Senturk, Z. J. Pharm. Biomed. Anal., 2001, 25(5-6), 1009–1013.
CrossRef - Erk N. Anal. Lett., 2002, 35(2), 283–302.
CrossRef - Dinc, E.; Uslu, B.; Oezkan, S.A. Anal. Lett., 2004, 37(4), 679–693.
CrossRef - Lakshmi, K.; Lakshmi, S. Acta. Pharm., 2011, 61(1), 37–50.
CrossRef - Deshpande, M.M.; Ahajan, M.P.; Sawant, S.D. Int. J. Pharm. Sci., 2012, 3(1), 235–240.
- Ahmed, S.; Atia, N.N.; Mohamed, N.A. Talanta, 2011, 84(3), 666–672.
CrossRef - Ivanovic, D.; Malenovic, A.; Jancic, B.; Medenica, M.; Maskovic, M. J. Liq. Chromatogr. Relat. Technol., 2007, 30(19), 2879–2890.
CrossRef - Tian, D.F.; Tian, X.L.; Tian, T.; Wang, Z.Y.; Mo, F.K. Indian J. Pharm. Sci., 2008, 70(3), 372-374.
CrossRef - Galande, V.R. ; Baheti, K.G.; Dehghan, M.H. Indian Drugs, 2011, 48(4), 49–56.
- Kumar, L.; Reddy, M.S.; Managuli, R.S.; Pai, G.K. Saudi Pharm. J., 2015, 23(5), 549-555.
CrossRef - Kadam, B.R.; Bari, S.B. Acta Chromatographica, 2007, 18, 260–269.
- Hillaert, S.; Van den Bossche, W. J. Pharm. Biomed. Anal., 2003, 31(2), 329–339.
CrossRef - Li, H.; Wang, Y.; Jiang, Y.; Tang, Y.; Wang, J.; Zhao, L.; Gu, J. J. Chromatogr. B: Anal. Technol. Biomed. Life Sci, 2007, 852(1–2), 436–442.
CrossRef - Liu, F.; Zhang, J.; Xu, Y.; Gao, S.; Guo, Q. Anal. Lett., 2008, 41(8), 1348–1365.
CrossRef - Shah, H.J.; Kataria, N.B.; Subbaiah, G.; Patel, C.N. Chromatographia, 2009, 69(9–10), 1055– 1060.
CrossRef - Stability ICH Testing of New Drug Substances and Products Q1A (R2), International Conference on Harmonization, IFPMA, Geneva, Switzerland, 2003.
- International Conference on Harmonisation of Technical Requirements for Registration of Pharmaceuticals for Human Use, ICH Harmonised Tripartite Guideline. Validation of Analytical Procedures: Text and Methodology Q2(R1), Step 4, 2010.
- FDA/CEDR Web News, 2012. http://www.fda.gov/downloads/Drugs/DevelopmentApprovalProcess/SmallBusinessAssistance/UCM319879.pdf (accessed on 10.01.15).
- Anderson, M.J.; Patrick, J.W. RSM Simplified: Optimizing processes using response surface methods for design of experiments, CRC Press, Taylor and Francis group, New York, 2004.
- The United States Pharmacopoeia (USP), USP 37/NF 32. United States Pharmacopeial Convention, Rochville, Md, USA, 2014.
- Krull, I.; Swartz, M.; Turpin, J.; Lukulay, P.H.; Verseput, R. LC-GC. N. Am. 2009, 27, 48–61.
- Monks, K.E.; Rieger, H.-J.; Molnar, I. J. Pharm. Biomed. Anal., 2011, 56, 874–879.
CrossRef - Dawud, E.R.; Shakya, A.K. Arabian J. Chem. 2014. http://dx.doi.org/10.1016/j.arabjc.2014.10.052.
CrossRef

This work is licensed under a Creative Commons Attribution 4.0 International License.
![]()
A New Edition of Web of Science
Journal Impact Factor
2022: 0.5
Five Year: 0.8
Journal is Indexed in

Cabells Whitelist
![]()


